Stacked Area 100% Charts
RadChart has been deprecated since Q3 2014 and is no longer recommended for use, as it does not support modern browsers. We strongly recommend using RadHtmlChart, Telerik's modern client-side charting component. To transition from RadChart to RadHtmlChart, refer to the following migration articles:
Explore the RadHtmlChart documentation and online demos to determine how it fits your development needs.
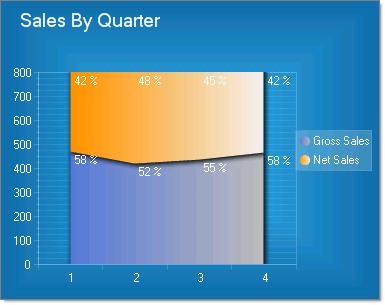
Stacked Areas 100% charts are a variation of Stacked Area charts that present values for trends as percentages, totaling to 100% for each category
To create a Vertical Stacked Area 100% Chart set the SeriesOrientationproperty to Vertical. Set the RadChart DefaultType property or ChartSeries.Type to StackedArea100.
To create a Horizontal Stacked Area 100% Chart set the SeriesOrientationproperty to Horizontal. Set the RadChart DefaultType property or ChartSeries.Type to StackedArea100.
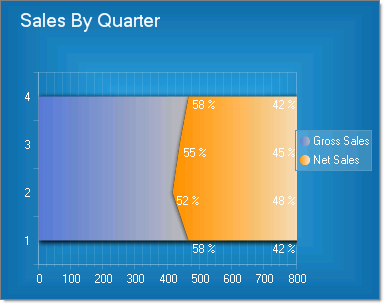
To display the label values as percentages, change the DefaultLabelValue for each chart series from "#Y" (the numeric value for each data point) to "#%" (the percentage of each data point to the category).