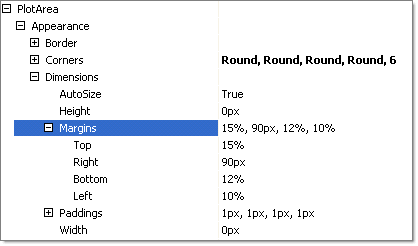
Margins
RadChart has been deprecated since Q3 2014 and is marked as obsolete as of the 2026 Q2 SP1 (v2026.2.708) release. This is the last release that includes the RadChart component — its source code will be removed from the assembly in the next release. We strongly recommend using RadHtmlChart, Telerik's modern client-side charting component. To transition from RadChart to RadHtmlChart, refer to the following migration articles:
Explore the RadHtmlChart documentation and online demos to determine how it fits your development needs.
Chart margins are the distances from the outermost chart borders to the borders of the plot area.
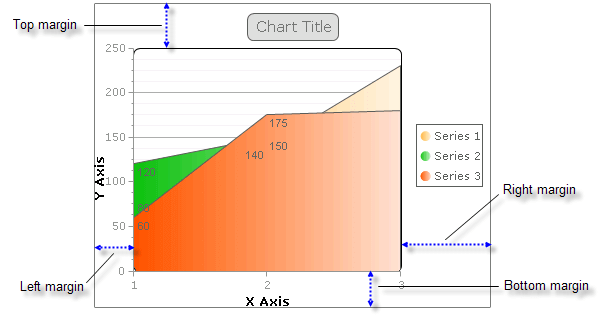
Margins are expressed in the RadChart PlotArea.Dimensions.Margins property and are specified in pixels or percentages. Percentages refer to a percentage of the RadChart width. In the figure below the dimensions are populated with some values in percentages, some in fixed pixels.
To provide extra space for positioning legends, labels and title, use greater margin values for the PlotArea to provide room.