Axis Labels
RadChart has been deprecated since Q3 2014 and is marked as obsolete as of the 2026 Q2 SP1 (v2026.2.708) release. This is the last release that includes the RadChart component — its source code will be removed from the assembly in the next release. We strongly recommend using RadHtmlChart, Telerik's modern client-side charting component. To transition from RadChart to RadHtmlChart, refer to the following migration articles:
Explore the RadHtmlChart documentation and online demos to determine how it fits your development needs.
Labels are displayed for each:
-
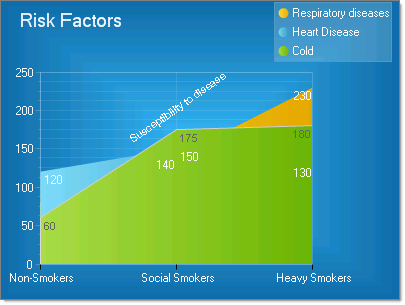
Chart axis to describe the category of values along the axis. For example "Products", "Risk Factors", time periods or geographic areas.
-
Chart axis item to describe the specific value or category for that item.
Formatting Axis Labels
-
To format the chart axis label use the PlotArea.
.AxisLabel to access Appearance and TextBlock properties -
To set the formatting for all labels on an axis use the PlotArea.
.Appearance LabelAppearance and TextAppearance properties. -
To format a label for a specific chart axis item use the PlotArea.
.Items[].Appearance property.
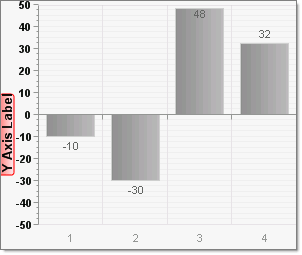
Use the MinValue and MaxValue properties to specify the minimum and maximum values for the data to display. The MinValue property allows you to specify either negative or positive number as the minimum value. In the example below the MinValue= -50, MaxValue= 50 and Step = 10.
The PlotArea..Appearance.ValueFormat property automatically formats axis label values as Currency, Scientific, General, Number, Percent, ShortDate, ShortTime, LongDate, LongTime or None.
Positioning Axis Labels
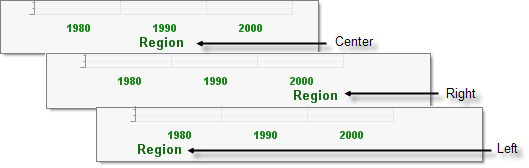
You can specify the horizontal and vertical alignment of axis labels and axis item labels using the Appearance.Position property of the axis label or chart axis item respectively. Position has sub properties for AlignedPosition, Auto, X and Y.
Use AlignedPosition to automatically place the label Right, Left, Top, Center, TopRight, TopLeft, BottomRight or BottomLeft.
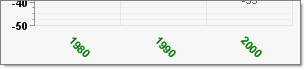
Use the RotationAngle property to spin axis and axis item labels to any angle.In the example below the XAxis.Appearance.LabelAppearance.RotationAngle is set to 45.
By turning off the Position.Auto property and setting Position.AlignedPosition to None you can place the axis label any where in the plot area. In the example below the PlotArea.YAxis.AxisLabel.Appearance.Position property is configured such that:
-
AlignedPosition =None
-
Auto = False
-
X = 120
-
Y = 200
The YAxis.AxisLabel.Appearance.RotationAngle = 325.
This isn't a recommended or usual approach but serves to illustrate the flexibility of the object model.
Also in the example below, the PlotArea.XAxis.AutoScale is turned off so the PlotArea.XAxis.Items collection could be populated manually.Each ChartAxisItem has its TextBlock.Text property populated with the strings "Non-Smokers", "Social Smokers" and "Heavy Smokers".