Styling Chart Elements
RadChart has been deprecated since Q3 2014 and is marked as obsolete as of the 2026 Q2 SP1 (v2026.2.708) release. This is the last release that includes the RadChart component — its source code will be removed from the assembly in the next release. We strongly recommend using RadHtmlChart, Telerik's modern client-side charting component. To transition from RadChart to RadHtmlChart, refer to the following migration articles:
Explore the RadHtmlChart documentation and online demos to determine how it fits your development needs.
RadChart offers a set of properties to modify the look and feel of its elements. See those elements marked on the image below consider the table showing where their customization properties are located in the chart properties grid.
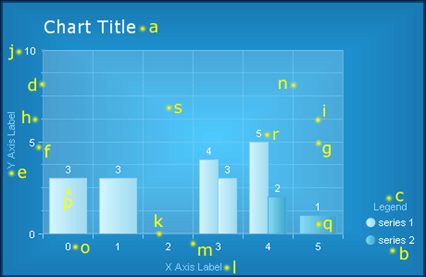
| Element | Properties |
|---|---|
| a. Chart Title | Elements -> ChartTitle -> Appearance; Elements -> ChartTitle -> TextBlock |
| b. Legend | Elements -> Legend -> Appearance |
| c. Legend TextBlock (Legend Title) | Elements -> Legend -> TextBlock |
| d. Y Axis | PlotArea -> YAxis -> Appearance |
| e. Y Axis Label (Axis Title) | PlotArea -> YAxis -> AxisLabel |
| f. Y Axis Major Tick | PlotArea -> YAxis -> Appearance -> MajorTick |
| g. Y Axis Major GridLine | PlotArea -> YAxis -> Appearance -> MajorGridLines |
| h. Y Axis Minor Tick | PlotArea -> YAxis -> Appearance -> MinorTicк |
| i. Y Axis Minor GridLine | PlotArea -> YAxis -> Appearance -> MinorGridLines |
| j. Y Axis Label (Digit) | PlotArea -> YAxis -> Appearance -> LabelAppearance |
| k. X Axis | PlotArea -> XAxis -> Appearance |
| l. X Axis Label (Axis Title) | PlotArea -> XAxis -> AxisLabel |
| m. X Axis Major Tick | PlotArea -> XAxis -> Appearance -> MajorTick |
| n. X Axis Major GridLine | PlotArea -> XAxis -> Appearance -> MajorGridLines |
| o. X Axis Label (Digit) | PlotArea -> XAxis -> Appearance -> LabelAppearance |
| p. Series 1 | Data -> Series -> [series name] -> Appearance -> Appearance |
| q. Series 2 | Data -> Series -> [series name] -> Appearance -> Appearance |
| r. Series Item Label | Data -> Series -> [series name] -> Appearance -> Appearance -> TextAppearance |
| s. PlotArea | Elements -> PlotArea -> Appearance |
Common Appearance Properties
All chart elements have common appearance settings, which are:
-
Border – border width, color and style
-
Corners – corner style and size
-
Dimensions – width, height, margin, padding
-
FillStyle – background color, image and gradients
-
Position
-
Shadow – color, distance and position
-
Visible – true or false