Grouping databound items
RadChart has been deprecated since Q3 2014 and is marked as obsolete as of the 2026 Q2 SP1 (v2026.2.708) release. This is the last release that includes the RadChart component — its source code will be removed from the assembly in the next release. We strongly recommend using RadHtmlChart, Telerik's modern client-side charting component. To transition from RadChart to RadHtmlChart, refer to the following migration articles:
Explore the RadHtmlChart documentation and online demos to determine how it fits your development needs.
DataGroupColumn property defines the name of the column in the underlying datasource which will be the criteria for grouping the chart series items into series. There will be as many series as the number of distinct values in this column. For each value there will be a ChartSeries in the chart.
GroupNameFormat property defines a format for the legend item when grouping is applied. This format can include free text, which will be displayed in the legend items, as well as the following two special words:
-
#NAME - denotes the group column name
-
#VALUE - denotes the group column value (it is the same for all the records shown in the same series)
Example:
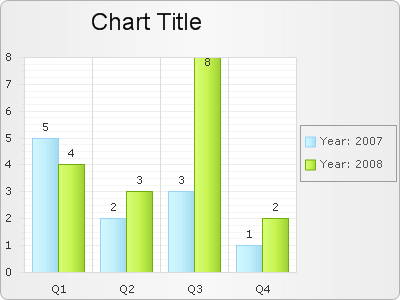
Consider a chart populated from the following table:
| Year | Quarter | Value |
|---|---|---|
| 2007 | Q1 | 5 |
| 2007 | Q2 | 2 |
| 2007 | Q3 | 3 |
| 2007 | Q4 | 1 |
| 2008 | Q1 | 4 |
| 2008 | Q2 | 3 |
| 2008 | Q3 | 8 |
| 2008 | Q4 | 2 |
Configure RadChart like this:
RadChart1.DataGroupColumn = "Year";
RadChart1.PlotArea.XAxis.DataLabelsColumn = "Quarter";
RadChart1.Legend.Appearance.GroupNameFormat = "#NAME:
#VALUE"; This is the result: