Data Binding RadChart to a Generic List of Objects
RadChart has been deprecated since Q3 2014 and is marked as obsolete as of the 2026 Q2 SP1 (v2026.2.708) release. This is the last release that includes the RadChart component — its source code will be removed from the assembly in the next release. We strongly recommend using RadHtmlChart, Telerik's modern client-side charting component. To transition from RadChart to RadHtmlChart, refer to the following migration articles:
Explore the RadHtmlChart documentation and online demos to determine how it fits your development needs.
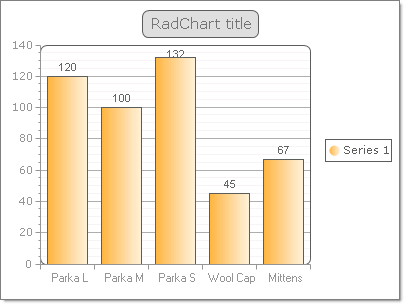
You can bind to a generic lists of objects that have multiple properties. The example below binds to a list of "Product" objects that contain two properties, one property for "Name" and a second for "QuantityInStock". The Y axis binds to the QuantityInStock and the X axis label binds to the "Name" property.
The Product object is defined with a constructor that passes both Name and QuantityInStock:
public class Product
{
   public Product(string name, int quantityInStock)
   {
	   _name = name;
	   _quantityInStock = quantityInStock;
   }
   private string _name;
   public string Name
   {
	   get { return _name; }
	   set { _name = value; }
   }
   private int _quantityInStock;
   public int QuantityInStock
   {
	   get { return _quantityInStock; }
	   set { _quantityInStock = value; }
   }
} After the Product object is defined the following steps configure and bind to the generic List:
-
A generic List of Product objects is created and assigned to the RadChart DataSource= property.
-
The DataYColumn property of the series is assigned the numeric "QuantityInStock" property of the Product object.
-
The XAxis DataLabelsColumn is assigned the "Name" property of the the Product object.
-
The RadChart DataBind()= method is called.
List<Product> products = new List<Product>();
products.Add(new Product("Parka L", 120));
products.Add(new Product("Parka M", 100));
products.Add(new Product("Parka S", 132));
products.Add(new Product("Wool Cap", 45));
products.Add(new Product("Mittens", 67));
RadChart1.DataSource = products;
RadChart1.Series[0].DataYColumn = "QuantityInStock";
RadChart1.PlotArea.XAxis.DataLabelsColumn = "Name";
RadChart1.PlotArea.XAxis.Appearance.TextAppearance.TextProperties.Font = new System.Drawing.Font("Arial", 8);
RadChart1.DataBind();