Performance Timing in Chrome DevTools: console.time vs performance.mark

Summarize with AI:
In this post we demonstrate how to utilize console.time and performance.mark to monitor times and processes in Chrome DevTools, and also take into account how the two features compare.
When working with the console, it is very useful to monitor and take metrics for our processes. There are a few ways to take these metrics. However in this post, we’ll be looking at how console.time and performance.mark compare.
Console.time
Console.time is used to start a timer in order to track the duration of a particular operation. When scheduling the timer, we give the timer a unique name for identification since we can have several timers running concurrently on the same page. We can end the timing operation by calling console.timeEnd() and passing in the unique name of the timer. This will stop the timer and display the time, in milliseconds, that elapsed since the timer was started.
Syntax
The syntax is fairly understandable and easy to work with. You start with the console.time() method to specify that you’re trying to start a timer for a particular operation. It takes a single parameter label, which specifies the operation that is to be timed.
console.time(label);
Parameter
Console.log takes a single label parameter that simply serves as the name to describe the operation that is to be timed. We also pass the label when calling console.timeEnd() to specify which timer we are ending and then print the timer value to the console.
console.time("firstTest")
Usage
Let’s say, for instance, that we want to measure the duration of a particular iteration process in our application. We will define a timer that starts the moment that function is called and run till the end of the iteration process. This scenario we have created can be exemplified like this:
console.time("iterationTime");
for (i = 0; i < 10; i++) {
    // some code
}
console.timeEnd("iterationTime");
Here, we started the iterationTime timer just before the iteration process. Next, we defined the iteration and ended the timer. Now, let’s see how it works in the console:

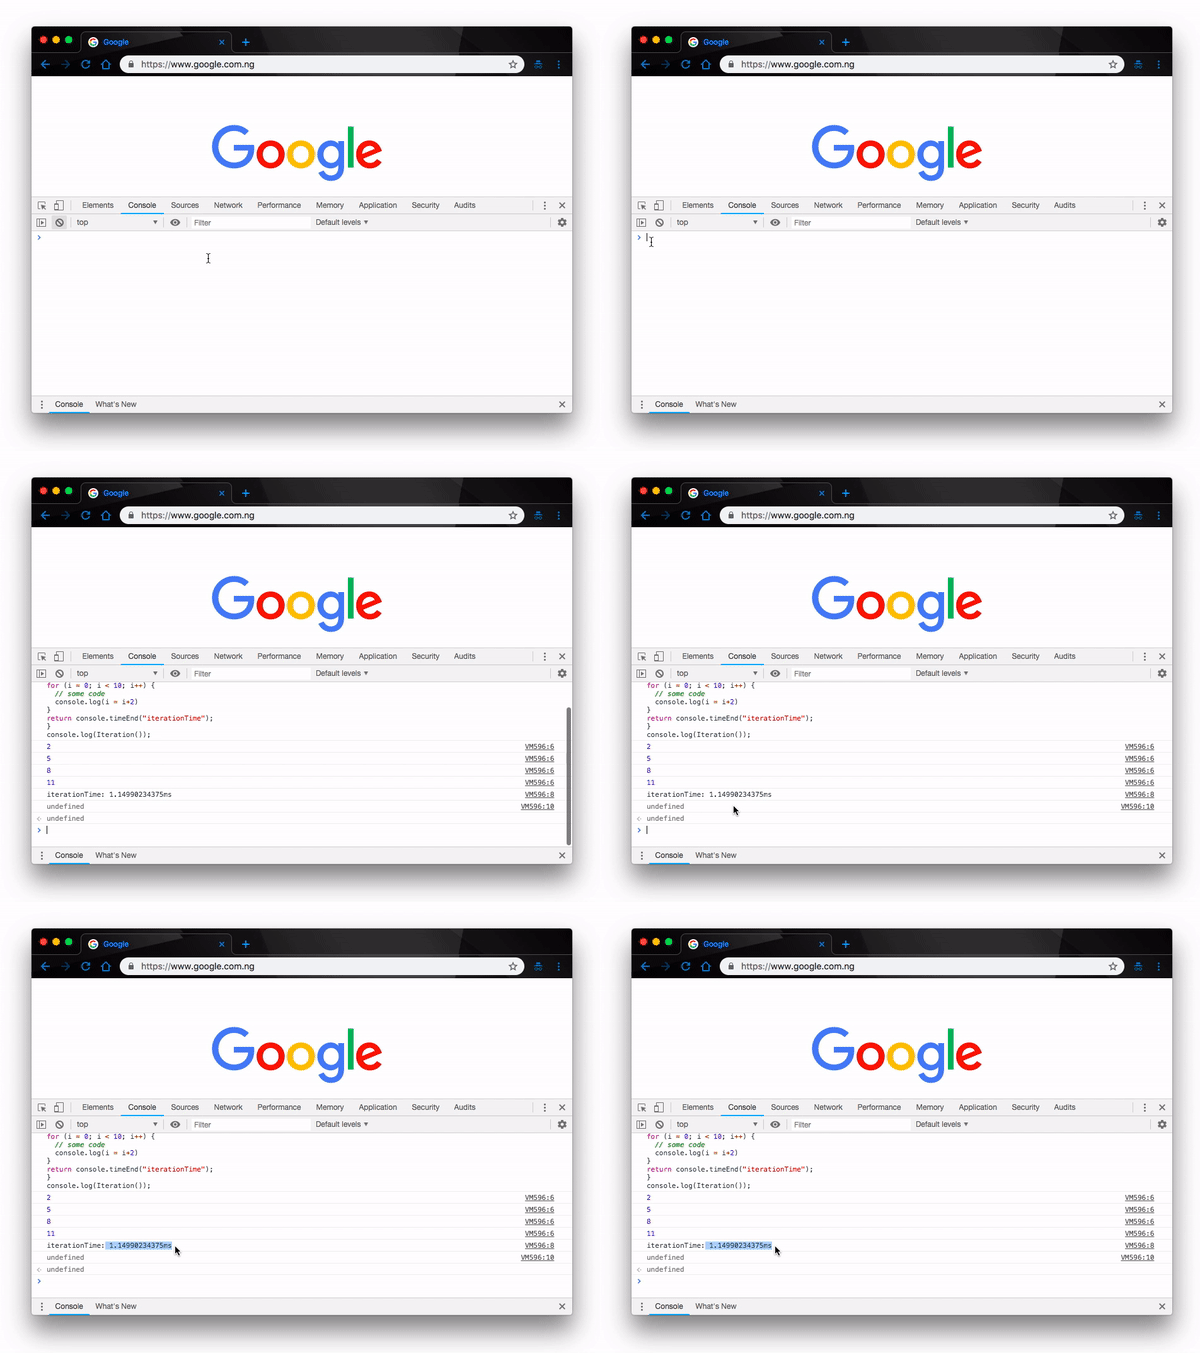
Here the time it took to execute the iteration process is 0.01416015625ms. To be certain that our timer works efficiently and that we are getting the right values, let’s add some code to the iteration process and see if the process takes longer to execute or not. We’ll update our iteration like so:
    function Iteration(){
        console.time("iterationTime");
        for (i = 0; i < 10; i++) {
          // some code
          console.log(i = i+2)
        }
        return console.timeEnd("iterationTime");
    }
    console.log(Iteration());
By design, this should take significantly more time than the previous process. Because we are performing more tasks here, it should take more time to finish. Let’s find out if the timer supports our claim in the console:

Just as we expected, the process finished at 1.14990234375ms as compared to the previous iteration time of 0.01416015625ms.
Finally, let’s see how the timer performs in an addition process. Say, for example, we wanted to pass two numbers to a function and return their sum, the timer should tell us exactly how long the process will take.
    console.time("additionTime")
    function Add(a,b){
      return a + b
    }
    console.log(Add(2,3));
    console.timeEnd("additionTime")
Now when we try this in the console, we should get the additionTime printed with the correct values:

That’s one of many ways we can use the console.time to monitor specific moments in our codebase to determine the performance and time requirements of certain pieces of code.
Performance.mark
Performance.mark, just like console.time, is used to create a timestamp for a particular process in the Performance Timeline. It does this by creating a timestamp for every significant moment from the time the process starts to the time it ends.
Syntax
The syntax is not very different from that of console.time. You start with the performance.mark() method to specify that you’re trying to start a new mark for the operation. It takes a single parameter name, which is a DOMString representing the name of the mark.
performance.mark(name);
Arguments
Performance.mark takes a single argument name, which simply serves as a description of the new mark. The same argument is passed to the mark to end the mark:
performance.mark("firstTest");
Usage
Let’s replicate the usage examples we applied in the console.time method to properly ascertain how they both function. Now, let’s use performance.mark() to measure the duration of our earlier iteration process like this:
    function Iteration( ){
      for (i = 0; i < 10; i++) {
        // some code
        console.log(i = i+2)
      }
    }
    performance.mark('Iteration Start')
    Iteration()
    performance.mark('Iteration End')
    performance.measure(
        'Iteration',
        'Iteration Start',
        'Iteration End'
    )
    var measures = performance.getEntriesByName("Iteration");
    var measure = measures[0];
    console.log("interationTime", measure.duration +"ms")
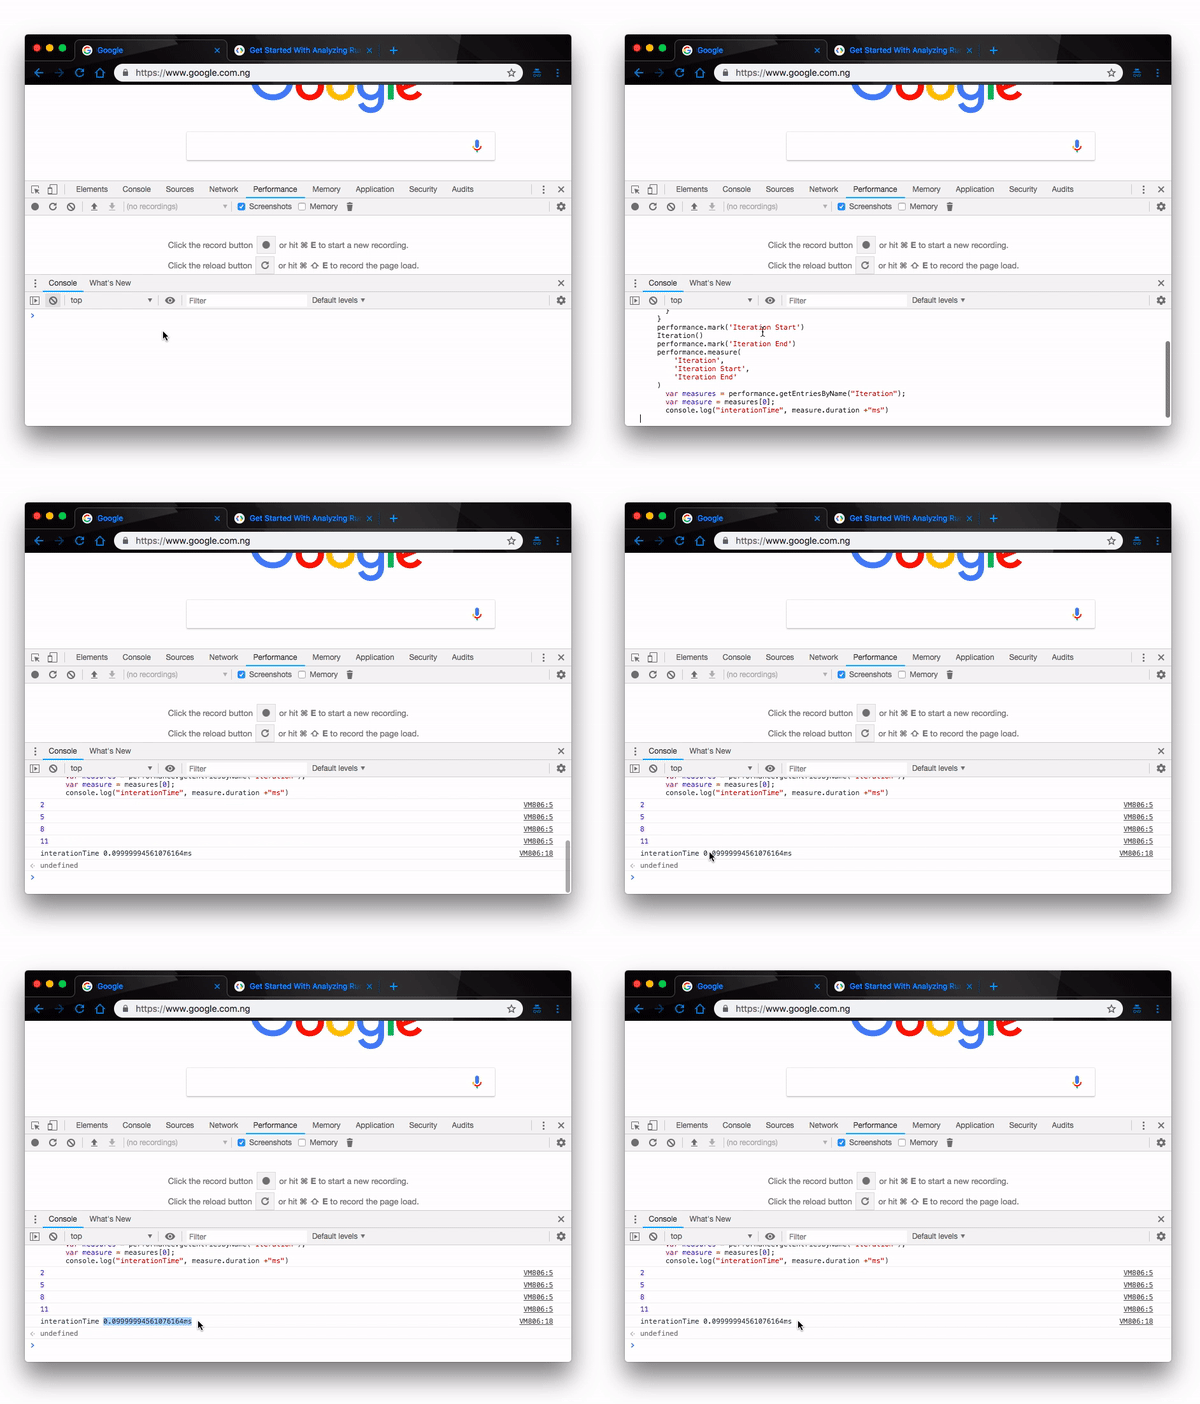
Now when we try this in the console, we should get the iterationTime printed to the console like so:

Also if we wanted to add two numbers and return a value as we did with the console.time method, we can simply update our last example like this:
    function Add(a,b){
     return a+b
    }
    console.log(Add(2,3))
    performance.mark('Add Start')
    Add(2,3)
    performance.mark('Add End')
    performance.measure(
        'Add',
        'Add Start',
        'Add End'
    )
      var measures = performance.getEntriesByName("Add");
      var measure = measures[0];
      console.log("additionTime", measure.duration +"ms")
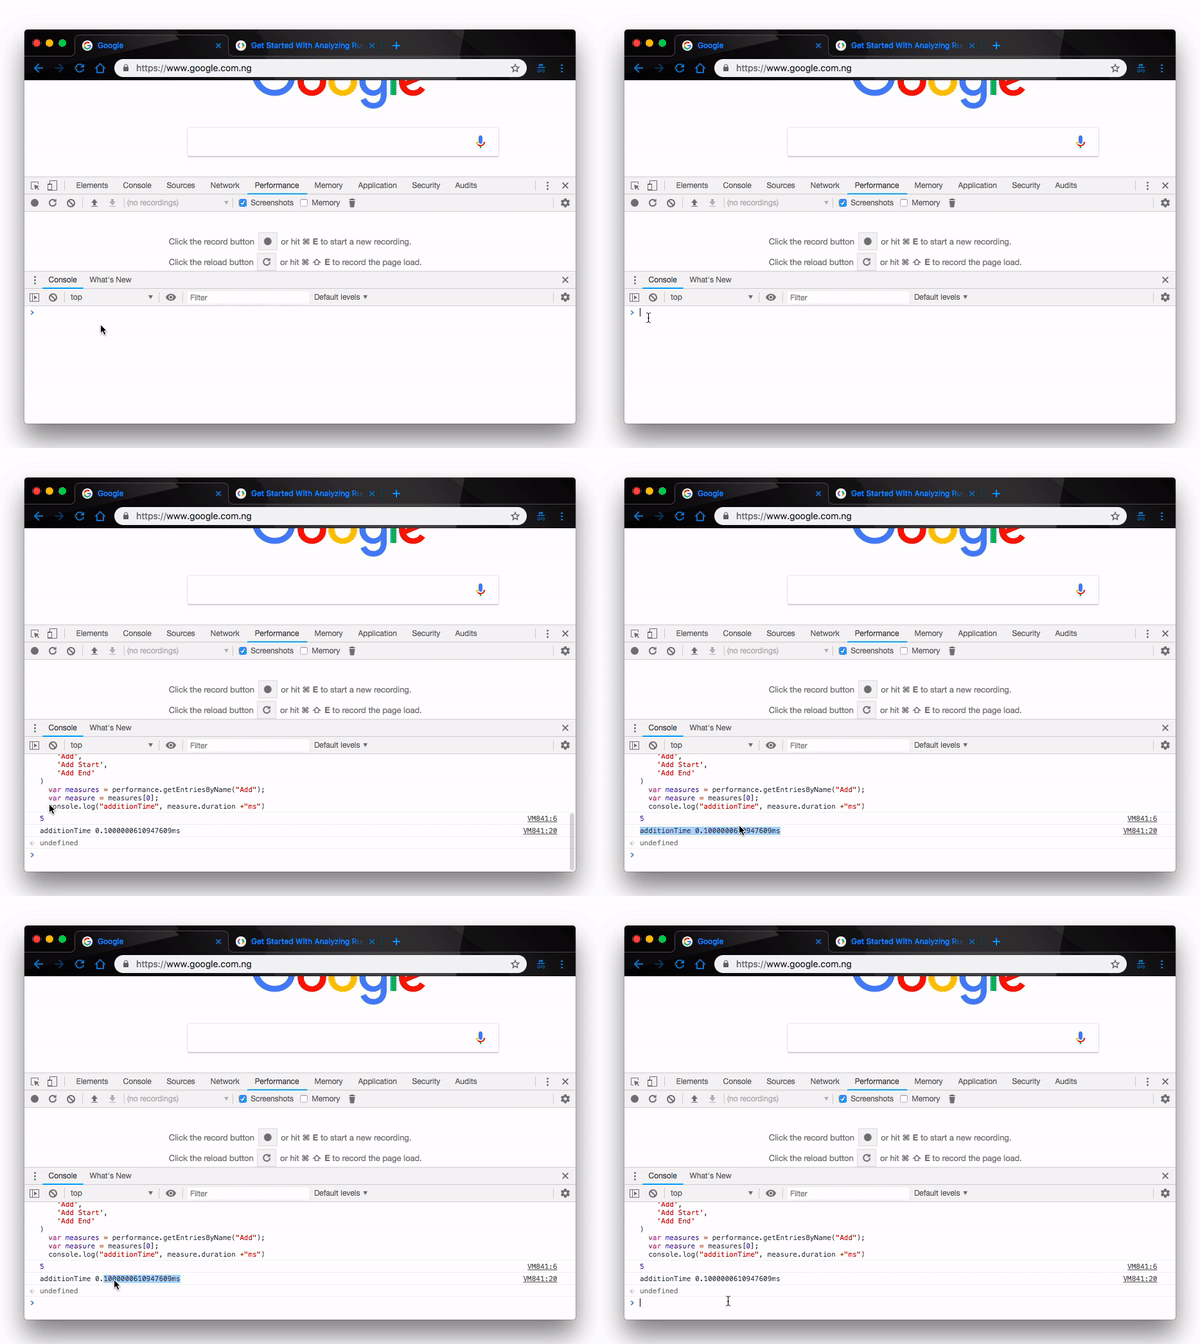
Running it in the console will now give us a different duration since it’ll take relative longer time to add and return the value:

Conclusion
In this post we have gone through the syntax and description of both console.time and performance.mark to give you a better understanding of what they are and how to use them. We have equally demonstrated a few use cases to give you a practical approach to better your understanding of the use cases. There is a lot more to know about them than what is covered in this article so feel free to learn more on your own and do not hesitate to reach out to us whenever you need more help.
For More Info on Building Great Web Apps:
Want to learn more about creating great user interfaces? Check out Kendo UI - our complete UI component library, which allows you to quickly build high-quality, responsive apps. It includes all the components you’ll need, from grids and charts to schedulers and dials.
Christian Nwamba
Chris Nwamba is a Senior Developer Advocate at AWS focusing on AWS Amplify. He is also a teacher with years of experience building products and communities.
