Introducing Diagram Ribbon and Smart Routing for WPF Diagram

Summarize with AI:
In this post we take a deeper look at a new update in the Telerik UI for WPF Diagram Framework, the Diagram Ribbon and its new and improved ability to avoid overlapping connections.
With the latest release of Telerik UI for WPF, we introduced .NET Core 3.0 support, two new controls (NavigationView & HyperlinkButton), as well as a variety of new features and improvements to the toolkitk including the Diagram Ribbon.
In the next few paragraphs, we will go over the newest features and functionalities of the WPF Diagram framework by focusing on the Diagram Ribbon and Smart Routing.
DiagramRibbon Component
Ever wonder how cool it would be to have a ribbon control which exposes the different functionalities of the Diagram Framework, like: save/load, printing, setting the selection mode, adding bridges to the connections etc. Search no more!
In the latest version of Telerik UI for WPF we introduced the RadDiagramRibbon. This control is a predefined, fully customizable and ready-to-use RibbonView, providing UI for the most common features and settings of RadDiagram. The control can be easily configured and wired to RadDiagram using a design-time wizard. With a click of a button, now you can have different kind of settings of the RadDiagram Framework combined in one control.
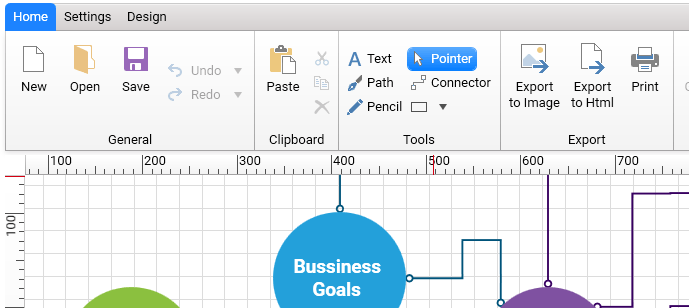
The DiagramRibbon contains three tabs which hold the most used features of the Diagram.
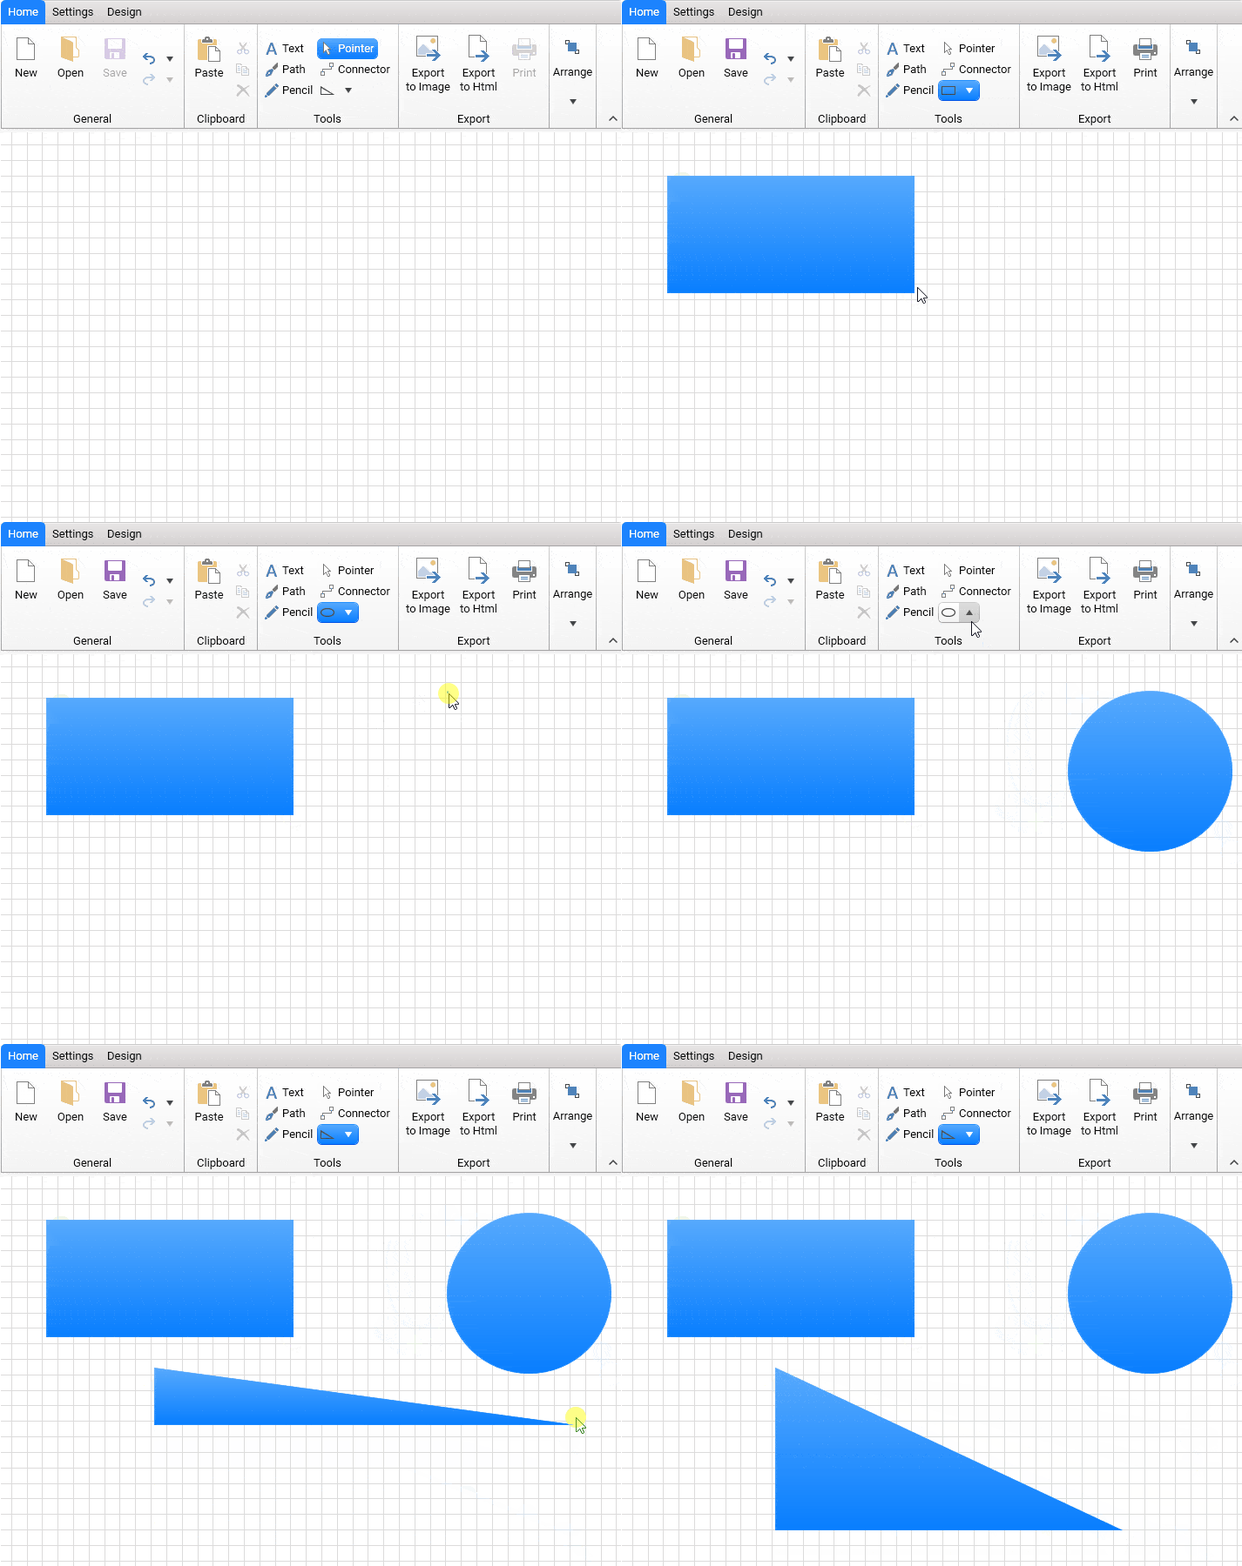
- Home: The first tab holds functionalities like save/load, undo/redo, exporting to an image etc. I need to point out the special design Shape tool (similar to the shape tool inside Microsoft Visio) which was added to the Tools section. The new tool provides three types of shapes: Rectangle, Circle and Triangle. So, using your mouse you can add one of these shapes to the diagram surface and set their size accordingly.
- Settings: The second tab delivers options to set more specific settings to the diagram and its items. Customizing the background grid, changing the size of the shapes or setting the zoom level are a few of the options which can be set out of the box.

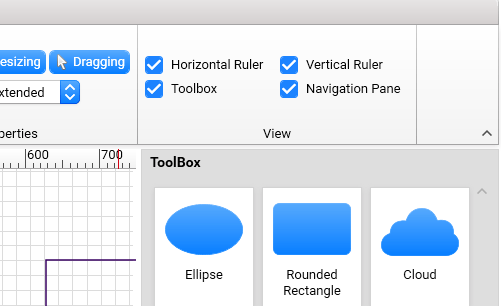
You can plug three other components of the Diagram framework (RadDiagramToolBox, RadNavigationPane, RadDiagramRuler). Using the checkbox in the View section, you can set which extensions to show or hide.
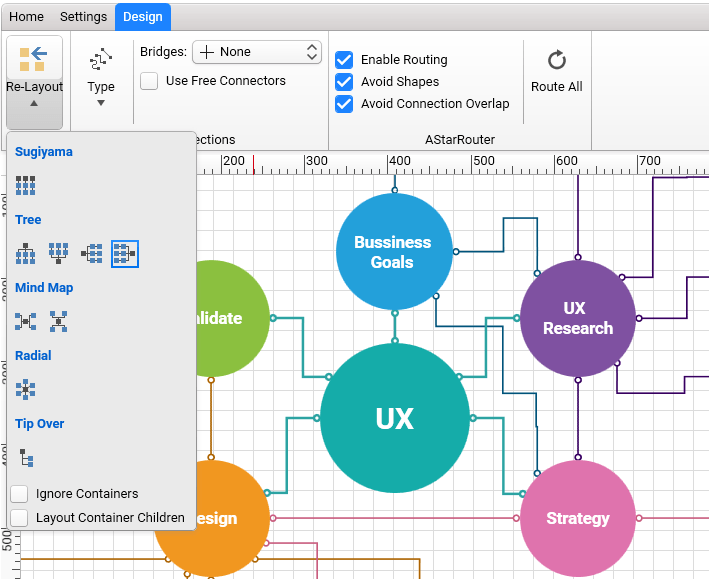
- Design: The last tab's purpose is to give the user control over shapes layout, connection types and AStar connection routing algorithm. The diagram provides several Layouts out of the box which can be set from the Re-Layout dropdown button: Sugiyama Layout, Tree Layout, Mind Map, Radial, Tip Over. Changing the connection type or adding bridges has never been so easy. If a connection overlap appears, you could turn on the routing mechanism by just checking the Enable Routing checkbox.
Cool, isn't it?
- Extensibility: In case these built-in tabs do not include your desired functionality, or you have your own magic which you want to add for quick access, the RadDiagramRibbon can be extended to fit your needs. The AdditionalTabs and AdditionalGroups collection properties can be used to add new RadRibbonTab and RadRibbonGroup.
<telerik:RadDiagram x:Name="diagram" />
<telerik:RadDiagramRibbon Diagram="{Binding ElementName=diagram}" >
    <telerik:RadRibbonTab Header="Custom Tab">
        <telerik:RadRibbonGroup Header="Extend Clipboard">
            <telerik:RadRibbonSplitButton Text="Paste">
                <telerik:RadRibbonSplitButton.DropDownContent>
                    <telerik:RadMenu>
                        <telerik:RadMenuItem Header="Paste" />
                        <telerik:RadMenuItem Header="Paste from" />
                    </telerik:RadMenu>
                </telerik:RadRibbonSplitButton.DropDownContent>
            </telerik:RadRibbonSplitButton>
        </telerik:RadRibbonGroup>
    </telerik:RadRibbonTab>
</telerik:RadDiagramRibbon>
Using the above code snippet, you will get the following visualization.
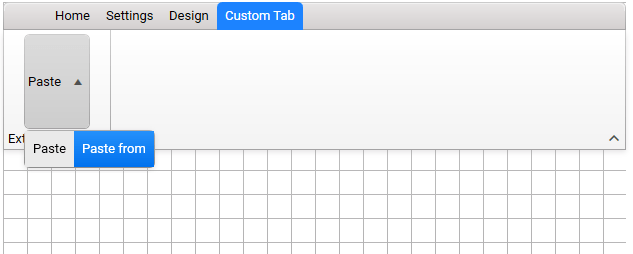
For more information, please refer to the Overview help article of Diagram Ribbon.
Wait, there is more!
Avoid Connections Overlap in RadDiagram
In a complex scenario where a large number of shapes and connections are used, it is hard to understand the relation between the shapes when connections overlap. Our team struggled to reduce these overlaps, but yes, we did it. Improvements were made to the AStarRouter algorithm implementation to cut down on such cases. The new AvoidConnectionOverlap property will enable the AStar algorithm to add a penalty for connection segments overlapping, thus trying to minimize the total number of such 'hard-to-follow' connections.
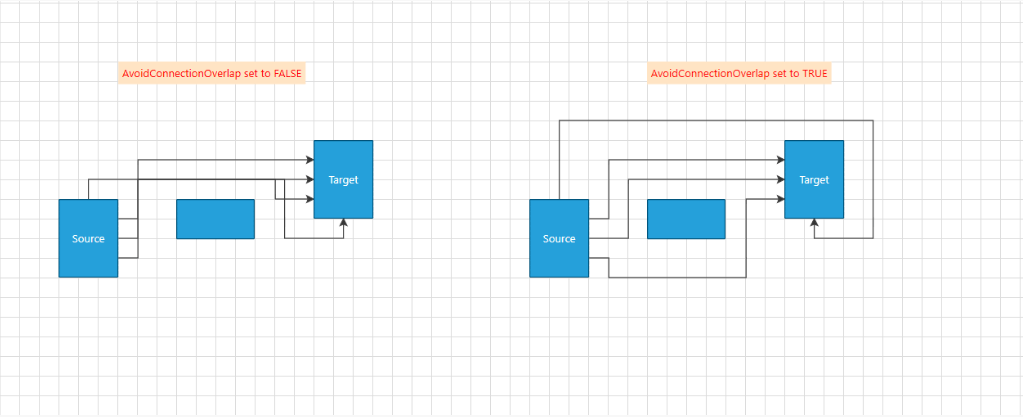
For better configuration of the algorithm we added three more properties to the AStarRouter: ShapeCrossPenalty, SegmentOverlapPenalty, and SegmentOverlapDistance:
- SegmentOverlapPenalty is a property of type double that indicates a penalty assigned to the cost of a given path when it overlaps an existing diagram connection. By default, it is 0.75. By increasing the value of this property, connections might start to cross a given shape (avoiding a connection will become a higher priority than avoiding a shape) to reduce connection segments overlap.
- ShapeCrossPenalty is a property of type double that indicates a penalty assigned to the cost of a given path when connections cross a shape. Its default value is 1. Which means that the shortest path between two shapes is multiplied by 1. The AStarRouter will try to draw the connection in a way so that no shape is crossed. Increasing this property to 2 for example, will allow this path to be twice as long, thus reducing the chance of crossing a shape. By setting a higher value, connections may start to overlap each other as avoiding crossing shapes will have a higher priority.
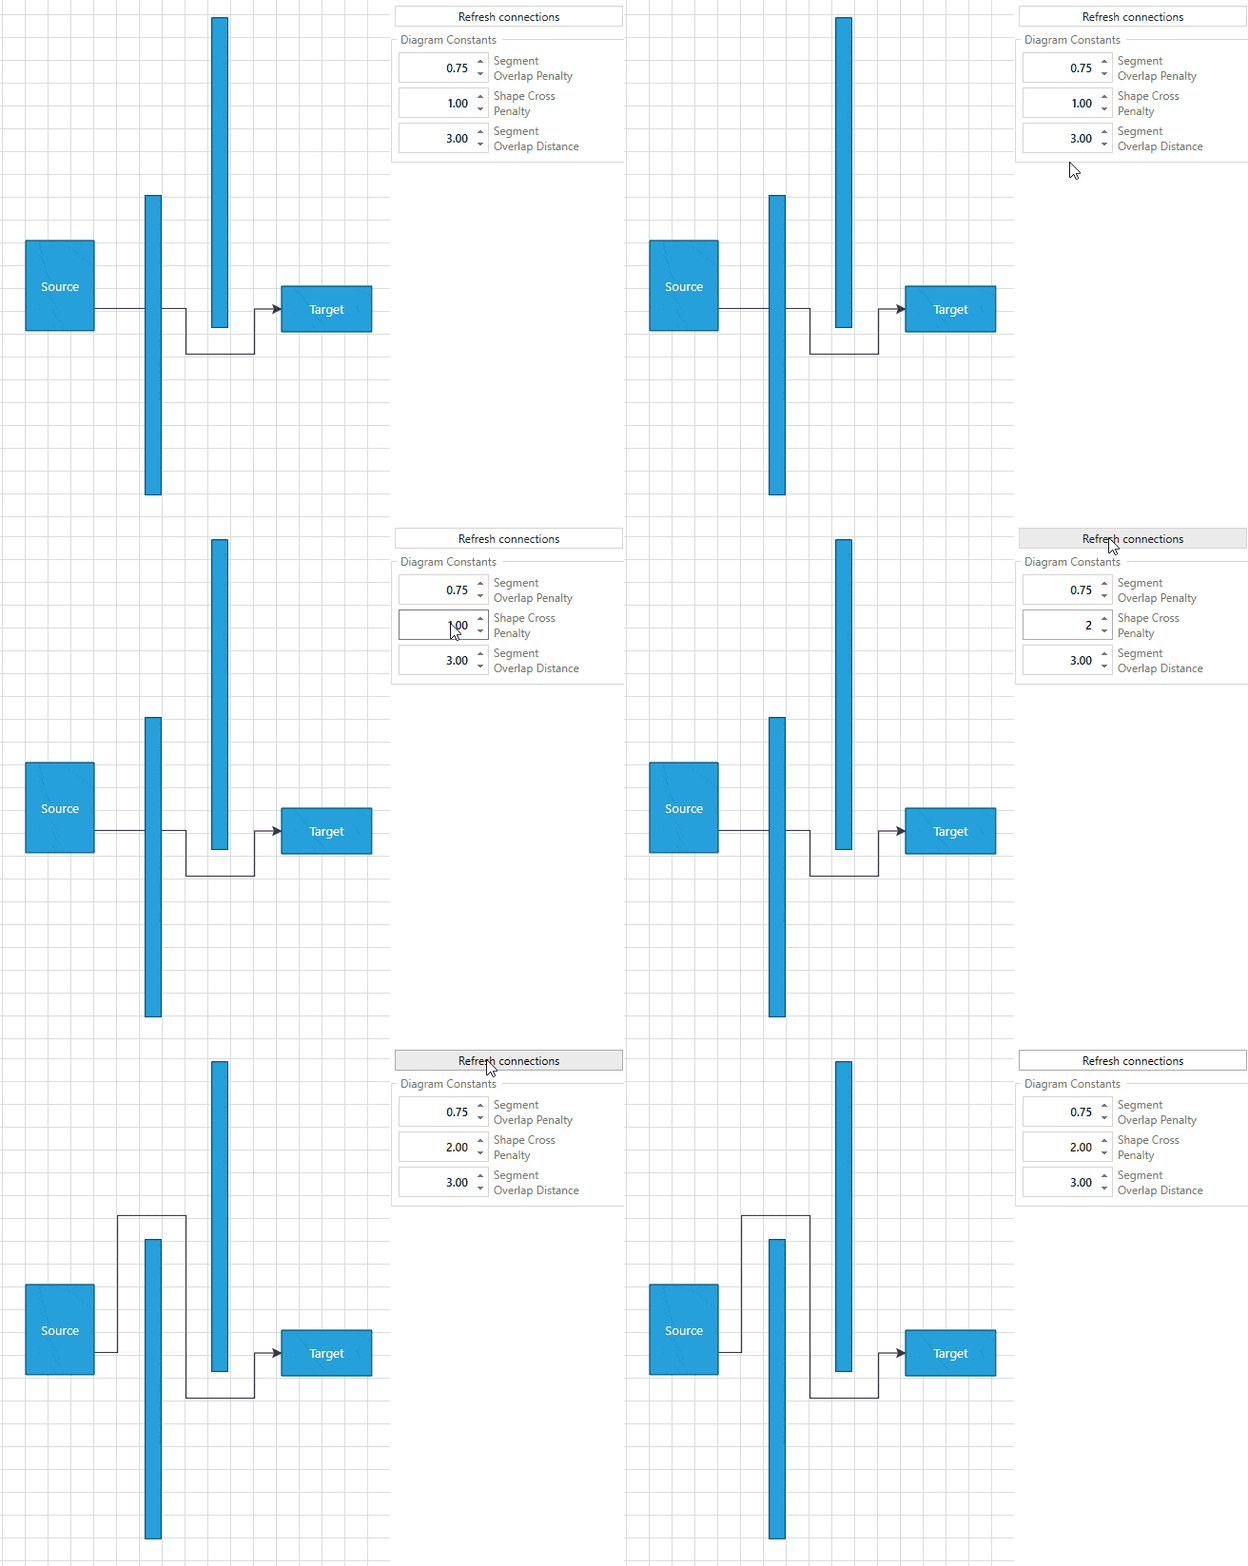
- SegmentOverlapDistance is a property of type double which sets the distance around a segment in which overlap is detected. The default value is 3px. The algorithm creates a bounding box for every connection segment and considers an overlap if there are intersecting boxes from different connections.
More information about the routing mechanism of the RadDiagram can be found in the Routing help article in our documentation.
Share Your Feedback
Feel free to drop us a comment below sharing your thoughts about the new goodies in the Diagram Framework. Or visit our Feedback portal for Telerik UI for WPF and let us know if you have any suggestions or if you need any particular features/controls which you expect our RadDiagram to have.
And if you haven’t already had a chance to try our UI toolkits, simply download a trial version from the button below:
Telerik UI for WPF
In case you missed it, here are some of the updates from our last release.

Dinko Krastev
Dinko Krastev is a Technical Support Engineer and part of the Progress Telerik UI for WPF team in Sofia, Bulgaria. He is very passionate about his work. In his free time, he likes to travel with his family by visiting new places around the world.
