How to Add Real-Time Observability to a NestJS App with OpenTelemetry

Summarize with AI:
Learn to add real-time observability to a NestJS application using OpenTelemetry and then visualize what's happening in your app with real data. Identify bottlenecks, fix them and scale your application effectively.
In this post, we’ll add real-time observability to a NestJS application using OpenTelemetry. You’ll learn how to visualize what’s happening in your app with real data. This approach will help you to identify bottlenecks, fix them and scale your application effectively.
We’ll build a simple NestJS app that generates telemetry data and sends it to Jaeger, allowing us to visually monitor and gain valuable insights in the way our application behaves.
Prerequisites
To follow along with this post, you’ll need to have basic knowledge of HTTP and RESTful APIs, familiarity with Docker and a basic understanding of NestJS and TypeScript.
What Is Observability?
Observability is the ability to understand a system from the outside based on the data it generates. It lets us look into the inner workings of our system and understand what is happening and why it is happening.
For example, if you notice that your api/orders endpoint is slow, observability shows us the chain of services called by that endpoint. It can tell that the performance issue is caused by the database query taking 1.5 seconds to execute, allowing us to quickly identify and address the bottleneck.
The data generated is called “telemetry,” and it comes in the form of traces, metrics and logs:
- Traces: Document the entire flow of a request through the chain of services
- Metrics: Give insights into system performance and resource usage
- Logs: Provide context-rich information that complements traces and metrics
NestJS uses a modular architecture, which is great for scalability and organization, but it also means:
- A single request can interact with multiple layers.
- If X depends on Y, errors or slowness in Y can lead to X failing.
- Logs alone aren’t enough to fully understand what’s happening most of the time.
Understanding OpenTelemetry
OpenTelemetry, or OTel, is an open-source observability framework that lets us collect, process and export telemetry data. It gives us a common standard for collecting telemetry data and processing it, along with tools, APIs and SDKs for instrumenting, generating and exporting telemetry data.
OTel serves as the bridge between our running code and external observability tools like Jaeger, which is used to visualize telemetry data. Apart from Jaeger, OTel integrates well with other popular tools like Grafana, Prometheus and Zipkin.
Project Setup
Start by creating a NestJS project:
nest new Otel-project
cd Otel-project
Next, create a docker-compose.yml file and add the following configuration to it:
services:
  jaeger:
    image: jaegertracing/all-in-one:latest
    ports:
      - "16686:16686"
      - "4317:4317"
In the configuration above, we set up our Jaeger backend to receive, store and view our traces. We expose two ports: “16686” to access the Jaeger UI, and “4317” which OpenTelemetry uses to send traces to Jaeger. After adding the code to the docker-compose.yaml file, run the command below:
docker compose up
Now, run the following command in your terminal to install the dependencies for our NestJS project:
npm install @nestjs/common @nestjs/core @nestjs/platform-express rxjs \
@opentelemetry/api @opentelemetry/sdk-node @opentelemetry/auto-instrumentations-node \
@opentelemetry/exporter-trace-otlp-grpc @opentelemetry/sdk-metrics
Next, create a tracing.ts file in your src folder and add the following to it:
import { NodeSDK } from "@opentelemetry/sdk-node";
import { getNodeAutoInstrumentations } from "@opentelemetry/auto-instrumentations-node";
import { OTLPTraceExporter } from "@opentelemetry/exporter-trace-otlp-grpc";
import {
  PeriodicExportingMetricReader,
  ConsoleMetricExporter,
} from "@opentelemetry/sdk-metrics";

const traceExporter = new OTLPTraceExporter({
  url: "http://localhost:4317",
});

const metricReader = new PeriodicExportingMetricReader({
  exporter: new ConsoleMetricExporter(),
  exportIntervalMillis: 15000,
});

const sdk = new NodeSDK({
  serviceName: "nestjs-opentelemetry-demo",
  traceExporter,
  metricReader,
  instrumentations: [getNodeAutoInstrumentations()],
});

(async () => {
  await sdk.start();
  console.log("✅ OpenTelemetry tracing & metrics initialized");
})();

process.on("SIGTERM", async () => {
  await sdk.shutdown();
  console.log("🛑 OpenTelemetry shutdown complete");
  process.exit(0);
});
In the code above, traceExporter is an instance of OTLPTraceExporter. It tells OpenTelemetry where to send our trace data using the OpenTelemetry Protocol over Google Remote Procedure Call. The metricReader is an instance of PeriodicExportingMetricReader, which gathers and exports metrics every 15 seconds.
Next, we configure the OpenTelemetry Node SDK. We set the serviceName we’ll use in Jaeger to identify our app. We pass the traceExporter and metricReader, and the instrumentation property, which expects a list of instrumentation instances that define how OpenTelemetry automatically tracks our app’s operations.
Instead of passing them manually, getNodeAutoInstrumentations() detects commonly used libraries like Express, HTTP and some database drivers you might have installed and configures them with default options to enable automatic tracing.
Finally, we listen to the SIGTERM signal that’s sent by Node when our server shuts down. When this happens, we call sdk.shutdown(), which clears any pending telemetry data, closes open connections and frees up resources.
Update the code in your main.ts file with the following:
import "./tracing";
import { NestFactory } from "@nestjs/core";
import { AppModule } from "./app.module";

async function bootstrap() {
  const app = await NestFactory.create(AppModule);
  await app.listen(3000);
  console.log("🚀 App running on http://localhost:3000");
}

bootstrap();
The import './tracing'; declaration must be at the top to so that OpenTelemetry tracing is initialized before any other application code runs. We’re essentially telling Node.js to load and run everything in that file, thereby setting up tracing and metrics. Since this happens before creating the NestJS app and starting the server, all incoming requests are tracked and reported.
OpenTelemetry doesn’t need to know the port ahead of time. When we import the file, it automatically patches low-level Node.js and Express libraries before NestJS starts. That’s why it hooks into the request lifecycle regardless of the port the app eventually binds to.
Adding Tracing
Right out of the box, OpenTelemetry gives us auto-tracing, which can automatically trace every HTTP request. This way, we don’t need to write any tracing code.
Create a file called orders.controller.ts and add the following to it:
import { Controller, Get } from "@nestjs/common";

@Controller("orders")
export class OrderController {
  @Get()
  getOrders() {
    return [
      { id: 1, item: "Product A", qty: 2 },
      { id: 2, item: "Product B", qty: 1 },
    ];
  }
}
Now, even though we don’t have any tracing code, when we hit this endpoint, OpenTelemetry will detect it.
That said, the OpenTelemetry Node SDK auto-tracing is limited. It gives us limited information, like how long an endpoint takes to respond, but in some cases we might want more information, and that’s where manual spans come in.
A span is a single unit of work in our app, and traces are made up of spans. Spans have a start and end time, a name, attributes and can have a parent, thereby allowing nesting.
Manual spans allow us to track and label specific parts of our app, such as database operations, server computations and external API calls.
Create a file called product.controller.ts and add the following to it:
import { Controller, Get } from "@nestjs/common";
import { trace, context } from "@opentelemetry/api";

@Controller("products")
export class ProductController {
  @Get()
  async getProducts() {
    const tracer = trace.getTracer("nestjs-opentelemetry-demo");
    const span = tracer.startSpan(
      "fetch_products",
      undefined,
      context.active()
    );

    // Simulate a delay to mimic a real database or API call
    await new Promise((resolve) =>
      setTimeout(resolve, 100 + Math.random() * 400)
    );

    span.end();

    return [
      { id: 1, name: "Product A" },
      { id: 2, name: "Product B" },
    ];
  }
}
In the code above, we first get a tracer instance from OpenTelemetry and then use that to start a new span. We name it fetch_products, and we don’t set any attributes, but use context.active() to set its parent so that it becomes part of the trace that OpenTelemetry started for the request.
Now, let’s update the app.module.ts file to use our ProductController:
import { Module } from "@nestjs/common";
import { AppController } from "./app.controller";
import { AppService } from "./app.service";
import { ProductController } from "./product.controller";
import { OrderController } from "./orders.controler";

@Module({
  imports: [],
  controllers: [AppController, ProductController, OrderController],
  providers: [AppService],
})
export class AppModule {}
Adding Metrics
As mentioned earlier, metrics give us insights into system performance and resource usage. They track values over time, and here we’ll use them to track how many HTTP requests our app handles across all routes. To do this, we’ll use a simple interceptor that runs for every request and counts it using OpenTelemetry.
Create an observability.interceptor.ts file, and add the following to it:
import {
  CallHandler,
  ExecutionContext,
  Injectable,
  NestInterceptor,
  Logger,
} from "@nestjs/common";
import { Observable, tap } from "rxjs";
import { metrics } from "@opentelemetry/api";

const meter = metrics.getMeter("nestjs-meter");
const requestCount = meter.createCounter("http_requests_total", {
  description: "Count of all HTTP requests",
});

@Injectable()
export class ObservabilityInterceptor implements NestInterceptor {
  private readonly logger = new Logger("HTTP");

  intercept(context: ExecutionContext, next: CallHandler): Observable<any> {
    const req = context.switchToHttp().getRequest();
    const method = req.method;
    const route = req.url;
    const now = Date.now();

    return next.handle().pipe(
      tap(() => {
        const duration = Date.now() - now;
        this.logger.log(`${method} ${route} - ${duration}ms`);

        requestCount.add(1, {
          method,
          route,
        });
      })
    );
  }
}
First, we retrieved the active meter we defined in our tracing.ts file from the OpenTelemetry SDK using metrics.getMeter('nestjs-meter'). The string nestjs-meter serves as a unique name to label this particular meter instance.
Next, we define a counter metric http_request_total that will be incremented for every request that comes in. requestCount.add(1, { method, route }) increments the counter by 1 and attaches two labels (method and route).
With this setup, we can visualize the number of requests each endpoint in our app receives. Since we are using a NestJS interceptor to automatically run this logic on every request, there is no need to add metrics to every controller.
Next, we need to update the main.ts file to use the interceptor globally:
import "./tracing";
import { NestFactory } from "@nestjs/core";
import { AppModule } from "./app.module";
import { ObservabilityInterceptor } from "./observability.interceptor";

async function bootstrap() {
  const app = await NestFactory.create(AppModule);
  app.useGlobalInterceptors(new ObservabilityInterceptor()); // Register the interceptor globally

  await app.listen(3000);
  console.log("🚀 App running on http://localhost:3000");
}

bootstrap();
In the code above, we set up our interceptor to be globally-scoped, which means it will be automatically bound to all routes in our app.
In our
tracing.tsfile, we configured our metrics to useConsoleMetricExporter, so every few seconds, we’ll see them printed to our terminal, but this can be replaced with monitoring systems like Prometheus.
Now, start the server:
npm run start:dev
Viewing Traces in Jaeger
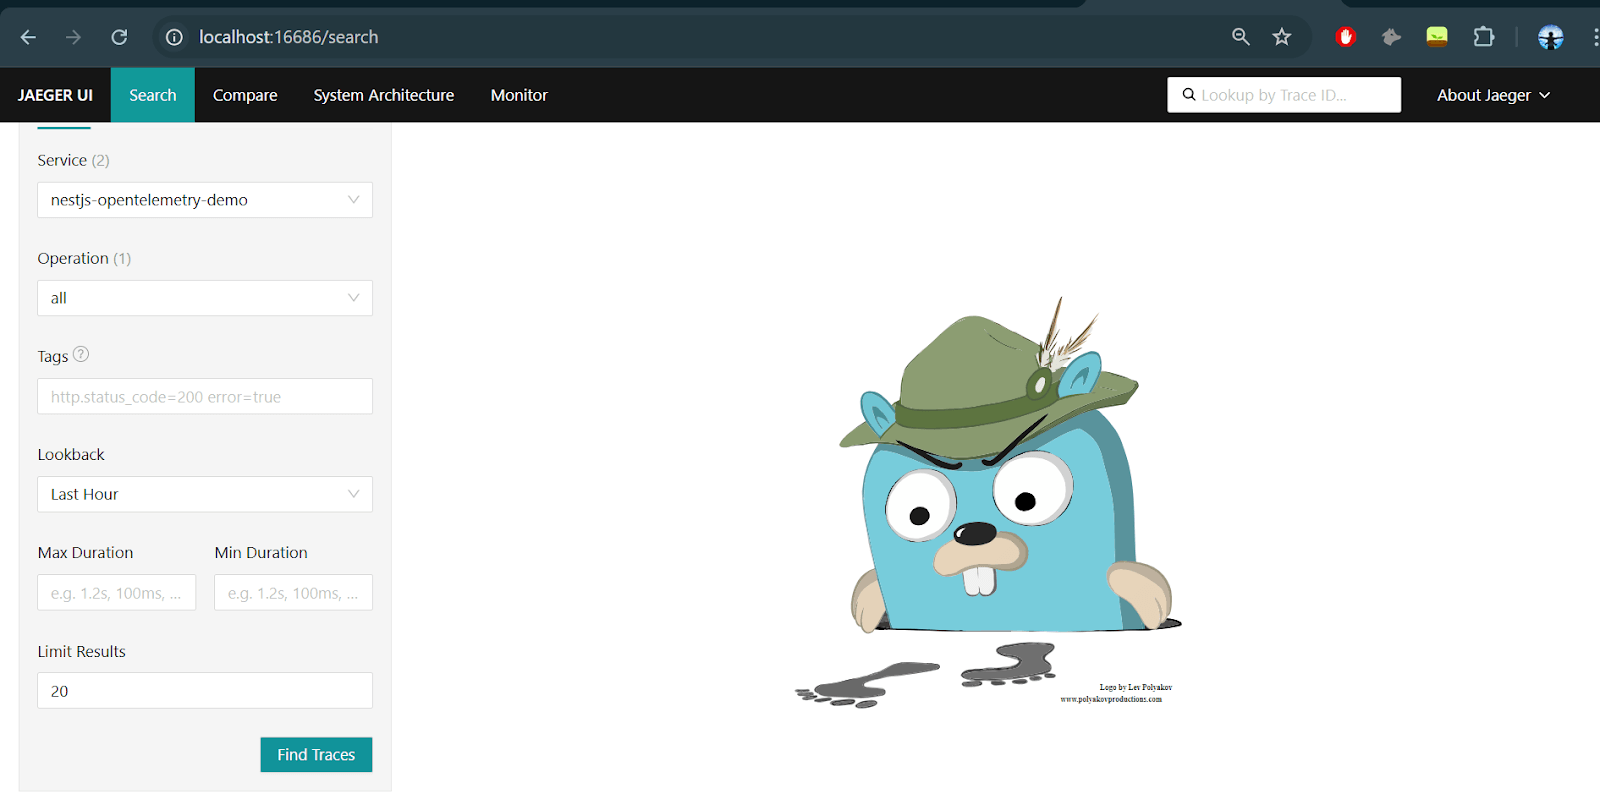
With Jaeger now running, open http://localhost:16686 in your browser and you should see the Jaeger UI.

In the Jaeger dashboard, select nestjs-opentelemetry-demo as the Service and click the Find Traces button. You’ll see a list of recent traces, each representing a single HTTP request. As explained earlier, each trace is made up of one or more spans, and our manual spans will appear nested in the main HTTP span.
First, let’s test OpenTelemetry’s auto-tracing. Use the curl command below to hit the GET /orders endpoint, then go to the Jaeger UI once again:
curl http://localhost:3000/orders

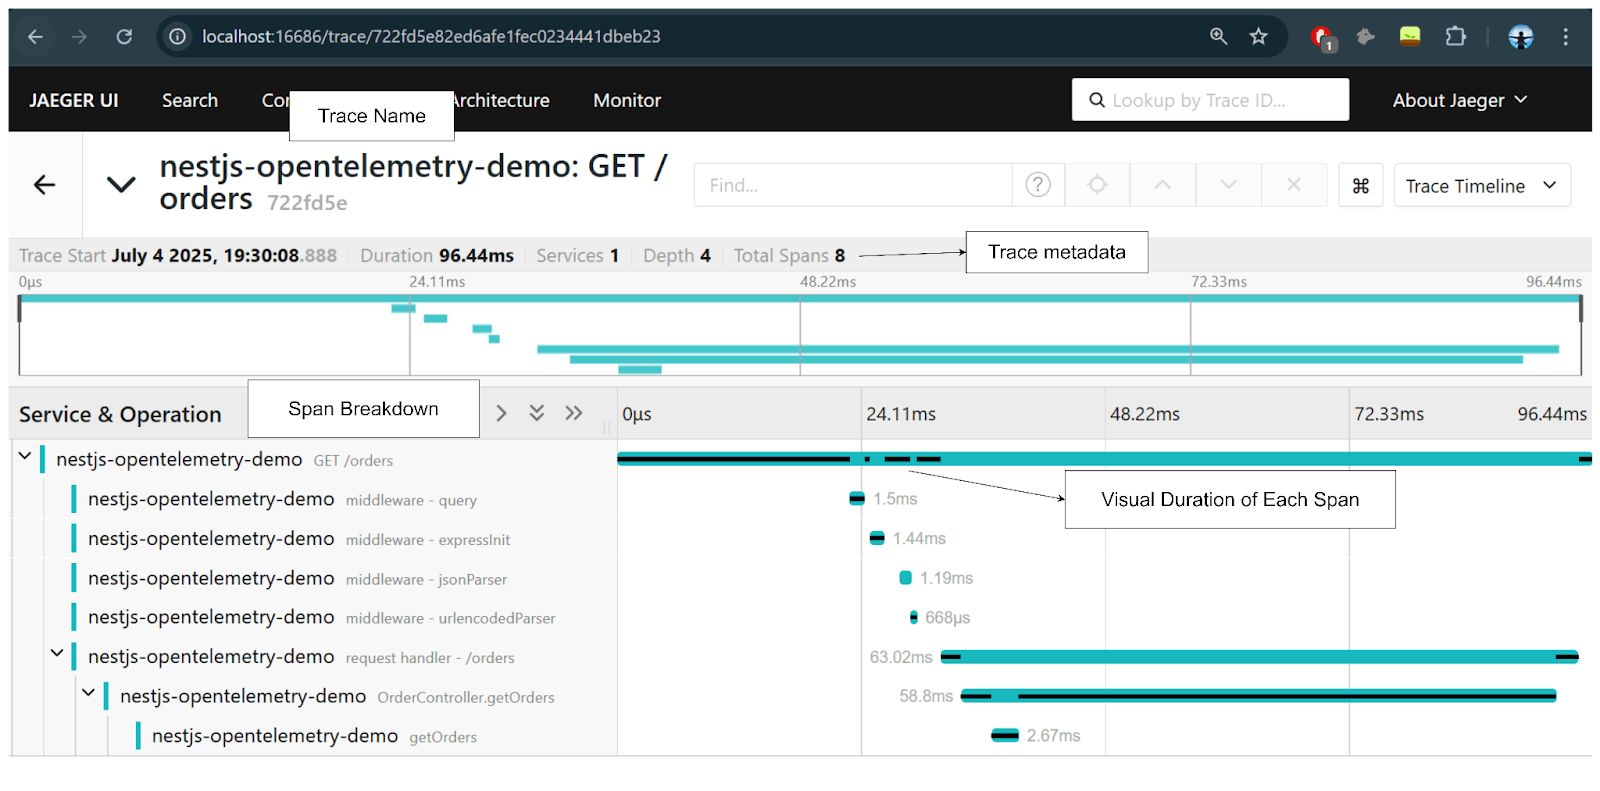
After triggering the /orders endpoint, you’ll see a trace for that GET /orders request. After clicking it, the top section should show key metadata like name, duration and total spans. Spans show the total number of individual operations (8), while depth shows how nested those spans are (4).
You can see different middleware being applied, like expressInit and jsonParser, as well as NestJS’s request handler and controller method. This trace was automatically generated by OpenTelemetry without any tracing code. It’s done by hooking into common libraries using the configurations we set in the tracing.ts file.
Similarly, to test how manual spans work, use the curl command below to hit the GET /products endpoint, then go to the Jaeger UI once again:
curl http://localhost:3000/products

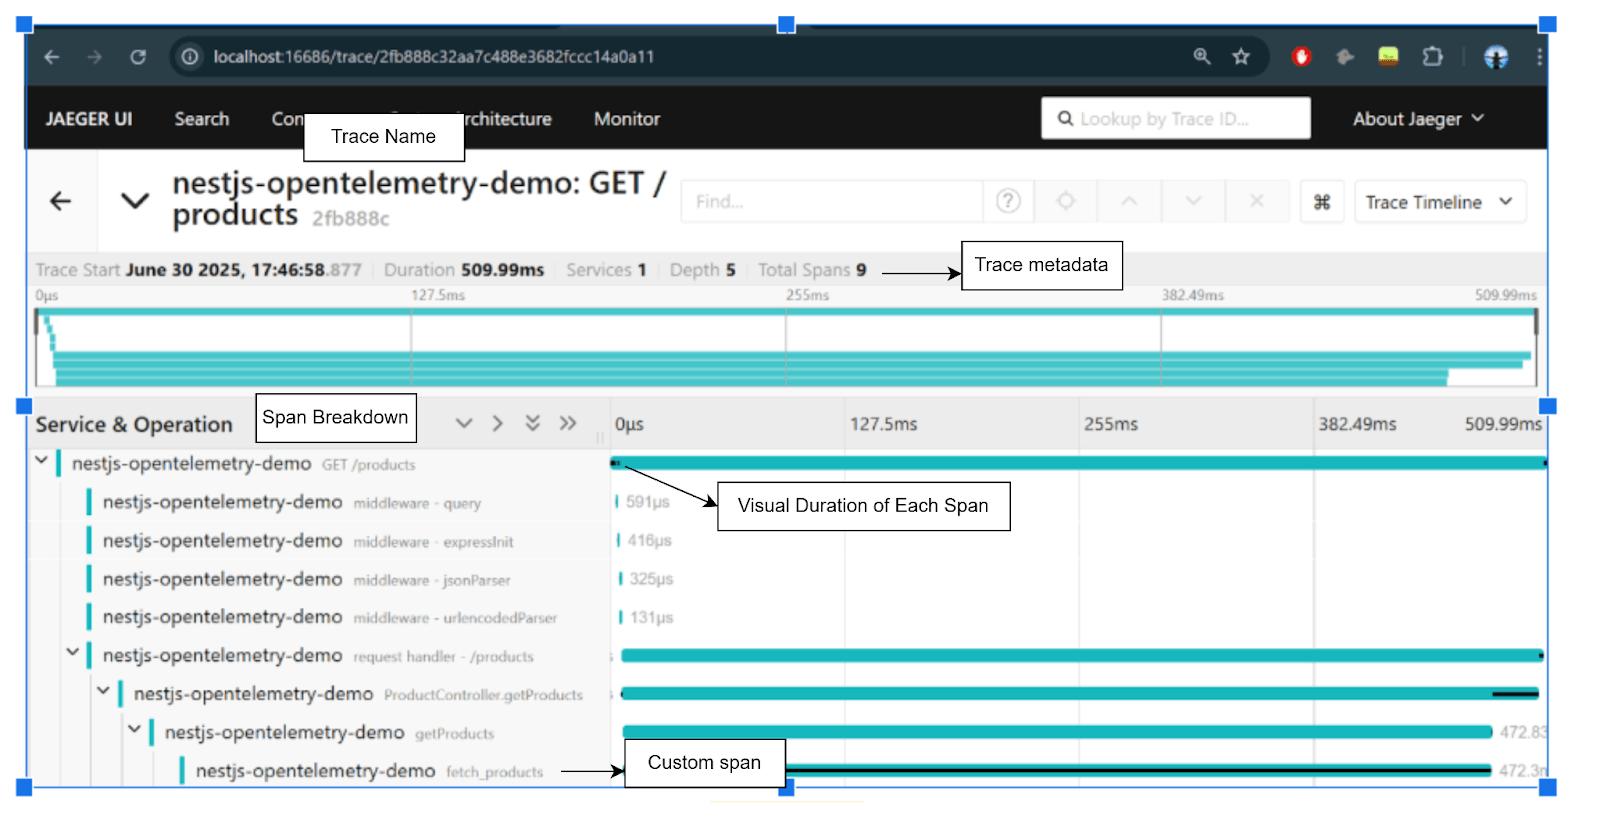
After triggering the /products endpoint, you’ll see a trace for that GET /products request.
Notice we can also see how long each span takes, and we can see our custom span fetch_products that simulates a database call, which spends the most time at ~472ms.
What’s Next?
To improve our app, consider adding a collector that sits between your app and observability tools. It will receive telemetry data, batch it and send it to tools like Jaeger. You could also use Prometheus to capture metrics and monitor your app better, especially in production environments.
Based on your needs, you could integrate a number of cloud APM (Application Performance Monitoring) tools, since most of them support OpenTelemetry.
Conclusion
In this article, we added observability to a NestJS app with OpenTelemetry, which gives us visibility into what happens under the hood with request traces, custom spans and basic metrics. You’ve learned about OpenTelemetry and its core concepts, how to use its Node SDK with NestJS, and how to export telemetry data to platforms like Jaeger and Prometheus.

Christian Nwamba
Chris Nwamba is a Senior Developer Advocate at AWS focusing on AWS Amplify. He is also a teacher with years of experience building products and communities.

