Angular 2 Support Grows with UI for NativeScript 1.2

In the latest UI for NativeScript release, RadChart joins other key NativeScript components that can already be used with the latest build of Angular 2.
We are living in interesting times for developers, where technology improves, changes and evolves on daily basis. One of the most interesting and anticipated frameworks in the web development scene is Angular 2, which NativeScript already supports—allowing you to write truly native mobile applications using Angular 2.
We have been asked on multiple occasions about whether and when the components of the Telerik UI for NativeScript and UI for NativeScript Pro will be usable with Angular 2. We're happy to say that they very much will be—and in fact most of them already are.
RadChart Support for Angular 2
In the most recent release (1.1.0) we introduced support for the very early version of Angular 2 (still in beta) for our RadListView and RadSideDrawer components. Angular 2 is still being improved and currently sits on RC4 version, and UI for NativeScript is on the same track of improvements. In the upcoming 1.2.0 version of UI for NativeScript Pro, you'll be able to use the RadChart component in your NativeScript Angular 2 project. Note that the RadChart Angular 2 directives are still in beta, so if you face any issues please report them to us via the github repo.
Note: Since this blog post was published the 1.3.1 version of UI for NativeScript has been released, which introduced some changes to the custom Angular 2 directives. You can find more details here.
So let’s get started and quickly and easily add an RadCartesianChart to your NativeScript, or {N}, Angular 2 project. If you're somewhat familiar with how to bootstrap an {N} project with Angular, it's pretty simple. All you need to do in order to use the RadCartesianChart and/or RadPieChart is add the built-in CHART_PROVIDERS to the nativeScriptBootstrap, like so:
import { nativeScriptBootstrap } from "nativescript-angular/application";import { CHART_PROVIDERS } from 'nativescript-telerik-ui-pro/chart/angular';import { AppComponent } from "./navigation/app.component";
nativeScriptBootstrap(AppComponent, [CHART_PROVIDERS]);The AppComponent is the first (main) Angular Component of your application. For full details you can take a look at the getting started article for UI for NativeScript here
Creating a LineSeries
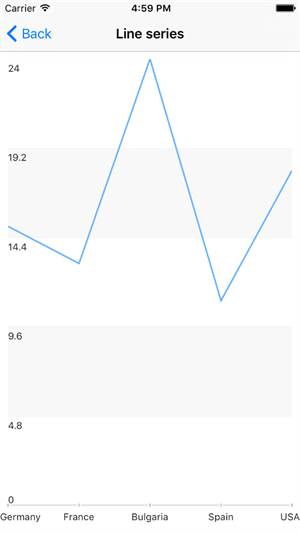
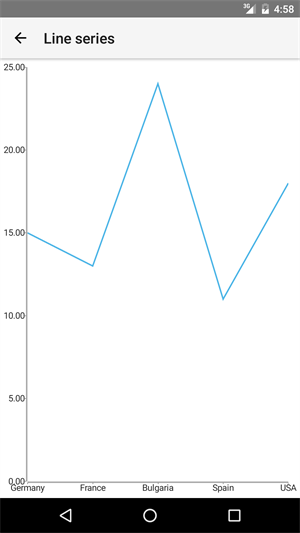
Let’s say we want to create an RadCartesianChart component with one LineSeries visualized on CategoricalAxis and LinearAxis. Just like with everything in Angular it all starts with a component that will hold your "page’s" content, in our case the RadCartesianChart element.
Simply open and close the RadCartesianChart element tags in the template of the Angular component. Between the RadCartesianChart tags add the LineSeries and set its items property with an Angular 2 binding. In order for the Angular framework to associate the declared LineSeries HTML element with the actual NativeScript RadCartesianChart, we need to tell it somehow, and this is done via the custom cartesianSeries directive. The same approach of declaration is true for the CategoricalAxis and LinearAxis—simply add those HTML elements between the RadCartesianChart tags and set the custom cartesianHorizontalAxis and cartesianVerticalAxis directives to associate the axis with the Chart.
<RadCartesianChart> <CategoricalAxis cartesianHorizontalAxis> </CategoricalAxis> <LinearAxis cartesianVerticalAxis></LinearAxis> <LineSeries cartesianSeries [items]="countries"
categoryProperty="Country"
valueProperty="Amount"></LineSeries></RadCartesianChart>As you may have noticed, any of the well-known properties of the LineSeries (categoryProperty, valueProperty) are settable via the HTML just like in the NativeScript XML. By design all of the RadChart Angular directives expose all of the underlining NativeScript element properties.
The following images show how the above code would look like when running your Angular 2 {N} application on iOS and Android:


Creating a PieSeries
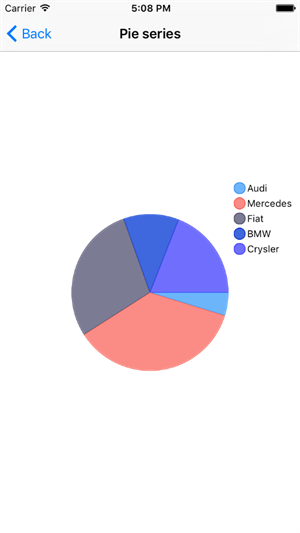
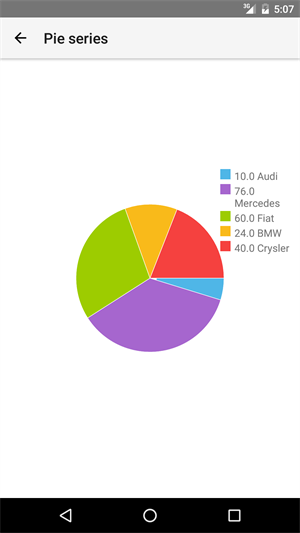
The same approach could be used to add an RadPieChart element to your application. The only difference is that, because the RadPieChart element is designed to work only with PieSeries, when declaring those series you will need to set the pieSeries directive to the series. This will instruct Angular to associate those PieSeries with the RadPieChart. Here is a sample code snippet that shows the pieSeries in action:
<RadPieChart> <PieSeries pieSeries selectionMode="DataPoint"
expandRadius="0.4" outerRadiusFactor="0.7"
[items]="pieSource"
valueProperty="Amount" legendLabel="Brand"></PieSeries> <RadLegendView pieLegend position="Floating"
offsetOrigin="TopRight" width="110"></RadLegendView></RadPieChart>

All of the RadChart series (Bar, RangeBar, Line, Spline, Area, Bubble, ScatterBubble, Scatter, Pie, Candlestick and Ohlc) are currently supported in Angular 2 and can be used just like the showcased series above. You can find more information about how to use RadCartesianChart and RadPieChart with Angular 2 in the online documentation here.
Learn More and Get in Touch
We are thrilled to bring the RadChart to the Angular 2 support of NativeScript and would like to hear what you think about this first peek of the Angular 2 directives.
You can learn more about UI for NativeScript right here. Also, don’t forget to sign up for the NativeScript Developer Day in Boston to get in touch with the latest news around {N} and meet fellow developers.

Vladimir Amiorkov
Vladimir Amiorkov is a Software Developer at Progress. He is currently working with Web, iOS and Android technologies and is a part of the NativeScript team. In his spare time, he enjoys playing computer games such as Diablo and StarCraft.
