
Analyzing NEOs with Telerik UI for UWP

Summarize with AI:
Telerik UI for UWP can quickly create powerful visualizations from your data. Let's explore an example using Chart and Grid to analyze near-Earth objects in space.
In this blog post, you'll learn how to use the Chart and Grid controls in Telerik UI for UWP to create rich visualizations and tables of large datasets.
Earth in a Billiard Room of Space Objects
The Solar System has millions of objects in orbit around the Sun and its various planets – including Earth. These objects range in size. Many of them are small; measuring 10–100 meters in diameter. Others are much larger. For example, the largest known asteroid in our Solar System is Ceres; a whopping 974 kilometres (or 605 miles) in diameter. That's roughly the width of Montana. It's so big that it's classified as a minor planet.
There is a small but significant risk to Earth posed by these objects in space. Some of them are so massive and travel at such high velocities that a direct impact with would be catastrophic to life as we know it. This is why space agencies like NASA and volunteer groups around the world spend time identifying, classifying, and tracking these objects. The hope is that if a collision can be detected early enough then there would be sufficient time for us to devise a strategy to thwart it.
There's a special classification of objects in space known is a near-Earth object or NEO. This is the designation used for an asteroid or comet whose orbit can put it in close proximity to our planet. Any NEO that has an orbit that crosses Earth's and has a diameter greater than 140 metres is classified as a potentially hazardous object (PHO).

Source: NASA/JPL-Caltech
When you consider the risk we face here on Earth of the objects floating around us, the situation warrants our time and attention. For that reason, I thought it would be fun to perform some data analysis by building a UWP application with Telerik UI for UWP.
Before We Begin
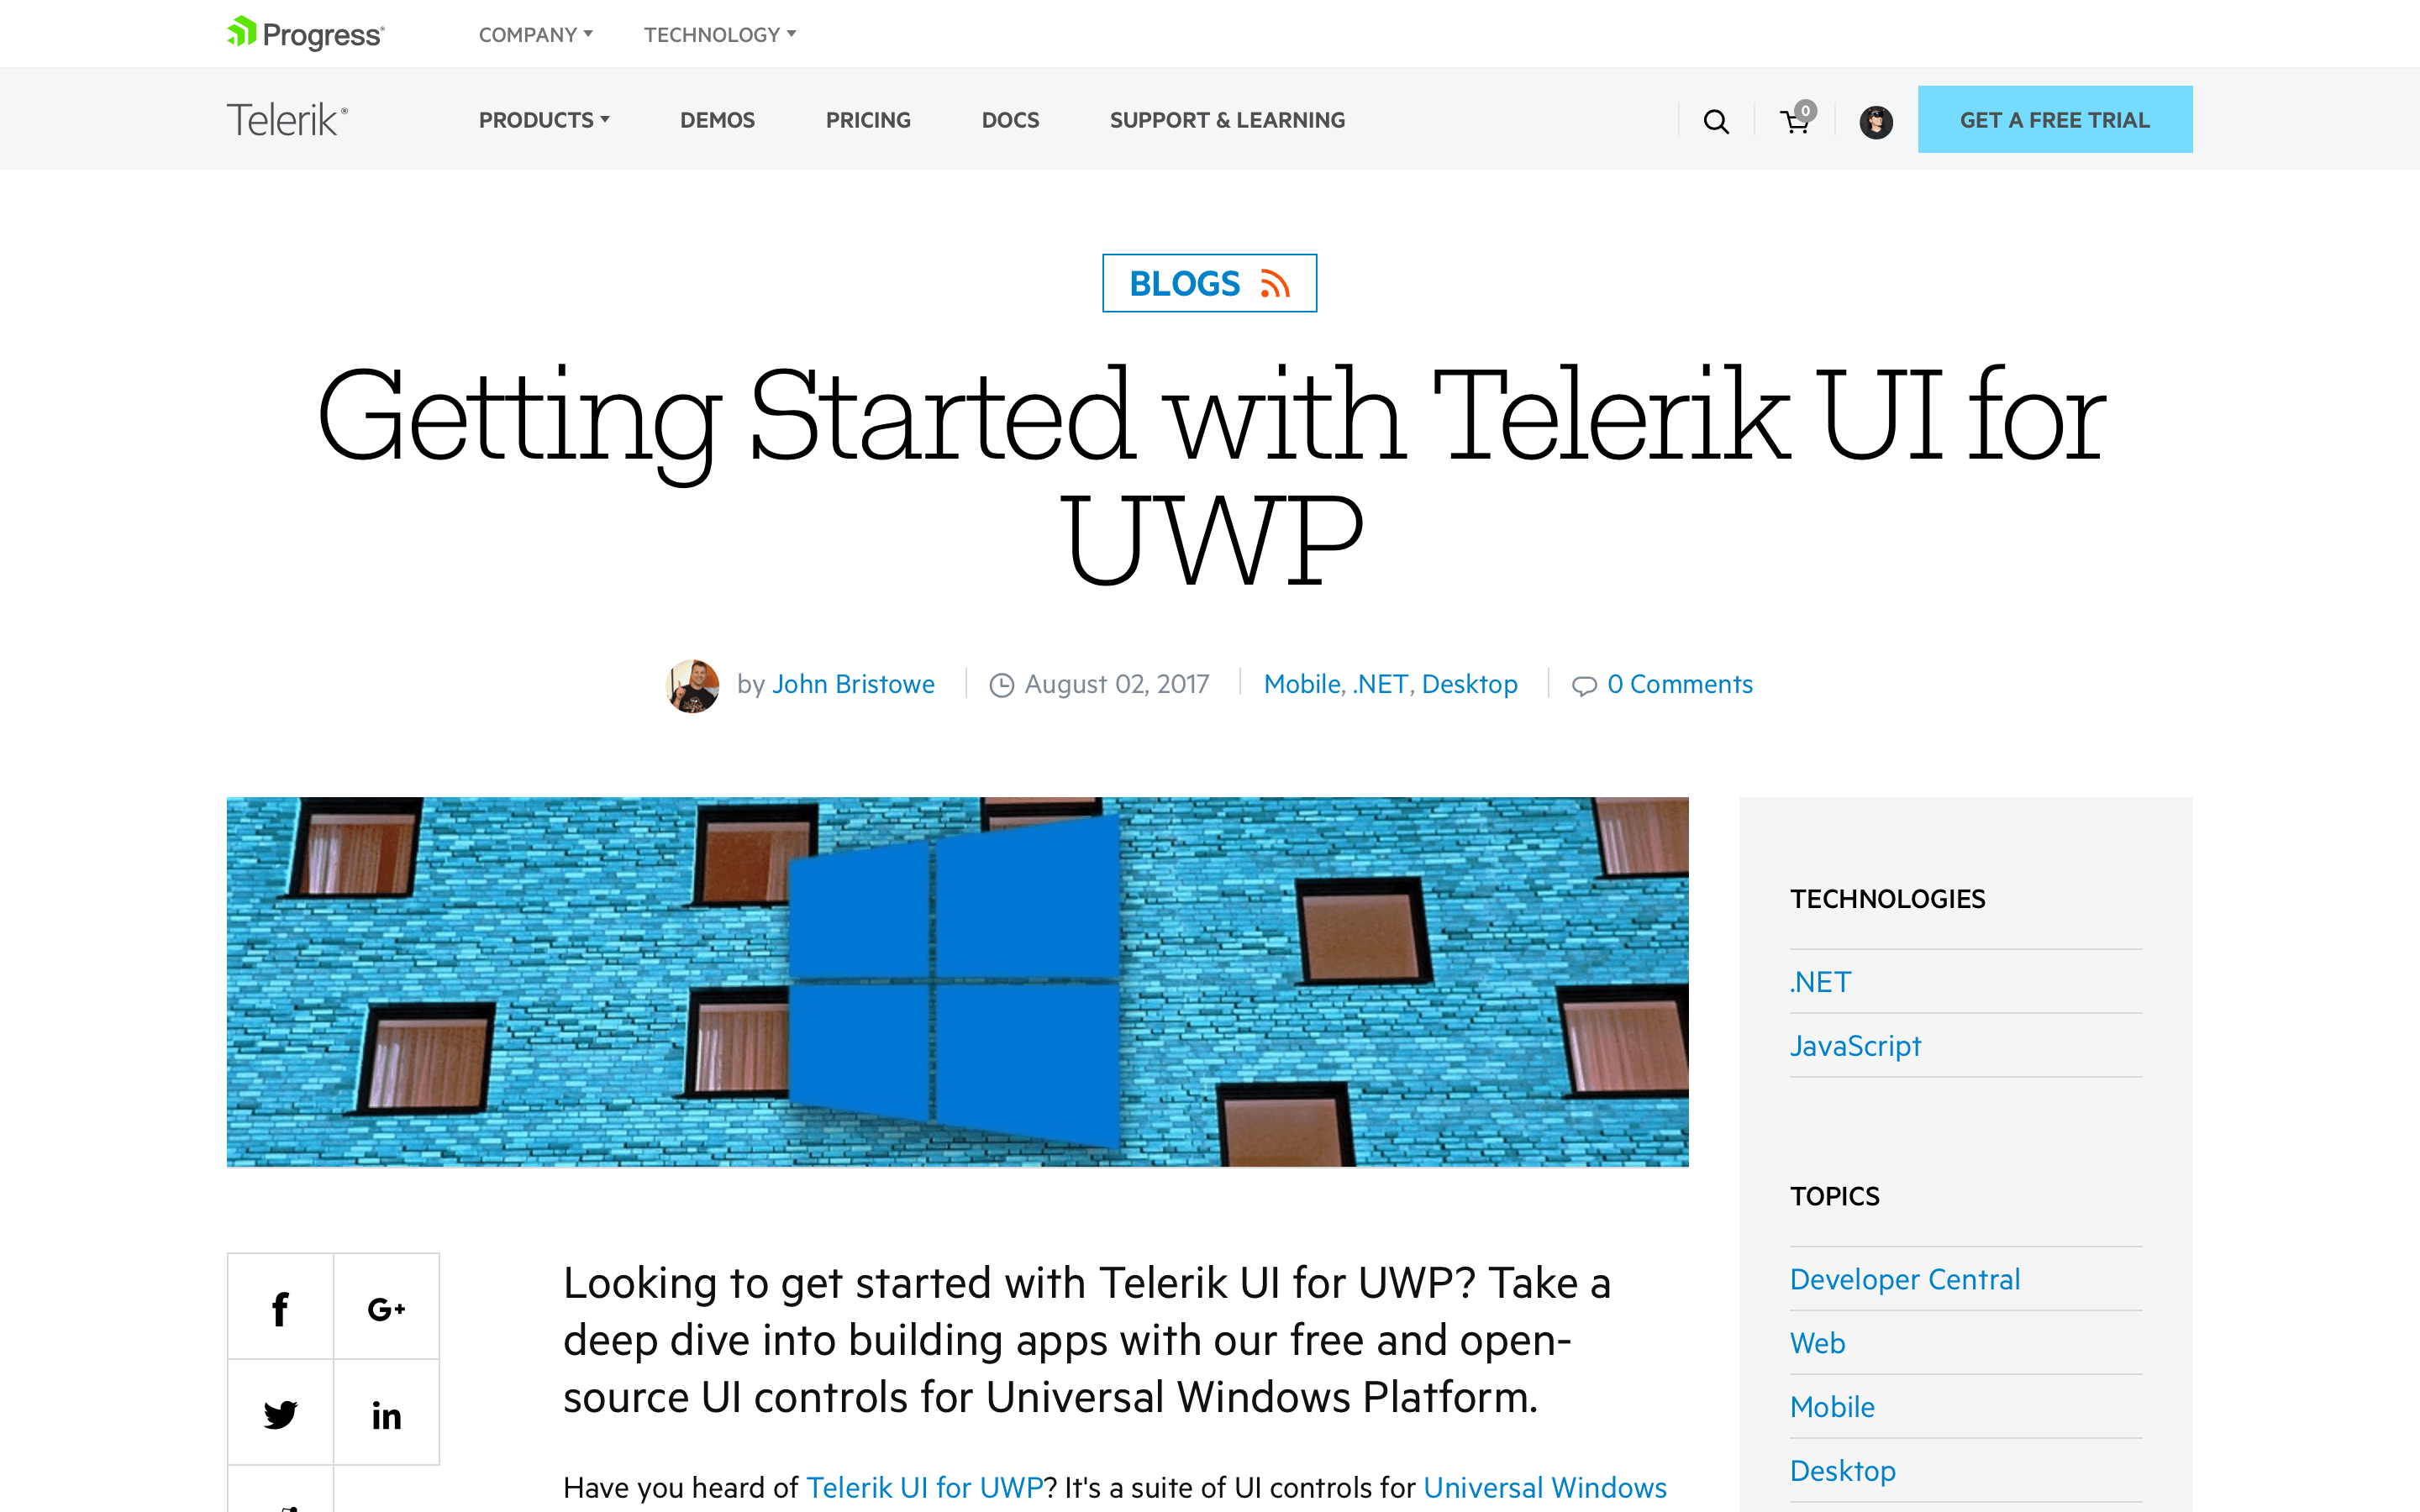
I'd recommend reading my article entitled, Getting Started with Telerik UI for UWP if you're looking for a good primer on Telerik UI for UWP. It provides a detailed overview of the project, its goal, and a simple example that highlights the Chart and Grid.
Analyze This
Let's see how to analyze the data on NEOs using the Chart and Grid controls in Telerik UI for UWP.
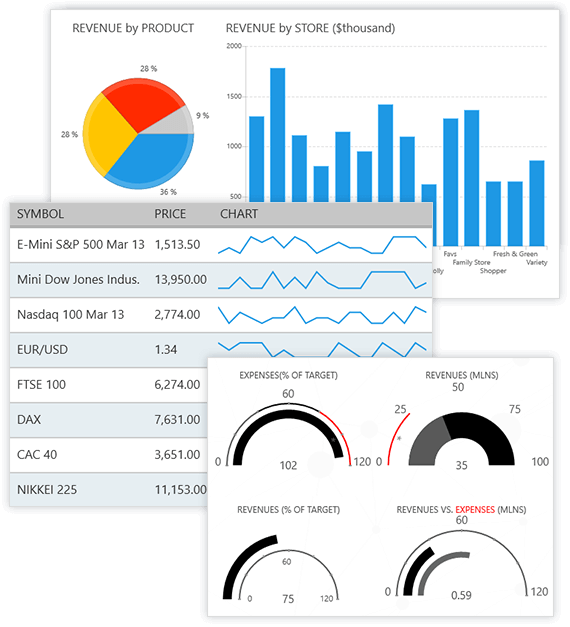
Telerik UI for UWP is a suite of over 20 controls that help developers build UWP applications. It contains controls that address common UI requirements in line-of-business (LOB) applications, including data management, scheduling, navigation, and data visualization. The source code for these controls can be found on GitHub: UI-for-UWP.
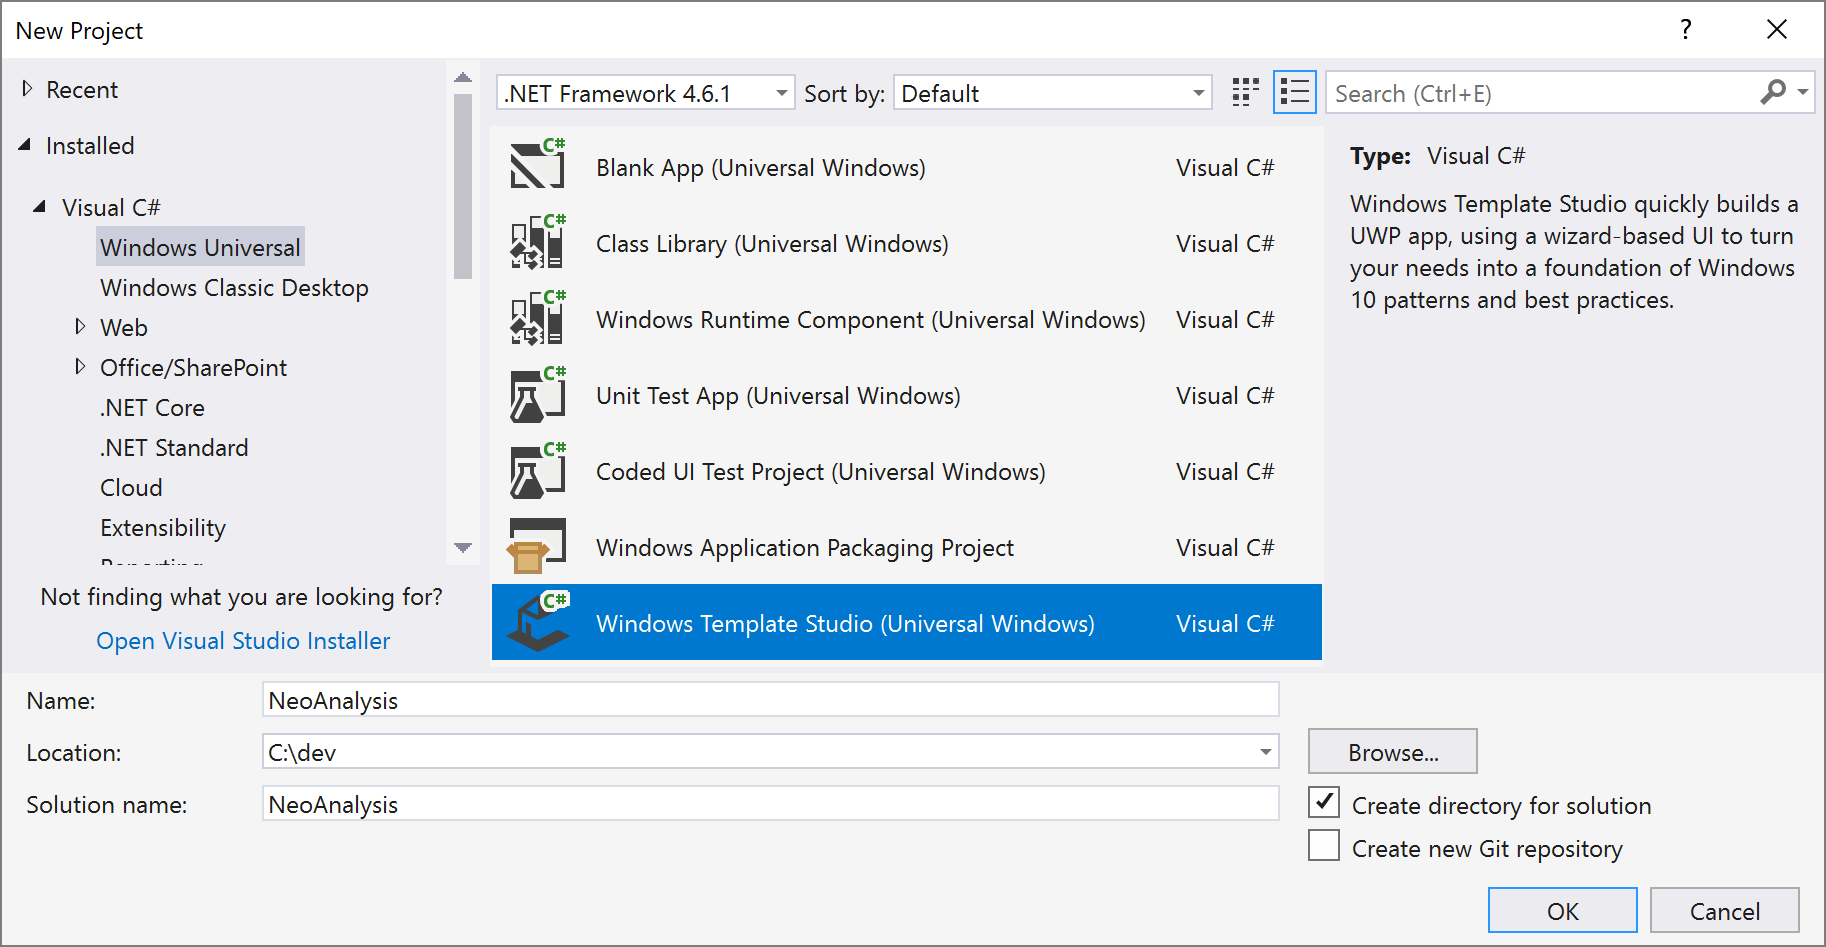
One of the most effective ways to get a UWP project up and running is through Windows Template Studio. This extension for Visual Studio generates a project structure and source files through templates. It can be downloaded and installed into Visual Studio through the Visual Studio Marketplace: Windows Template Studio.
I'll start by creating a new project in Visual Studio called "NeoAnalysis":
Windows Template Studio will display a wizard that allows me to select various options to control what will be generated for my project:
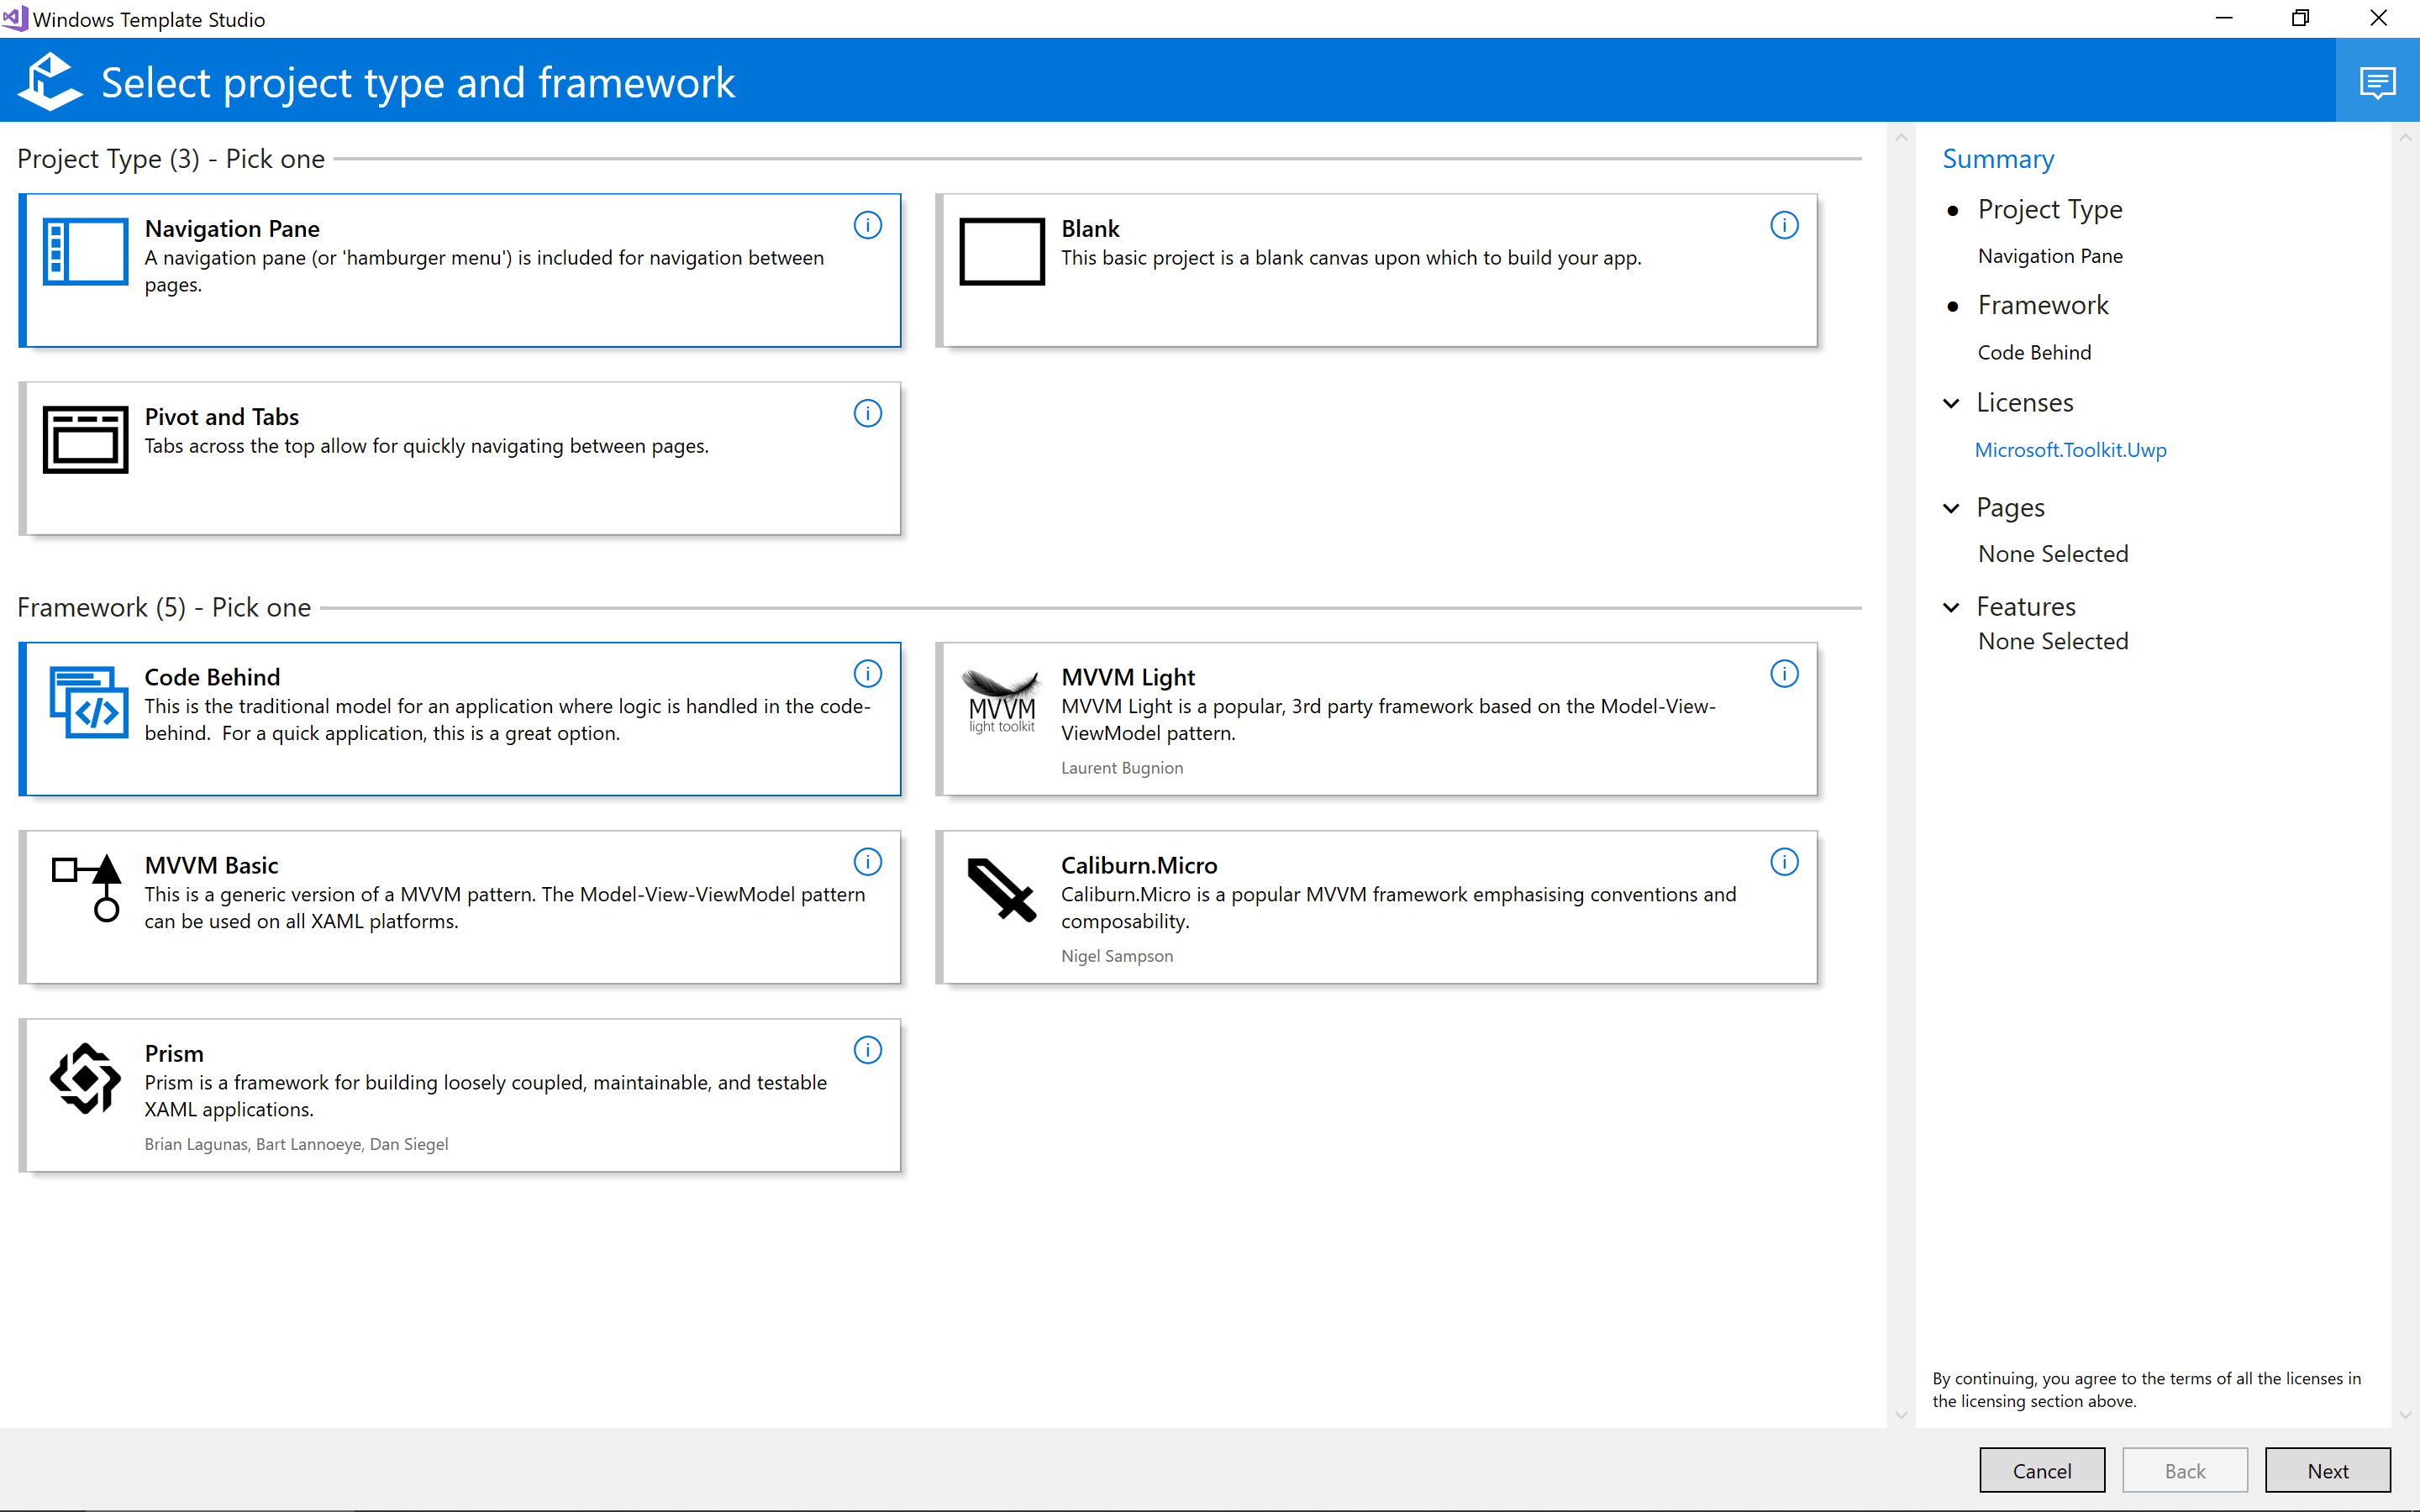
For example, I can choose to generate a project that incorporates a navigation pane (also known as a hamburger menu) for the visual structure. This control enables users to navigate quickly between the views available in an application. Windows Template Studio also provides options for popular frameworks like MVVM Light, Caliburn.Micro, and Prism.
Navigating to the next page of Windows Template Studio provides the option to control the kinds of pages I wish to generate for my UWP project. As an example, I can select the option to create pages for the Chart and Grid controls from Telerik UI for UWP:
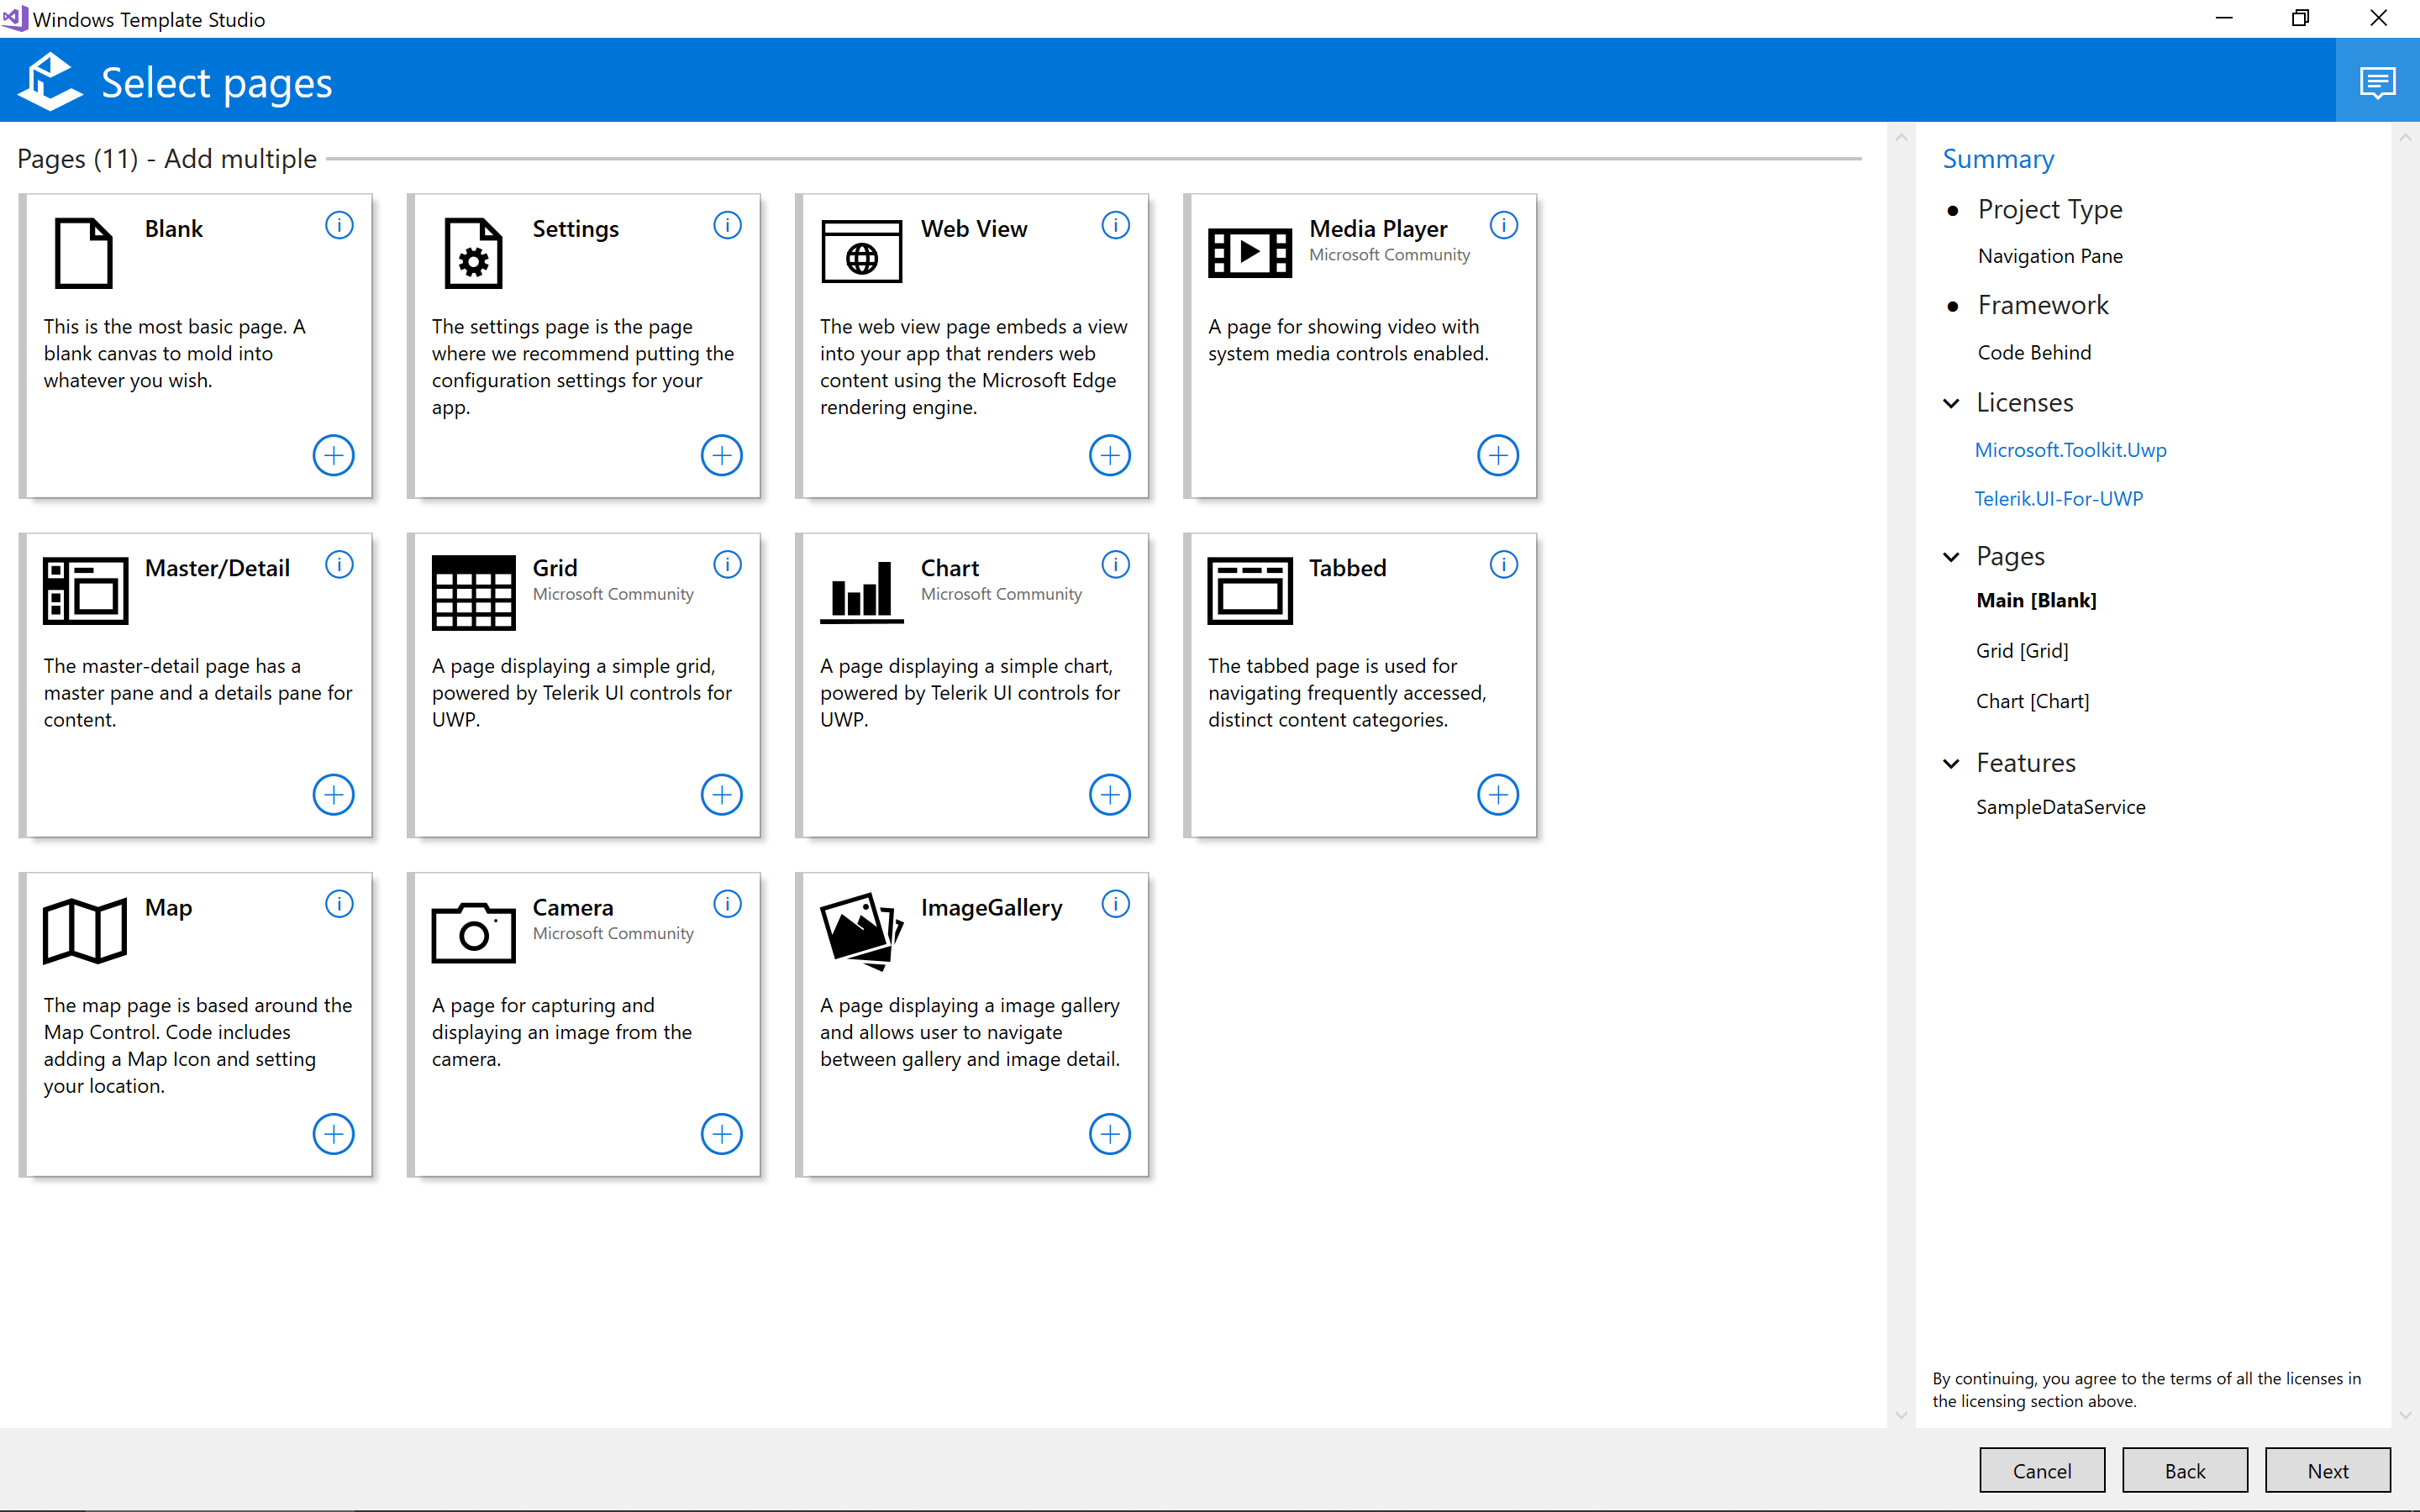
Windows Template Studio will generate individual pages for each option you pick. These can be modified after the project is generated. For this example, I'll create a page that combines the Chart and Grid controls.
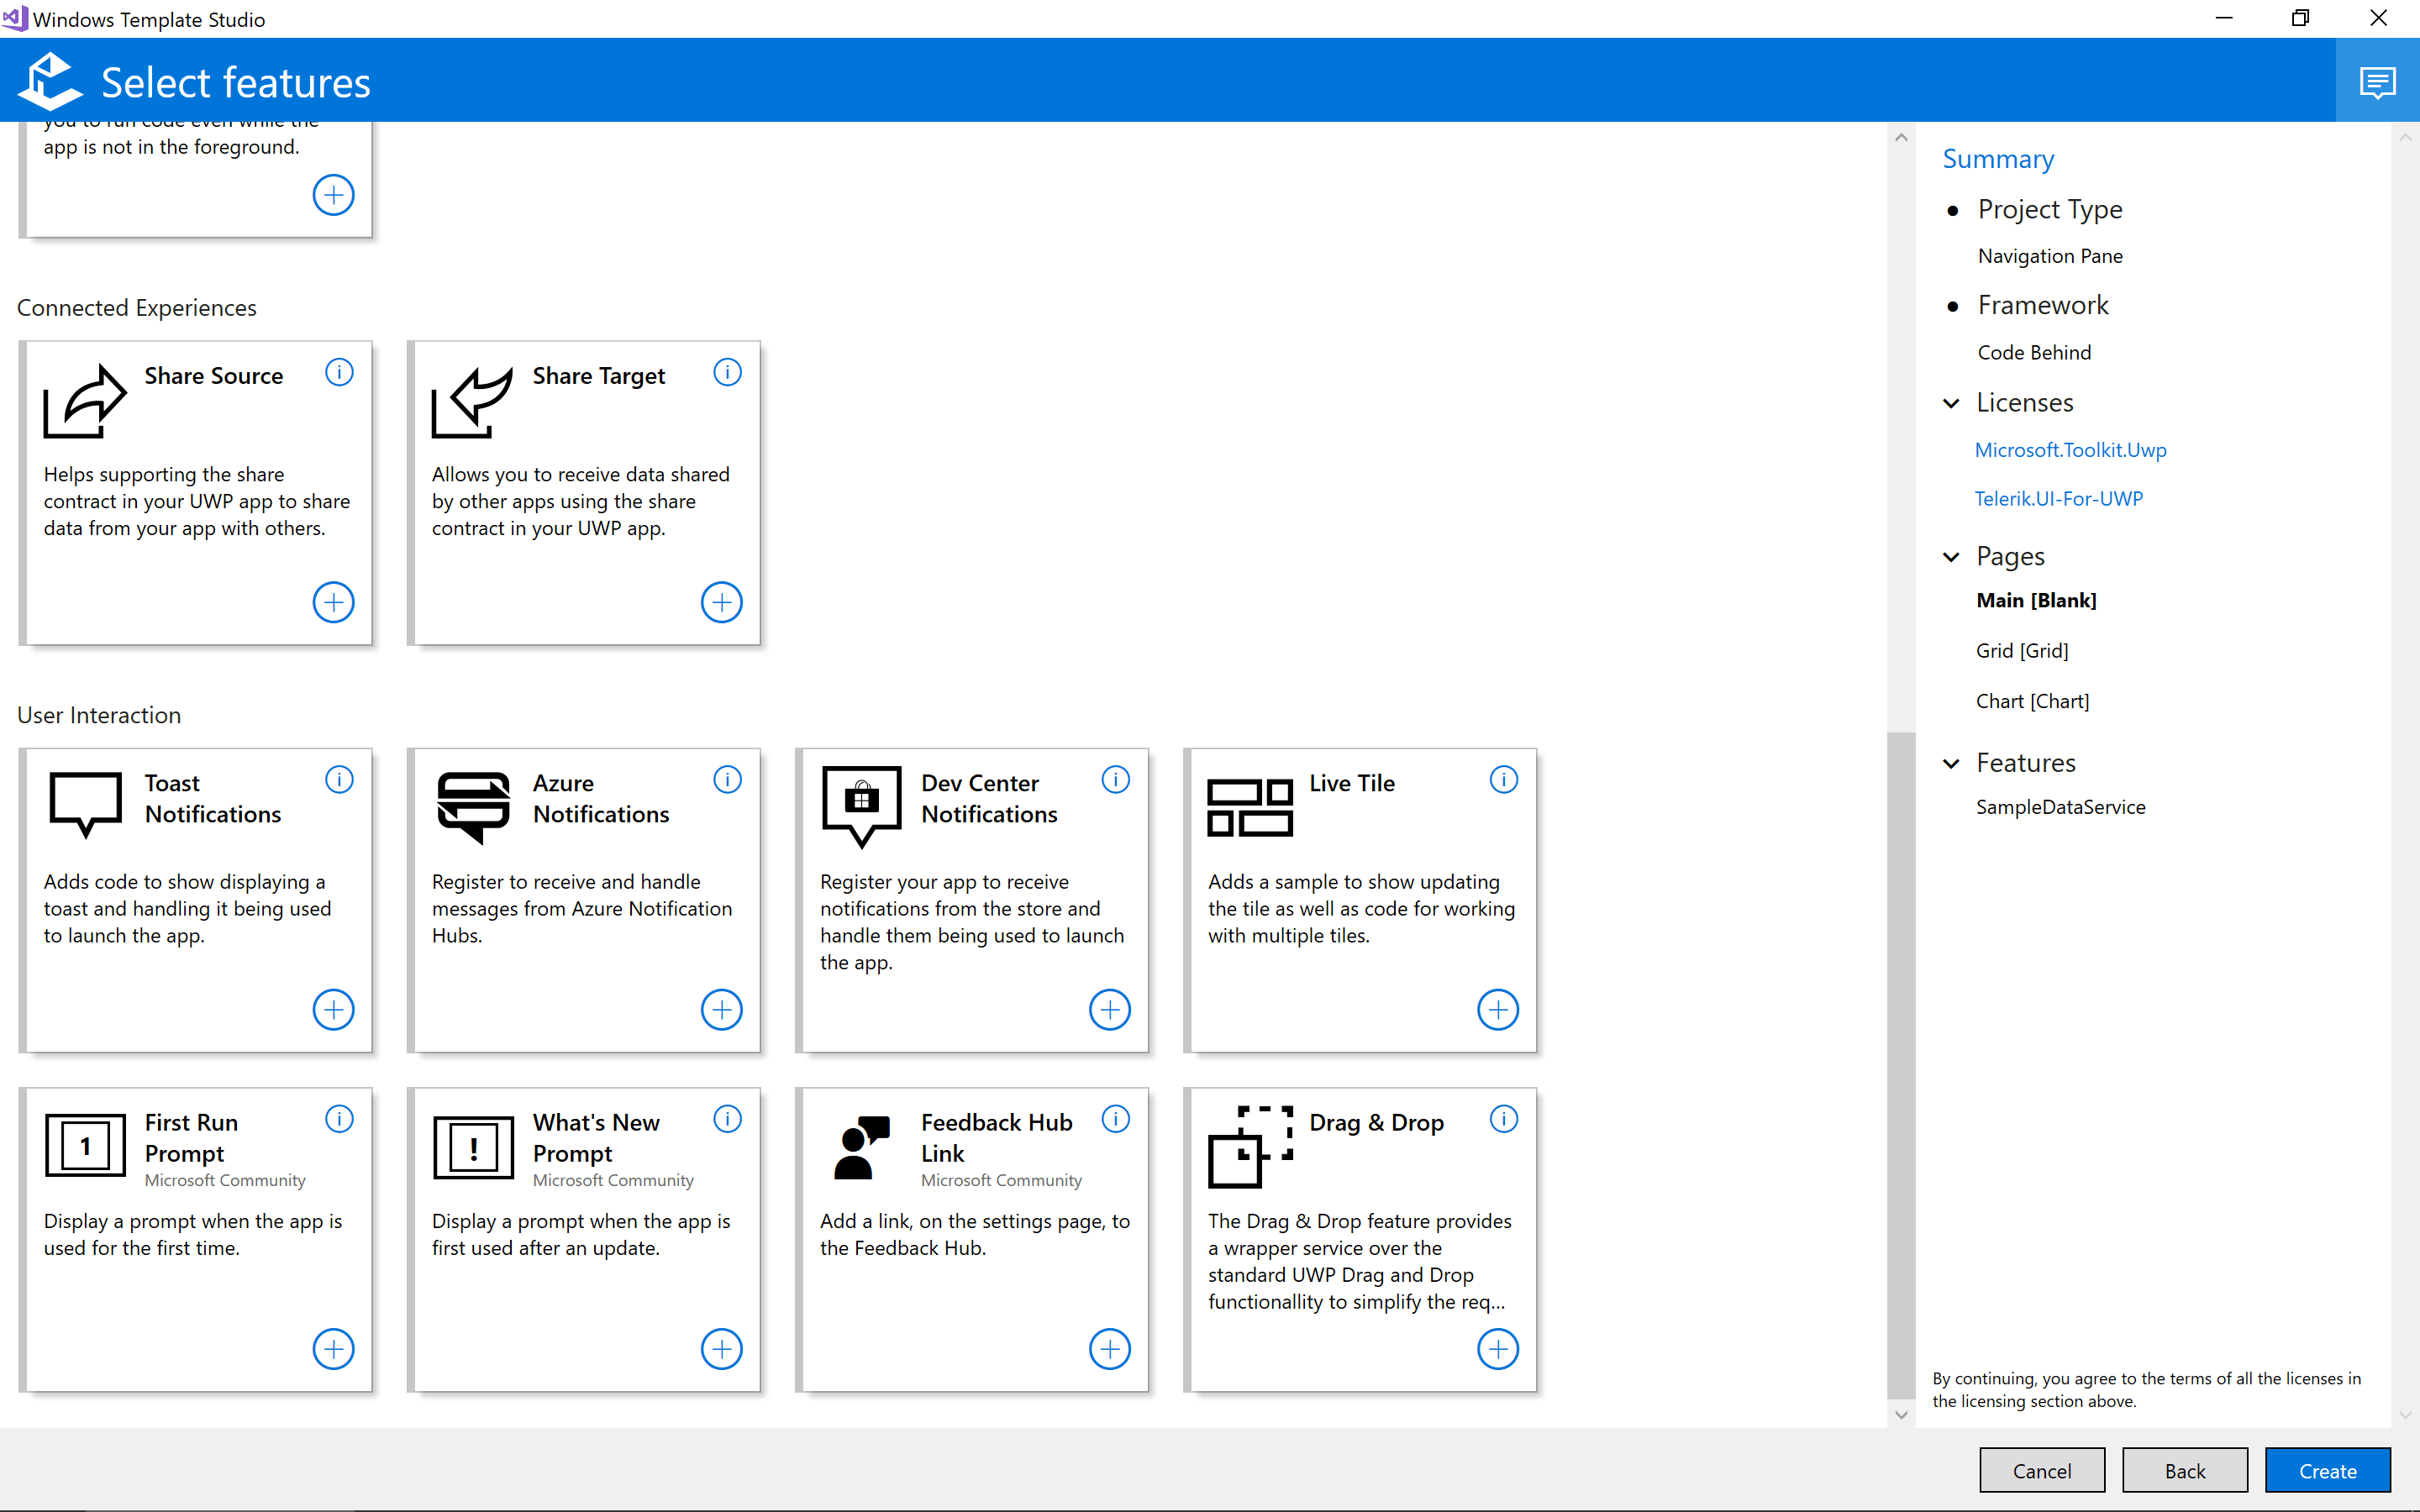
After specifying the pages I wish to generate for my project, Windows Template Studio presents a set of features I may wish to integrate into my project:
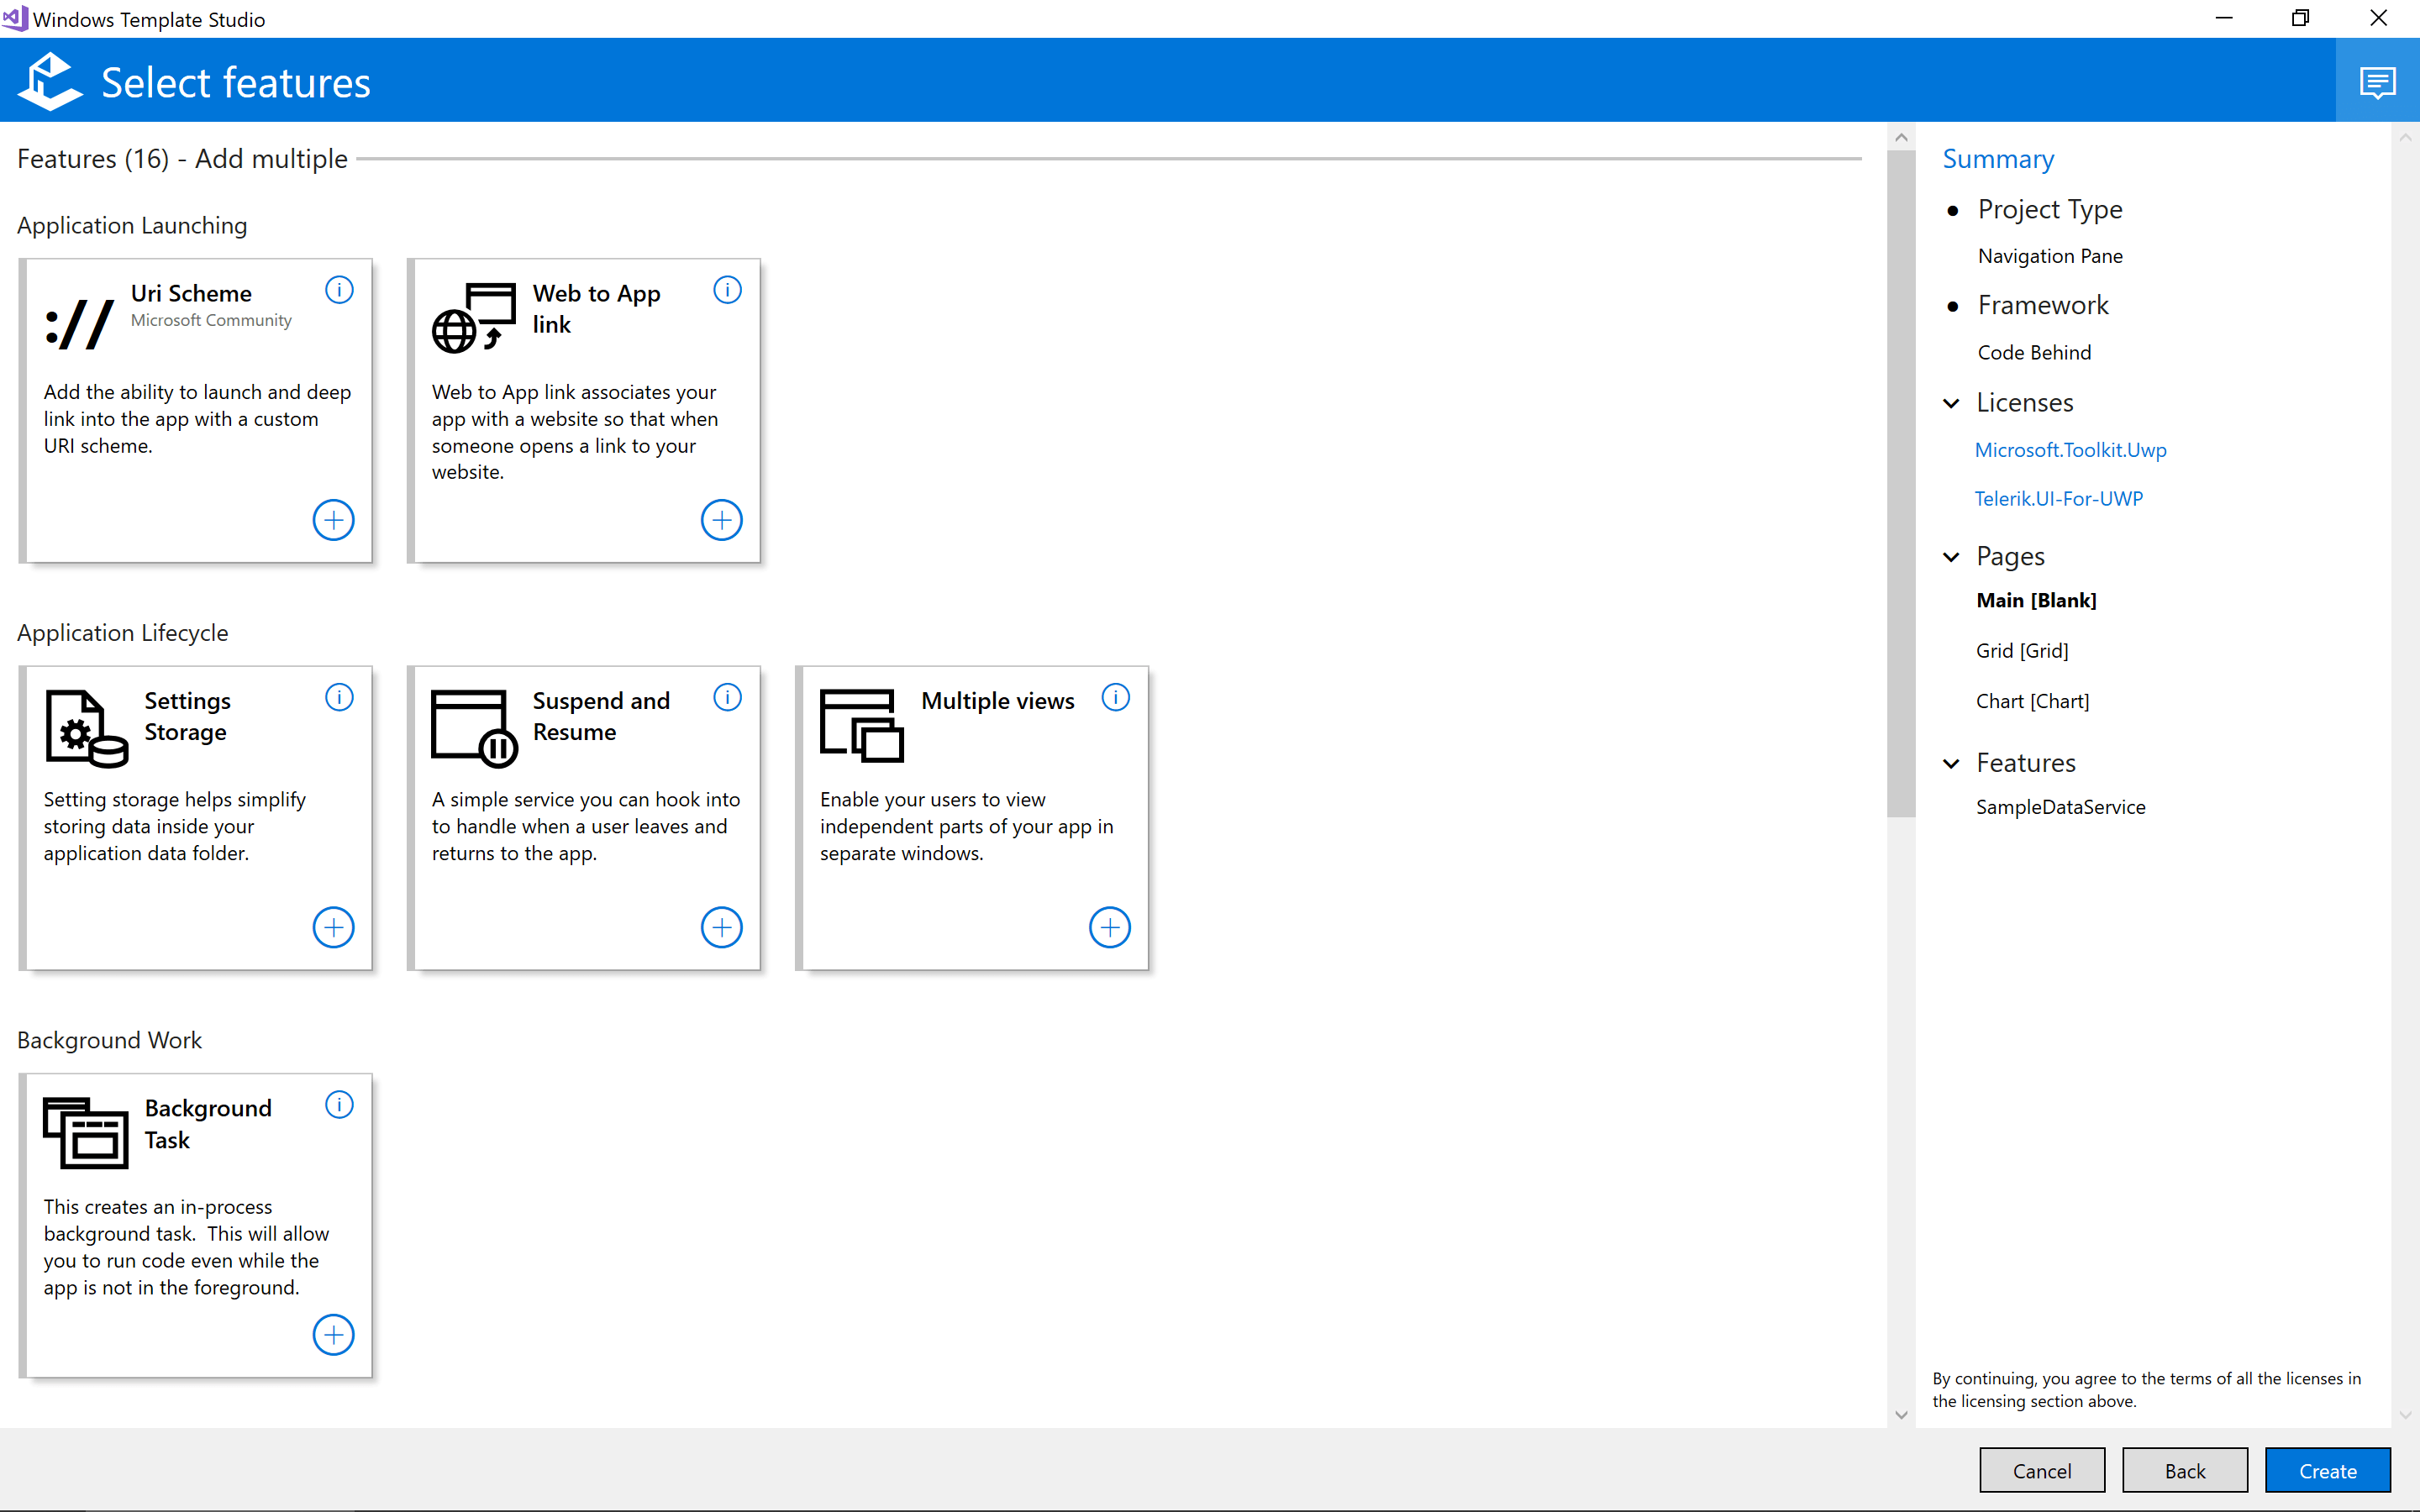
There are numerous features from which to choose. These range from simple features like web-to-app linking to more advanced features like settings storage.
The majority of the features are made available through the UWP Community Toolkit. This is an essential library for developers building UWP applications. If you're curious to find out more about the UWP Community Toolkit, I'd recommend checking out the UWP Community Toolkit Sample App, which is available through the Microsoft Store.
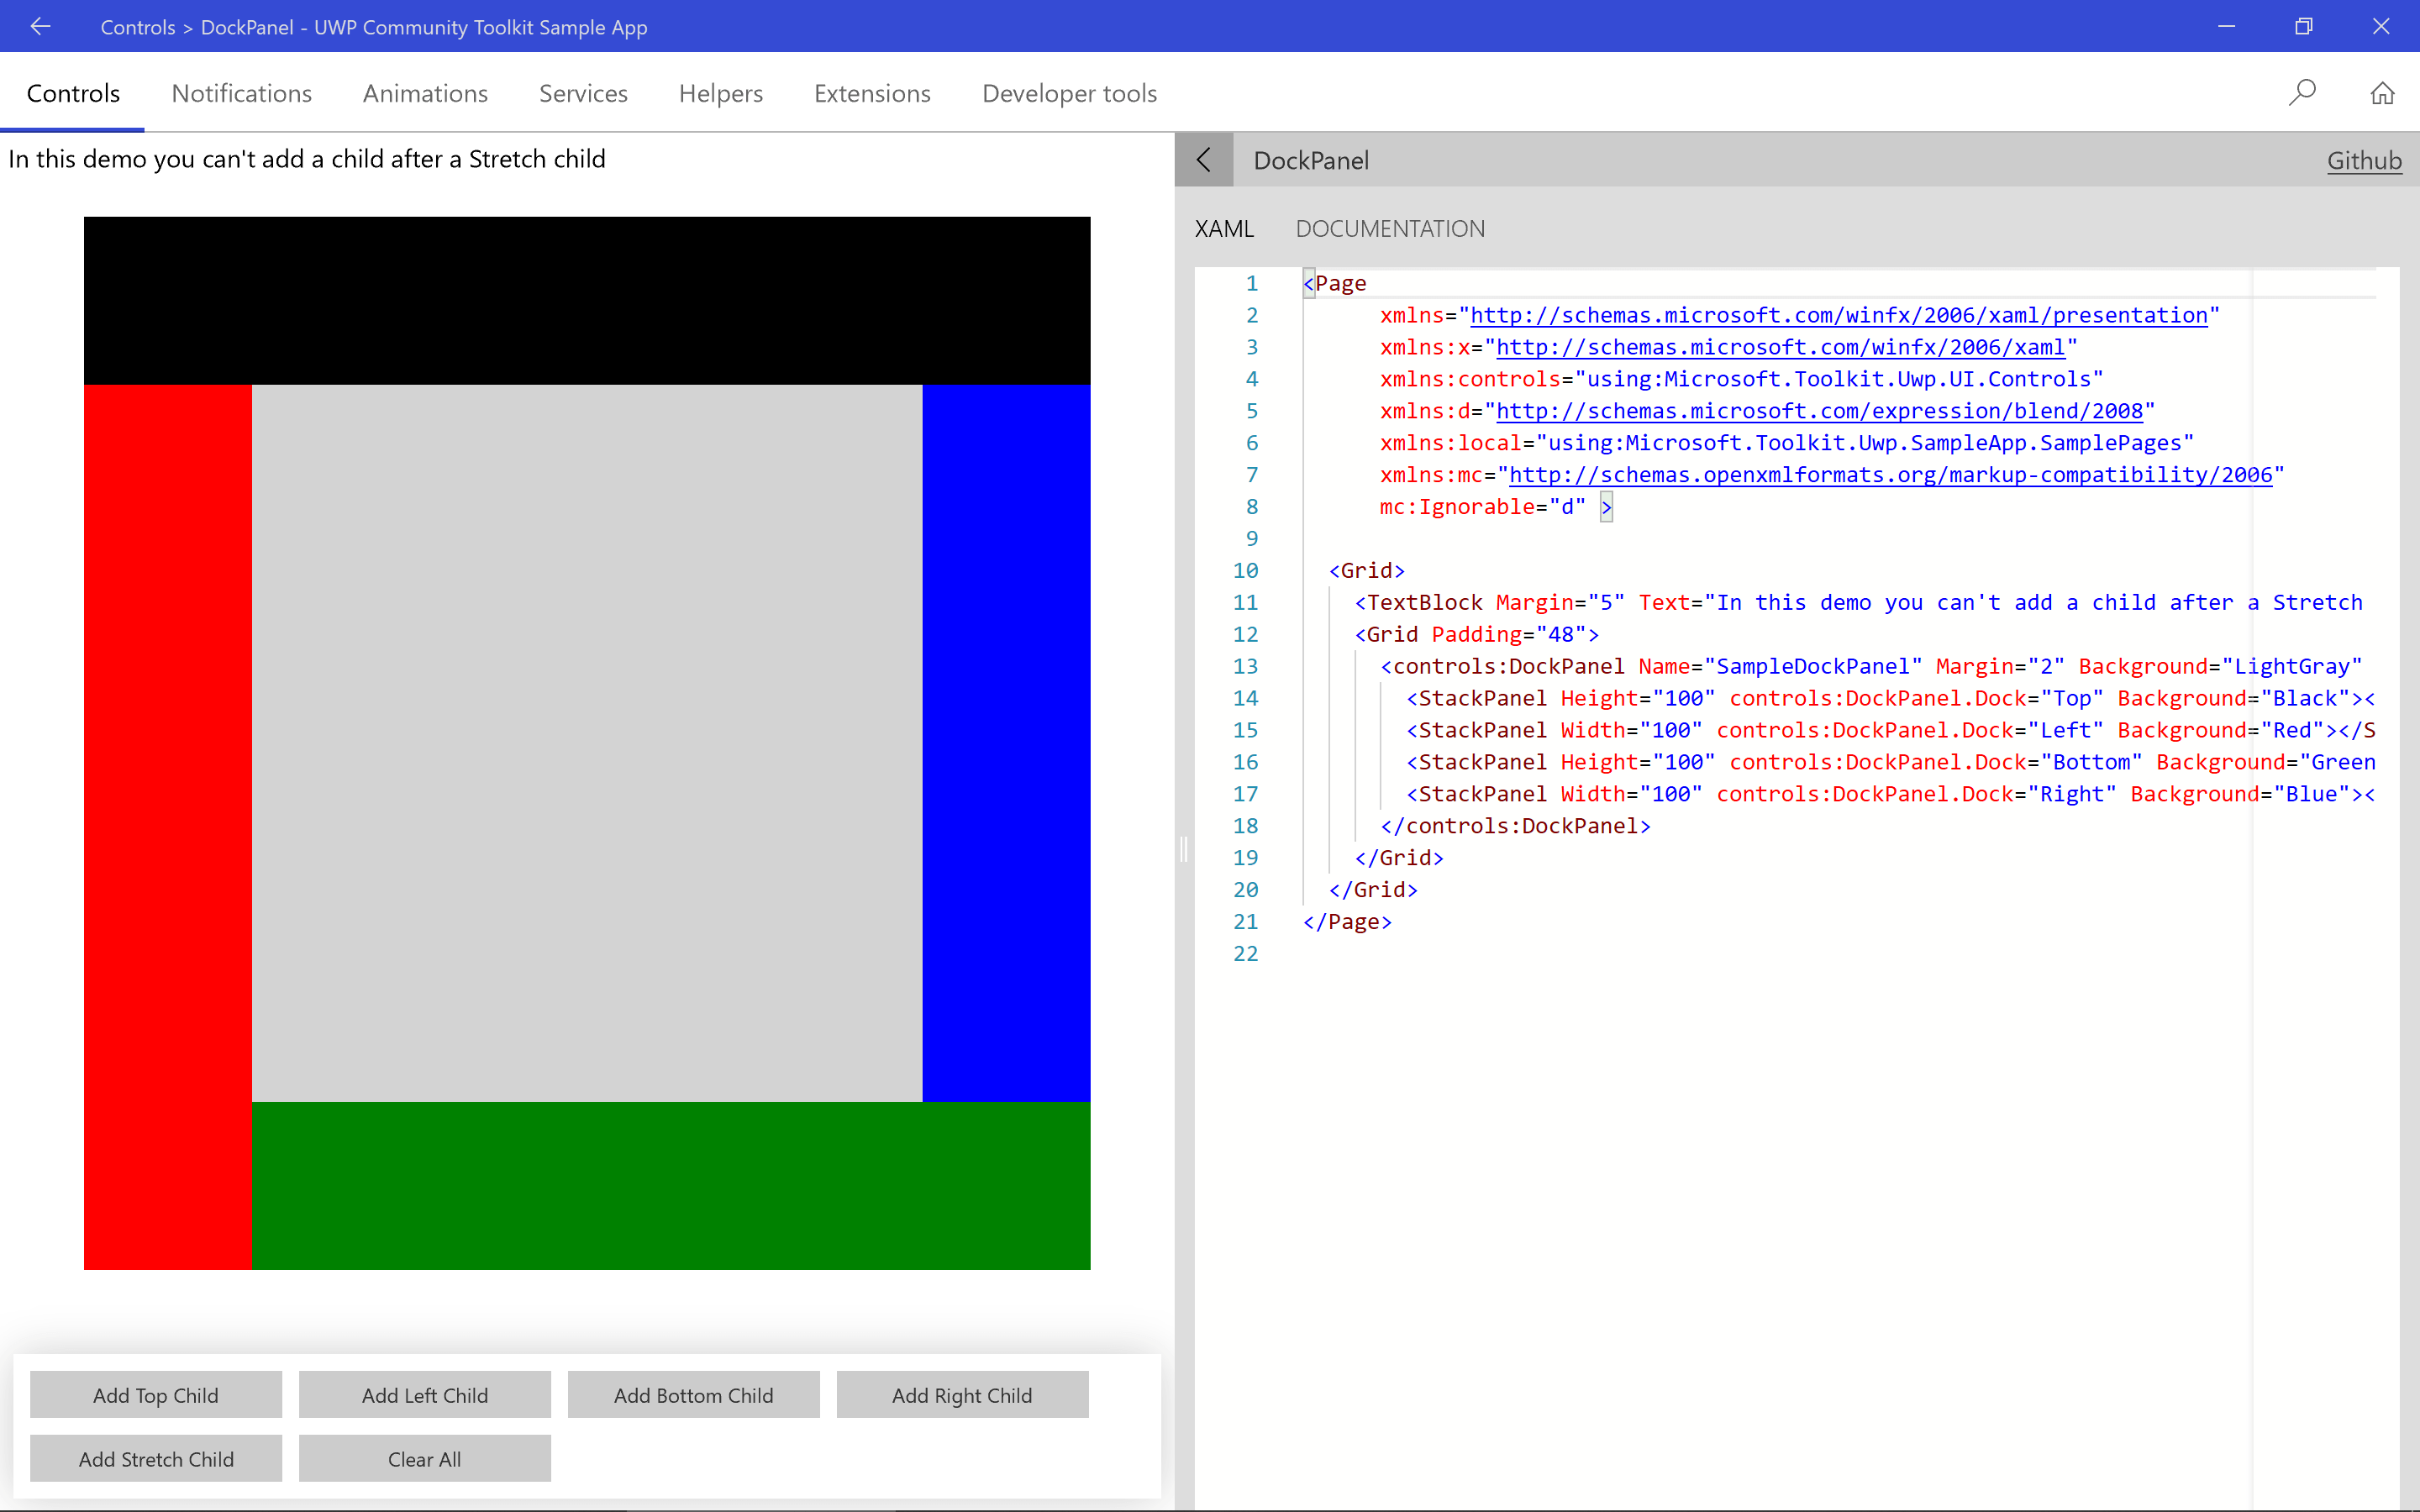
The UWP Community Toolkit Sample App provides a large set of examples and accompanying source code to help you get started.
Accessing NEO Observational Data
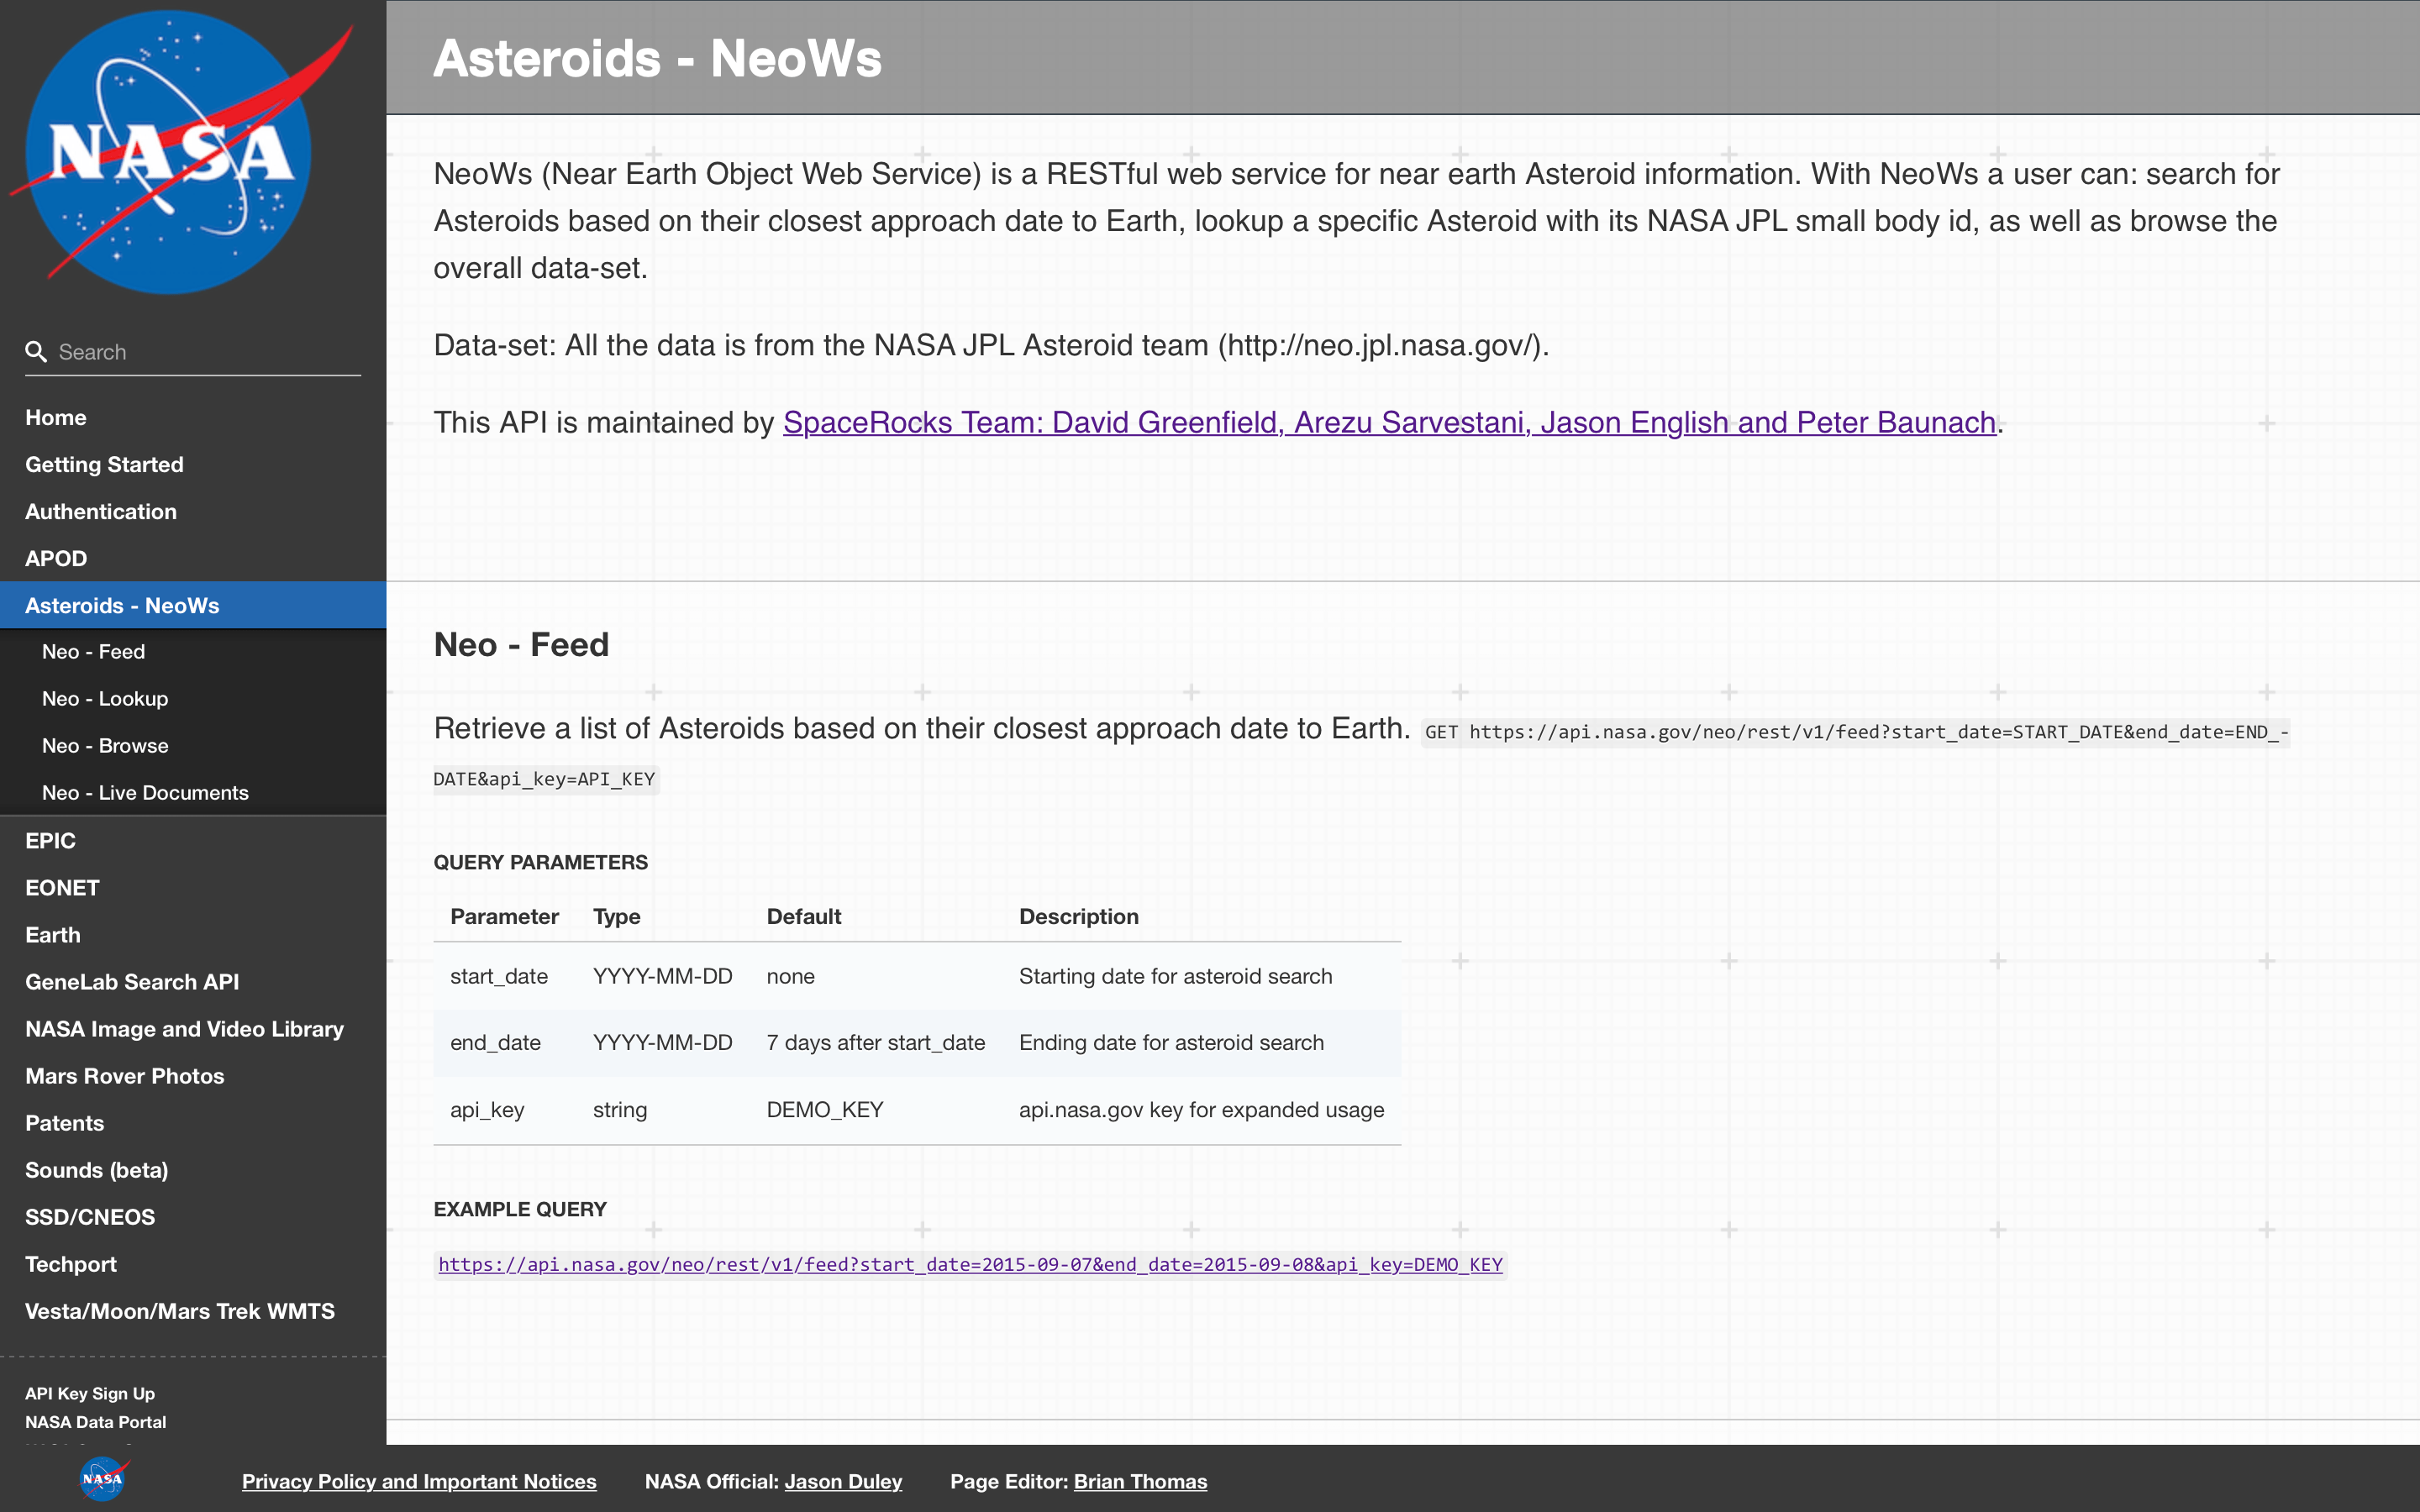
After Windows Template Studio has generated my project, the next step is build a page that displays NEO-related data in a Chart and Grid. This data is available from numerous space agencies and organisations around the world. A good example is NASA's Open Data Portal, which provides access to many datasets relating to Space Science, including the Small-Body Database and NEO Earth Close Approaches from the Jet Propulsion Laboratory (JPL). NASA also provides an API for its NEO observational data. NeoWs, which stands for “Near Earth Object Web Service,” provides data on space objects near Earth.
These APIs provide detailed information about nearby objects and are relatively simple to use. For example, I can use the Feed operation to get a list of objects scheduled to be in close proximity to Earth over the next week (February 22–28, 2018). Progress Test Studio for APIs makes this easy:
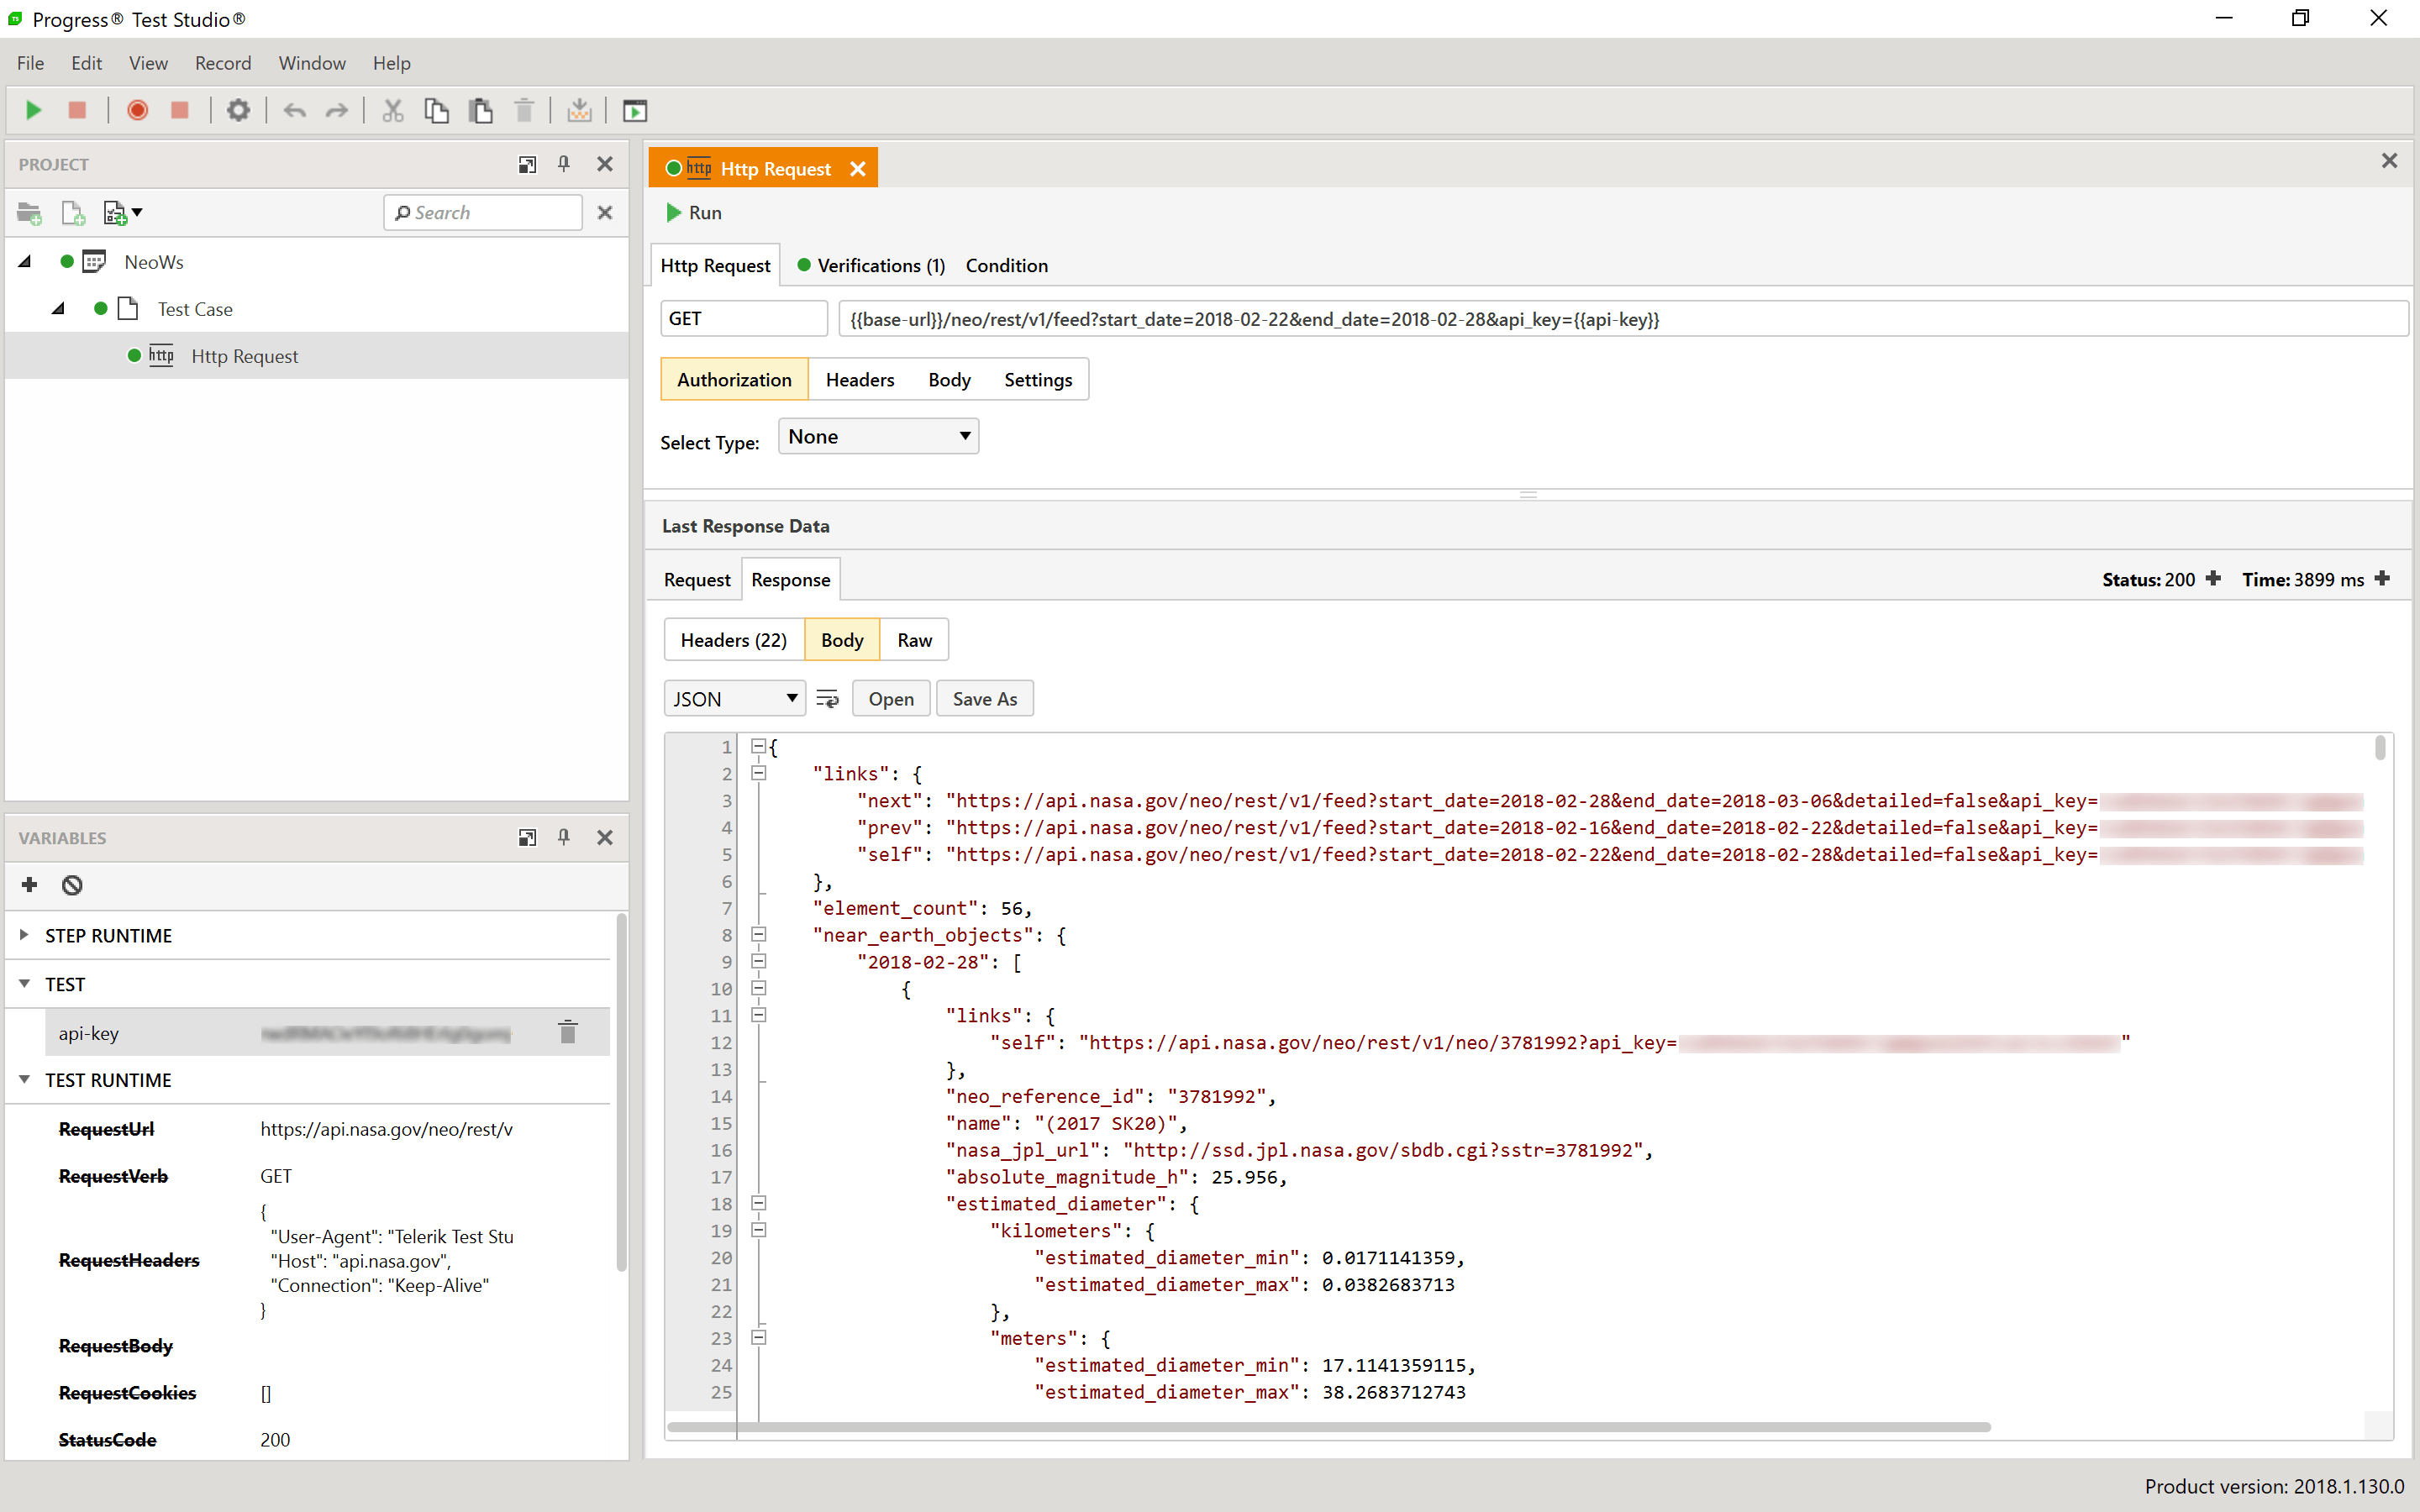
Before accessing this service endpoint, you will need to secure an API key from the NASA API portal. This key must be provided for requests you make. In Progress Test Studio for APIs, I can define the service endpoint (base-url) and API key (api-key) as test-time variables in the request URL. This makes them easier to manage in my test project. I can also assert that certain conditions are met through the Verifications tab (i.e. HTTP 200 OK response).
Alternatively, I could use the Composer tab in Telerik Fiddler to create similar requests to test the service endpoint:
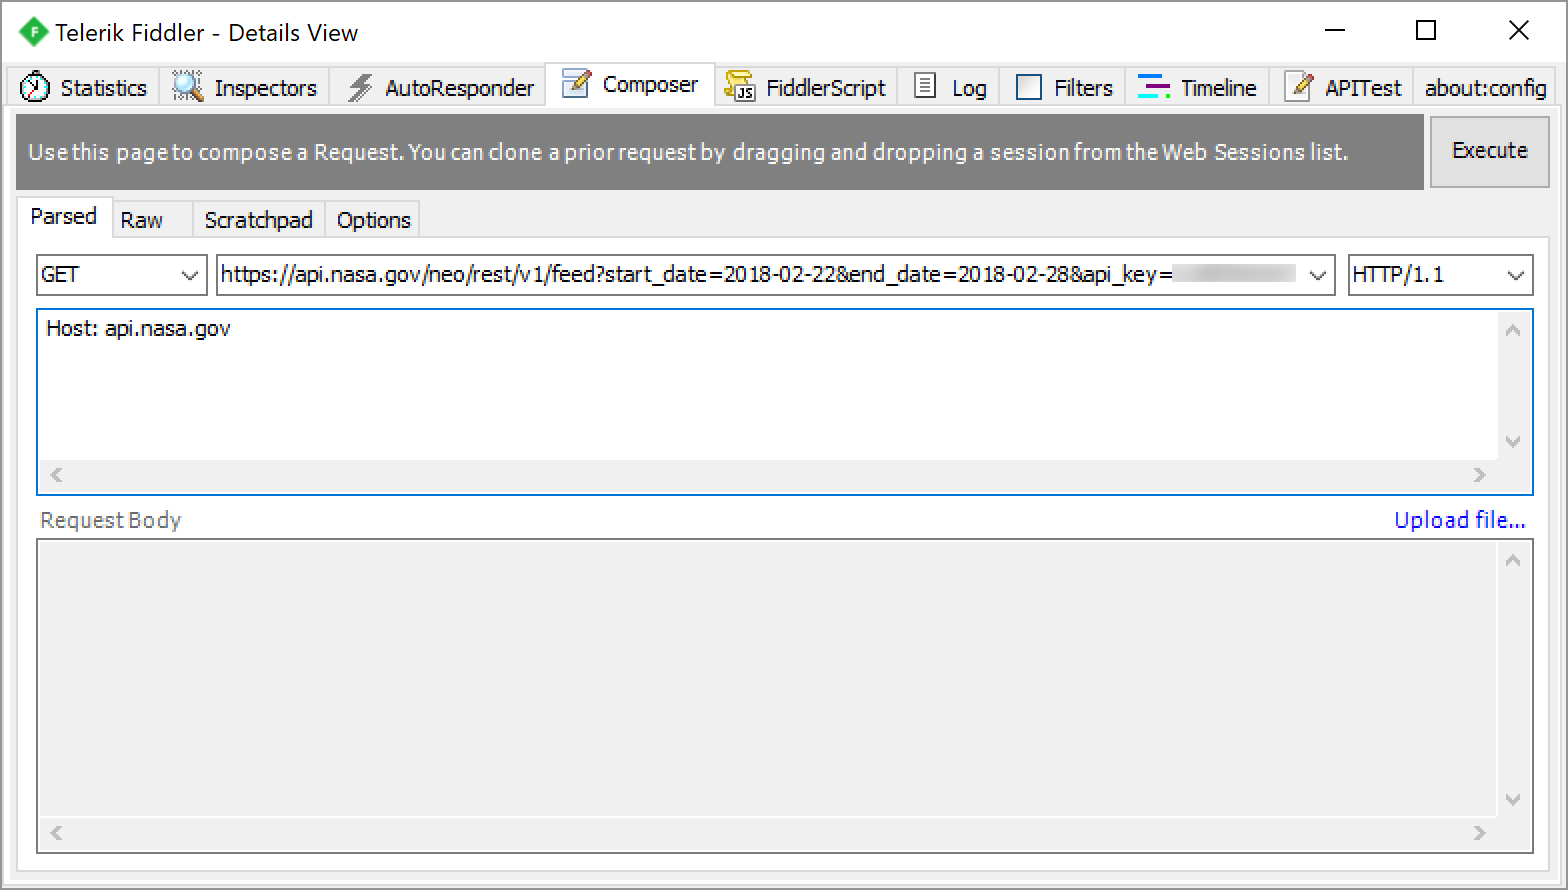
And I can use the Inspectors tab to view the response:
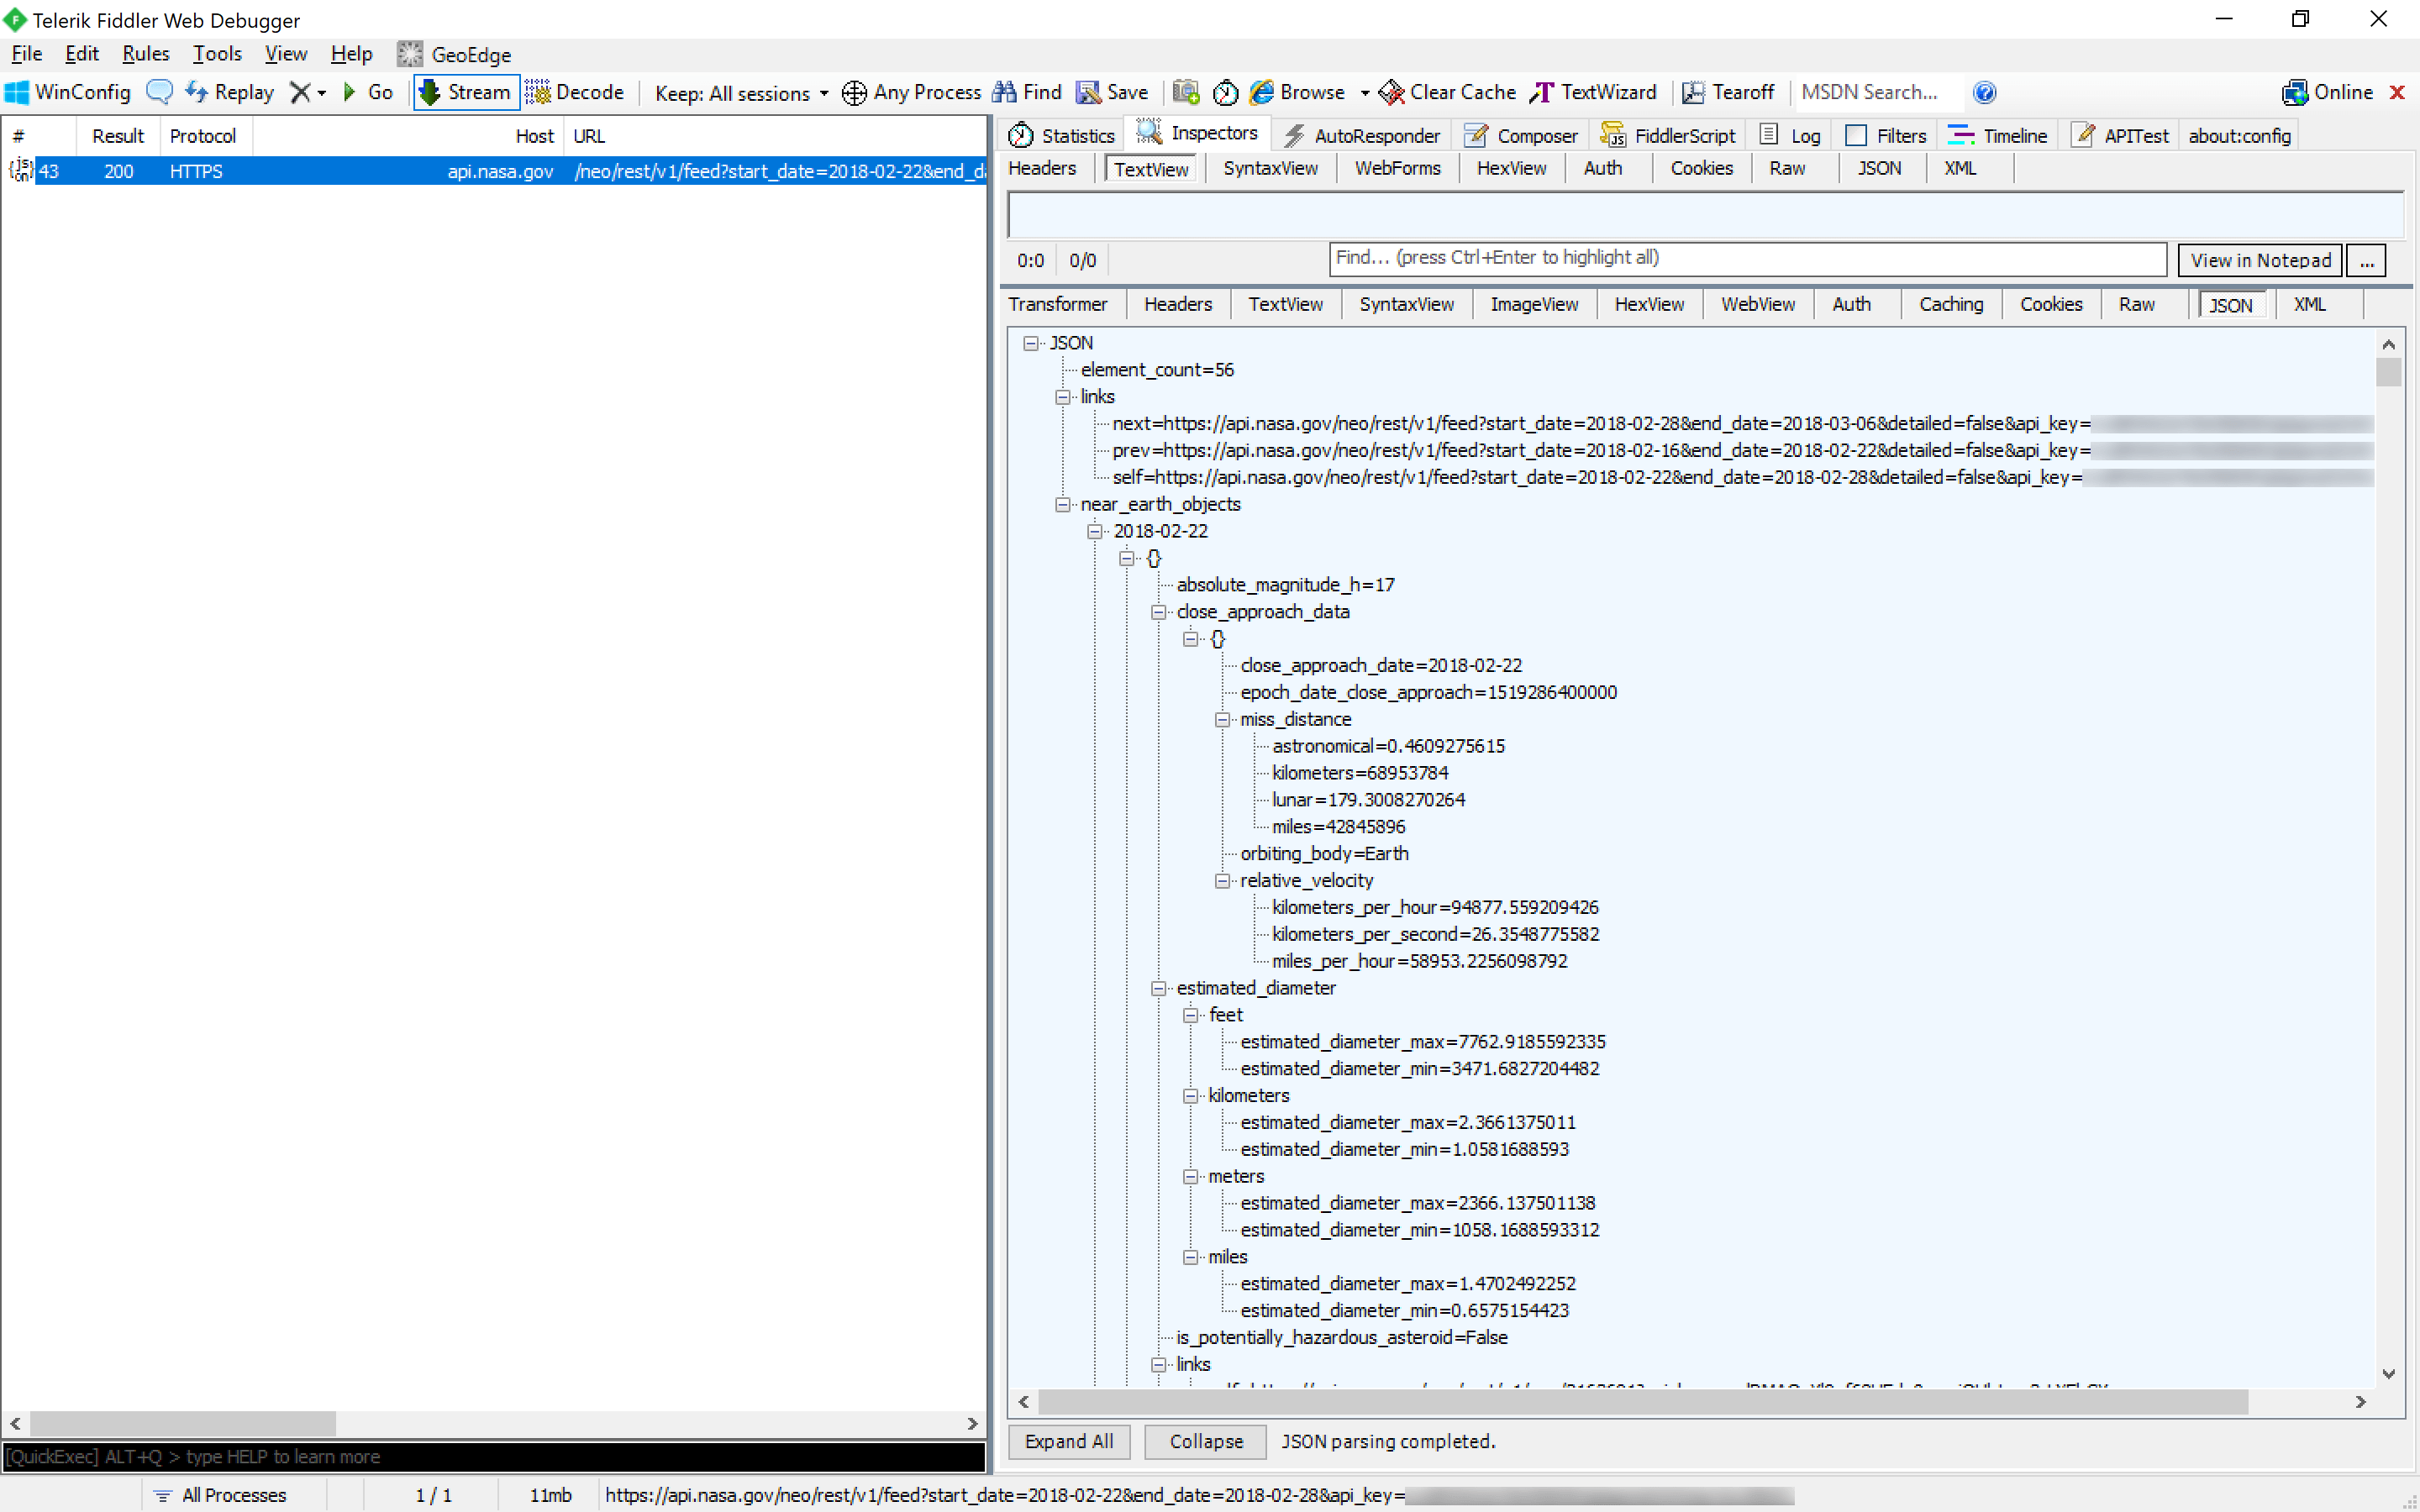
Once I've understood how the service endpoint works, I can integrate it with my project through a proxy class and client libraries like RestSharp. For example, here's the code necessary to send a request to the Feed operation:
using RestSharp;using System;var client = new RestClient("https://api.nasa.gov");var request = new RestRequest();request.Resource = "neo/rest/v1/feed";var startDate = DateTime.Now.Date;var endDate = startDate.AddDays(7);var apiKey = ""; // specify your API key hererequest.AddParameter("start_date", startDate.ToString("yyyy-MM-dd"));request.AddParameter("end_date", endDate.ToString("yyyy-MM-dd"));request.AddParameter("api_key", apiKey);IRestResponse response = client.Execute(request);Building the Application for NEO Analysis
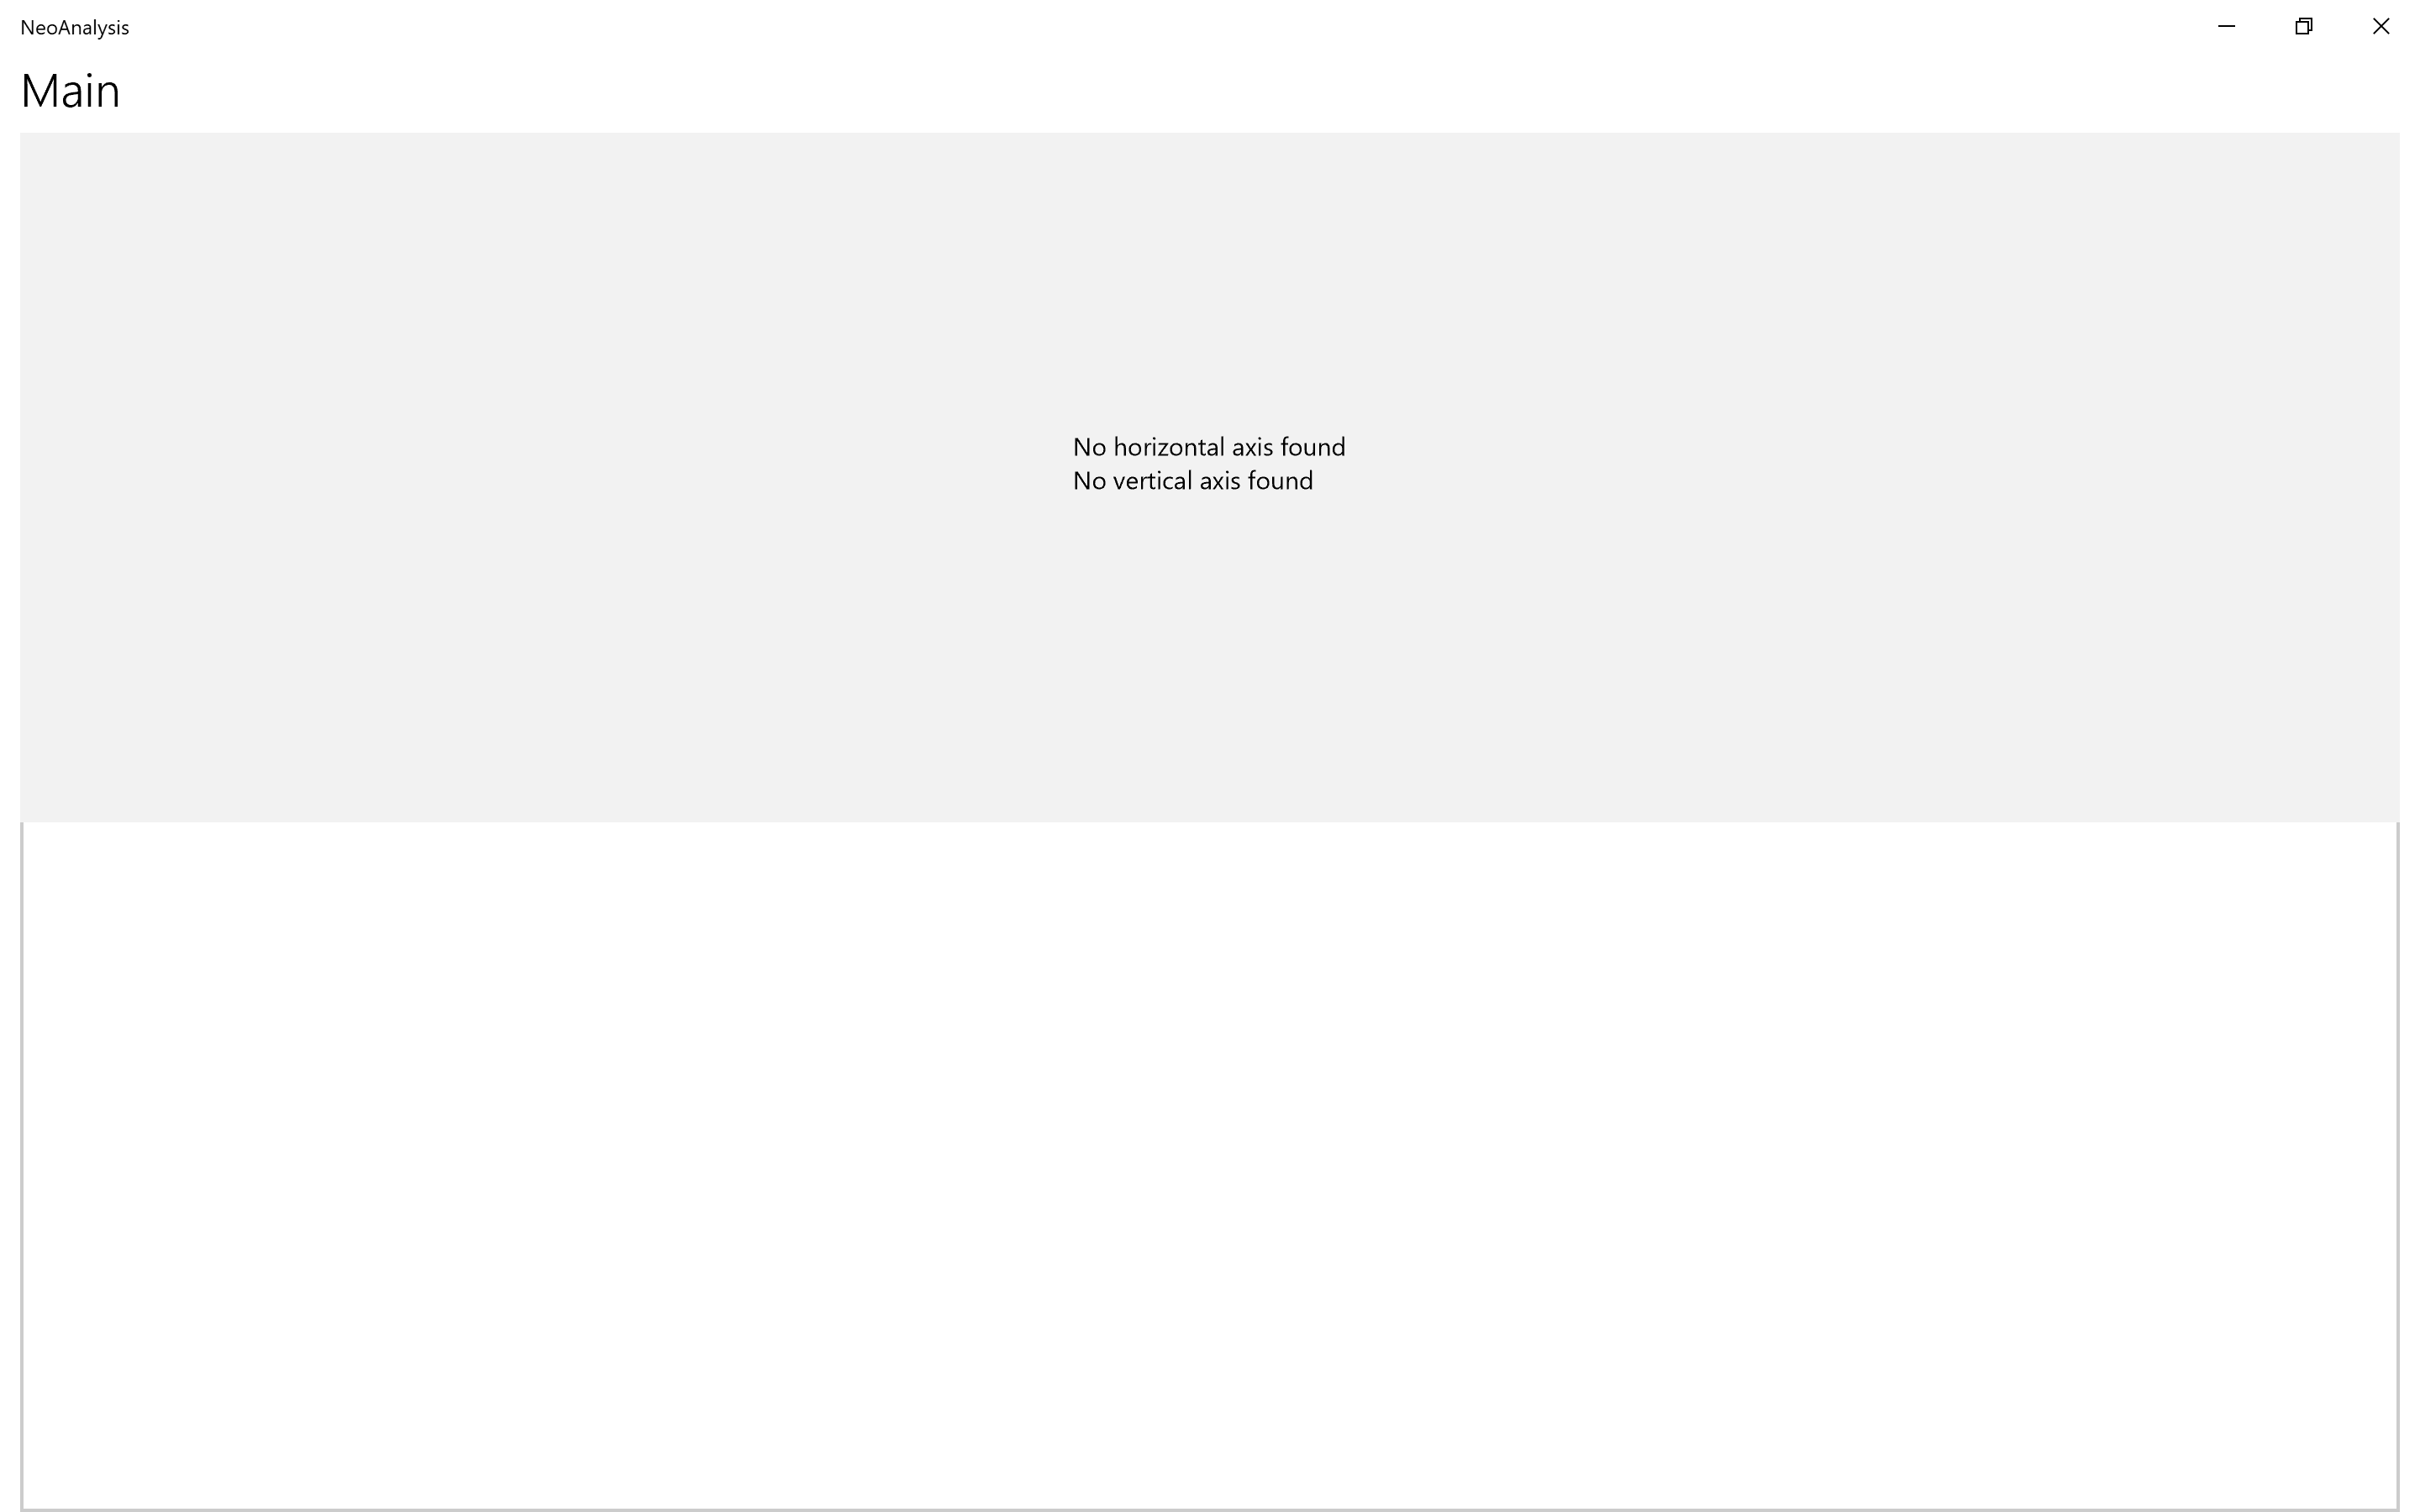
Now that I have the access to the data relating to NEOs, the next step is to display it to the user. I'll start by modifying the main page of my application to incorporate the Chart and Grid:
<Page .. xmlns:tc="using:Telerik.UI.Xaml.Controls.Chart" xmlns:tg="using:Telerik.UI.Xaml.Controls.Grid"> <Grid> <Grid.RowDefinitions> <RowDefinition Height="*" /> <RowDefinition Height="*" /> </Grid.RowDefinitions> <tc:RadCartesianChart x:Name="chart" Grid.Row="0"> <!-- to be defined --> </tc:RadCartesianChart> <tg:RadDataGrid x:Name="grid" Grid.Row="1"> <!-- to be defined --> </tg:RadDataGrid> </Grid></Page>Running this example displays my UWP application in the following state:
The next step is bind our controls to the underlying data for NEOs. I'll start by defining the columns of Grid:
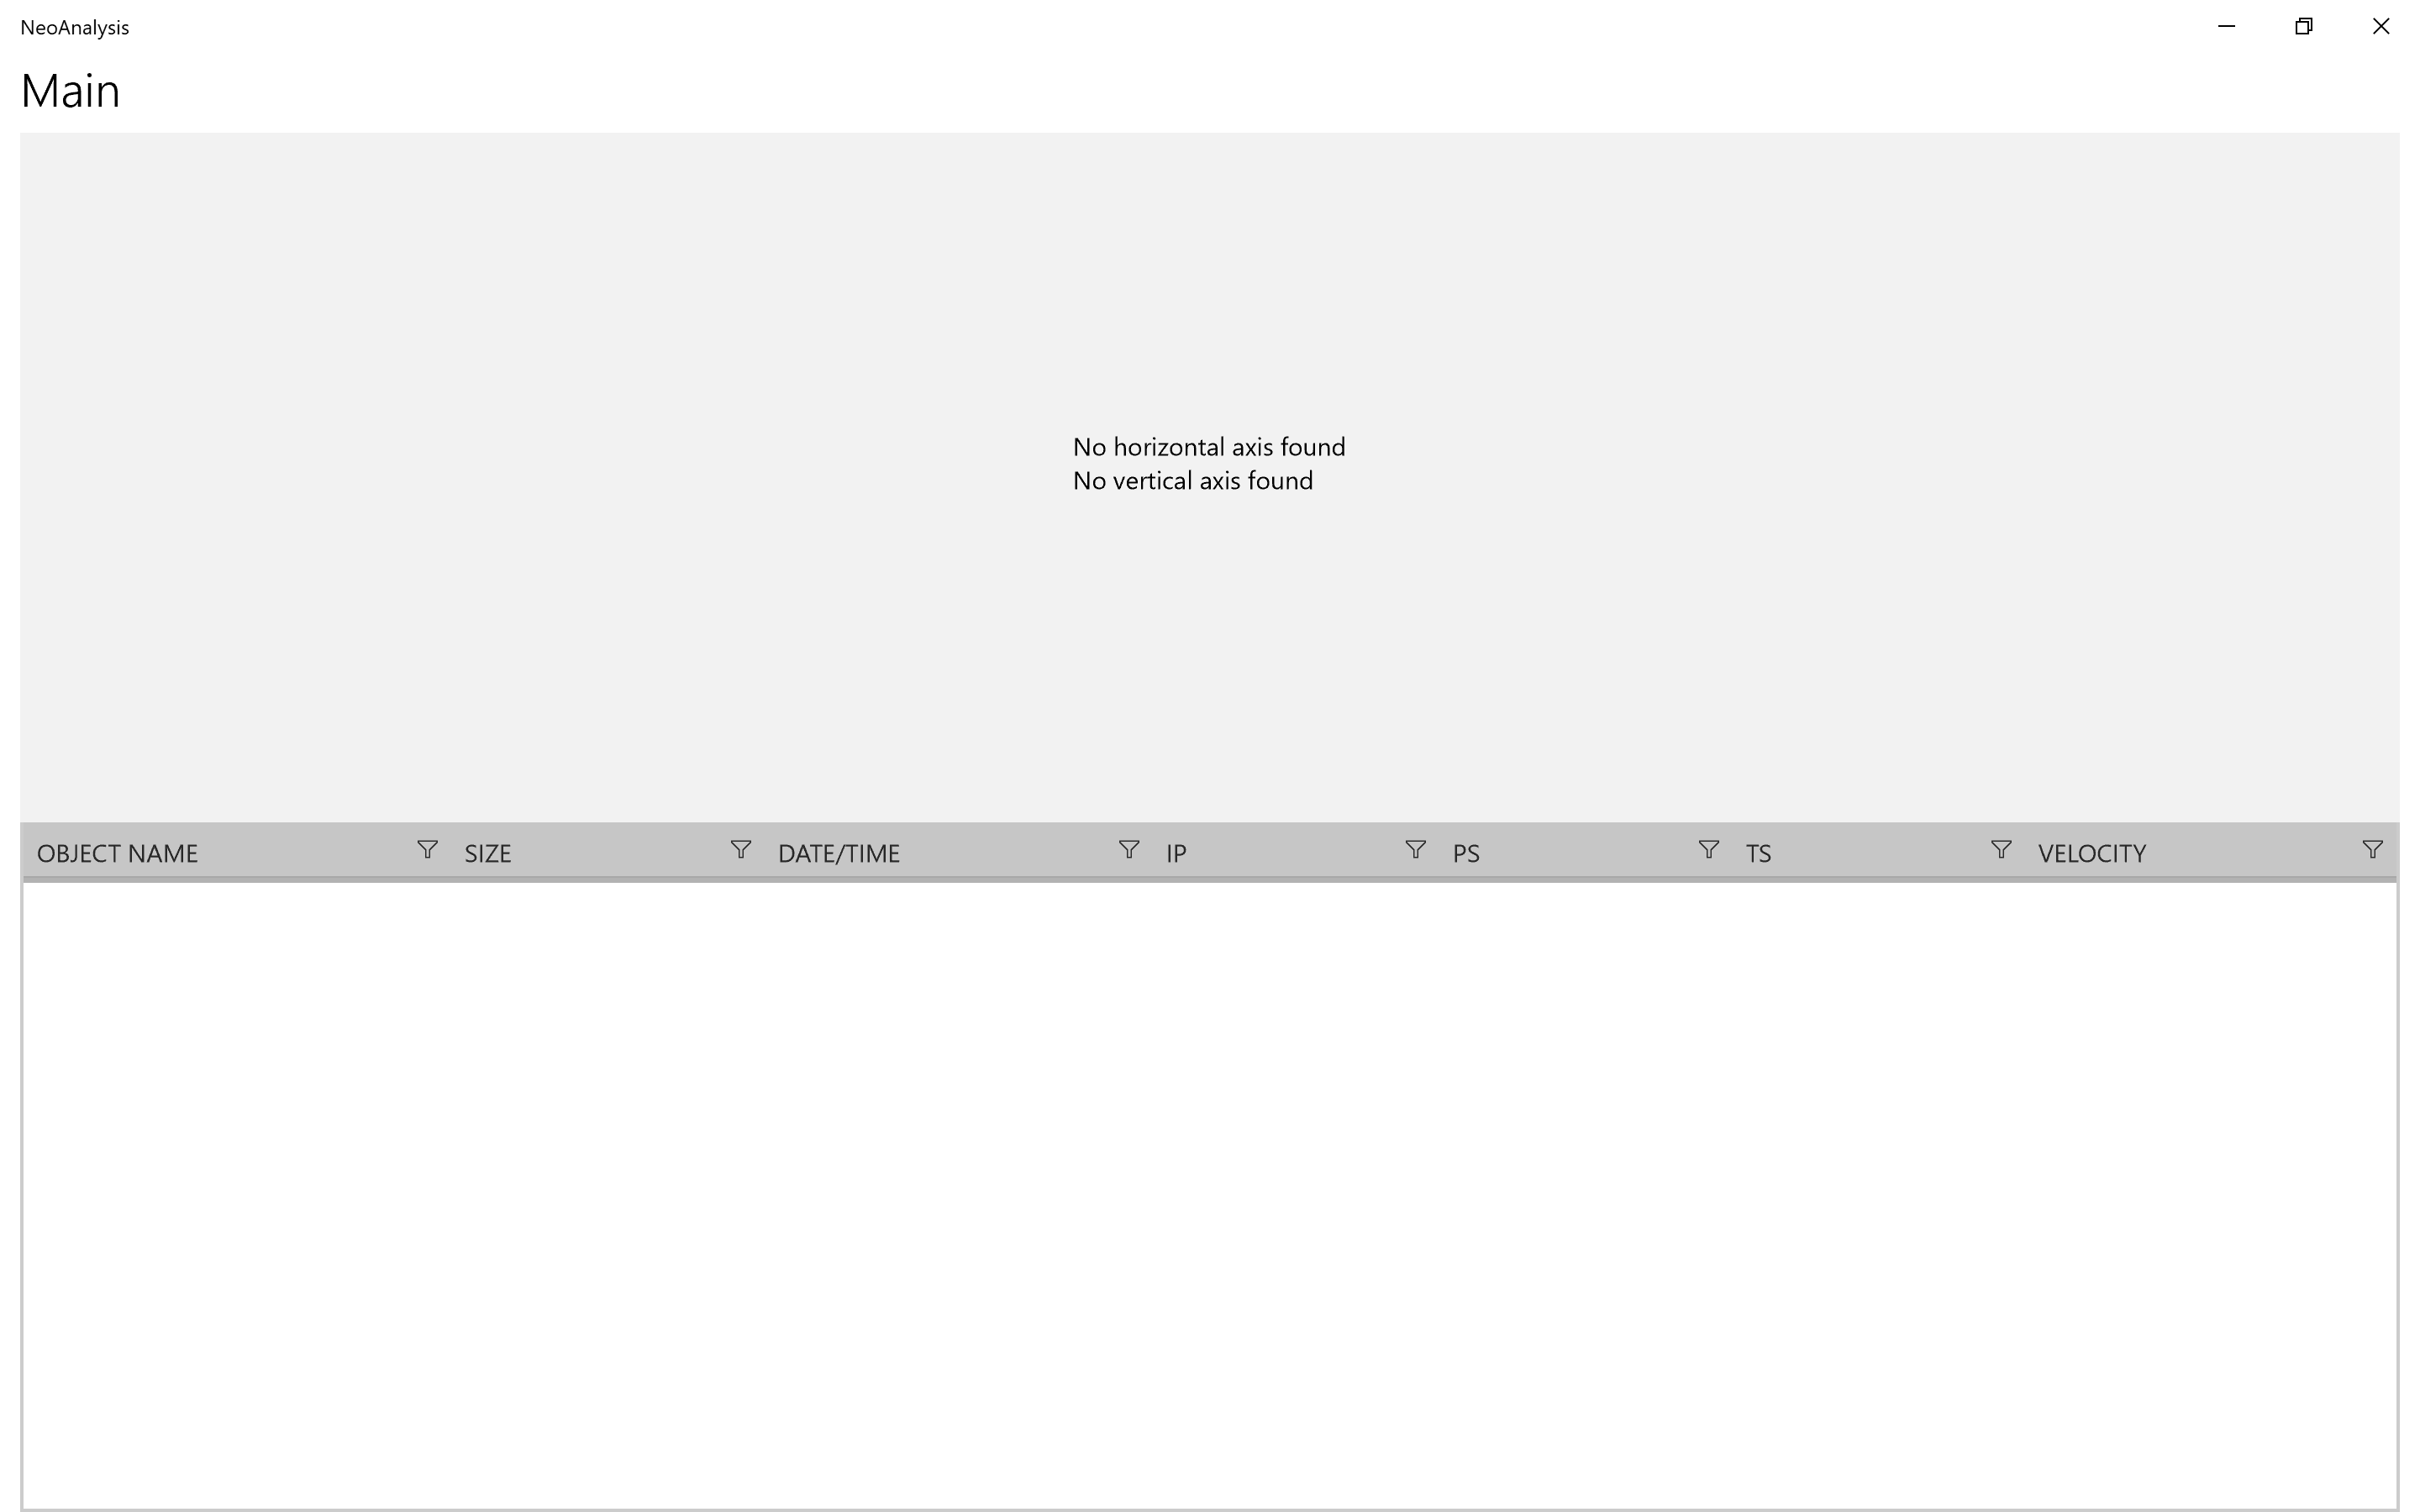
<Page .. xmlns:tc="using:Telerik.UI.Xaml.Controls.Chart" xmlns:tg="using:Telerik.UI.Xaml.Controls.Grid"> <Grid> <Grid.RowDefinitions> <RowDefinition Height="*" /> <RowDefinition Height="*" /> </Grid.RowDefinitions> <tc:RadCartesianChart x:Name="chart" Grid.Row="0"> <!-- to be defined --> </tc:RadCartesianChart> <tg:RadDataGrid x:Name="grid" Grid.Row="1"> <tg:RadDataGrid.Columns> <tg:DataGridTextColumn Header="OBJECT NAME" PropertyName="Name" /> <tg:DataGridNumericalColumn Header="SIZE" PropertyName="Size" /> <tg:DataGridDateColumn Header="DATE/TIME" PropertyName="CloseApproachDateTime" /> <tg:DataGridTextColumn Header="IP" PropertyName="IP" /> <tg:DataGridNumericalColumn Header="PS" PropertyName="PS" /> <tg:DataGridTextColumn Header="TS" PropertyName="TS" /> <tg:DataGridNumericalColumn Header="VELOCITY" PropertyName="Velocity" /> </tg:RadDataGrid.Columns> </tg:RadDataGrid> </Grid></Page>In this XAML markup, I've defined columns for the Grid to display following properties of the NEOs:
- Name: the designation assigned to the NEO (i.e. 1979 XB)
- Size: the estimated diameter (m) of the NEO
- Date/Time: the estimated date and time when the NEO is expected to be in close proximity to the Earth
- IP: the probability of the NEO impacting the Earth (impact probability)
- PS: value of Palermo Technical Impact Hazard Scale
- TS: value of Torino Scale
- Velocity: the estimated velocity (in km/h) of the NEO
Running this example displays an update to the user interface with the columns defined in the Grid:
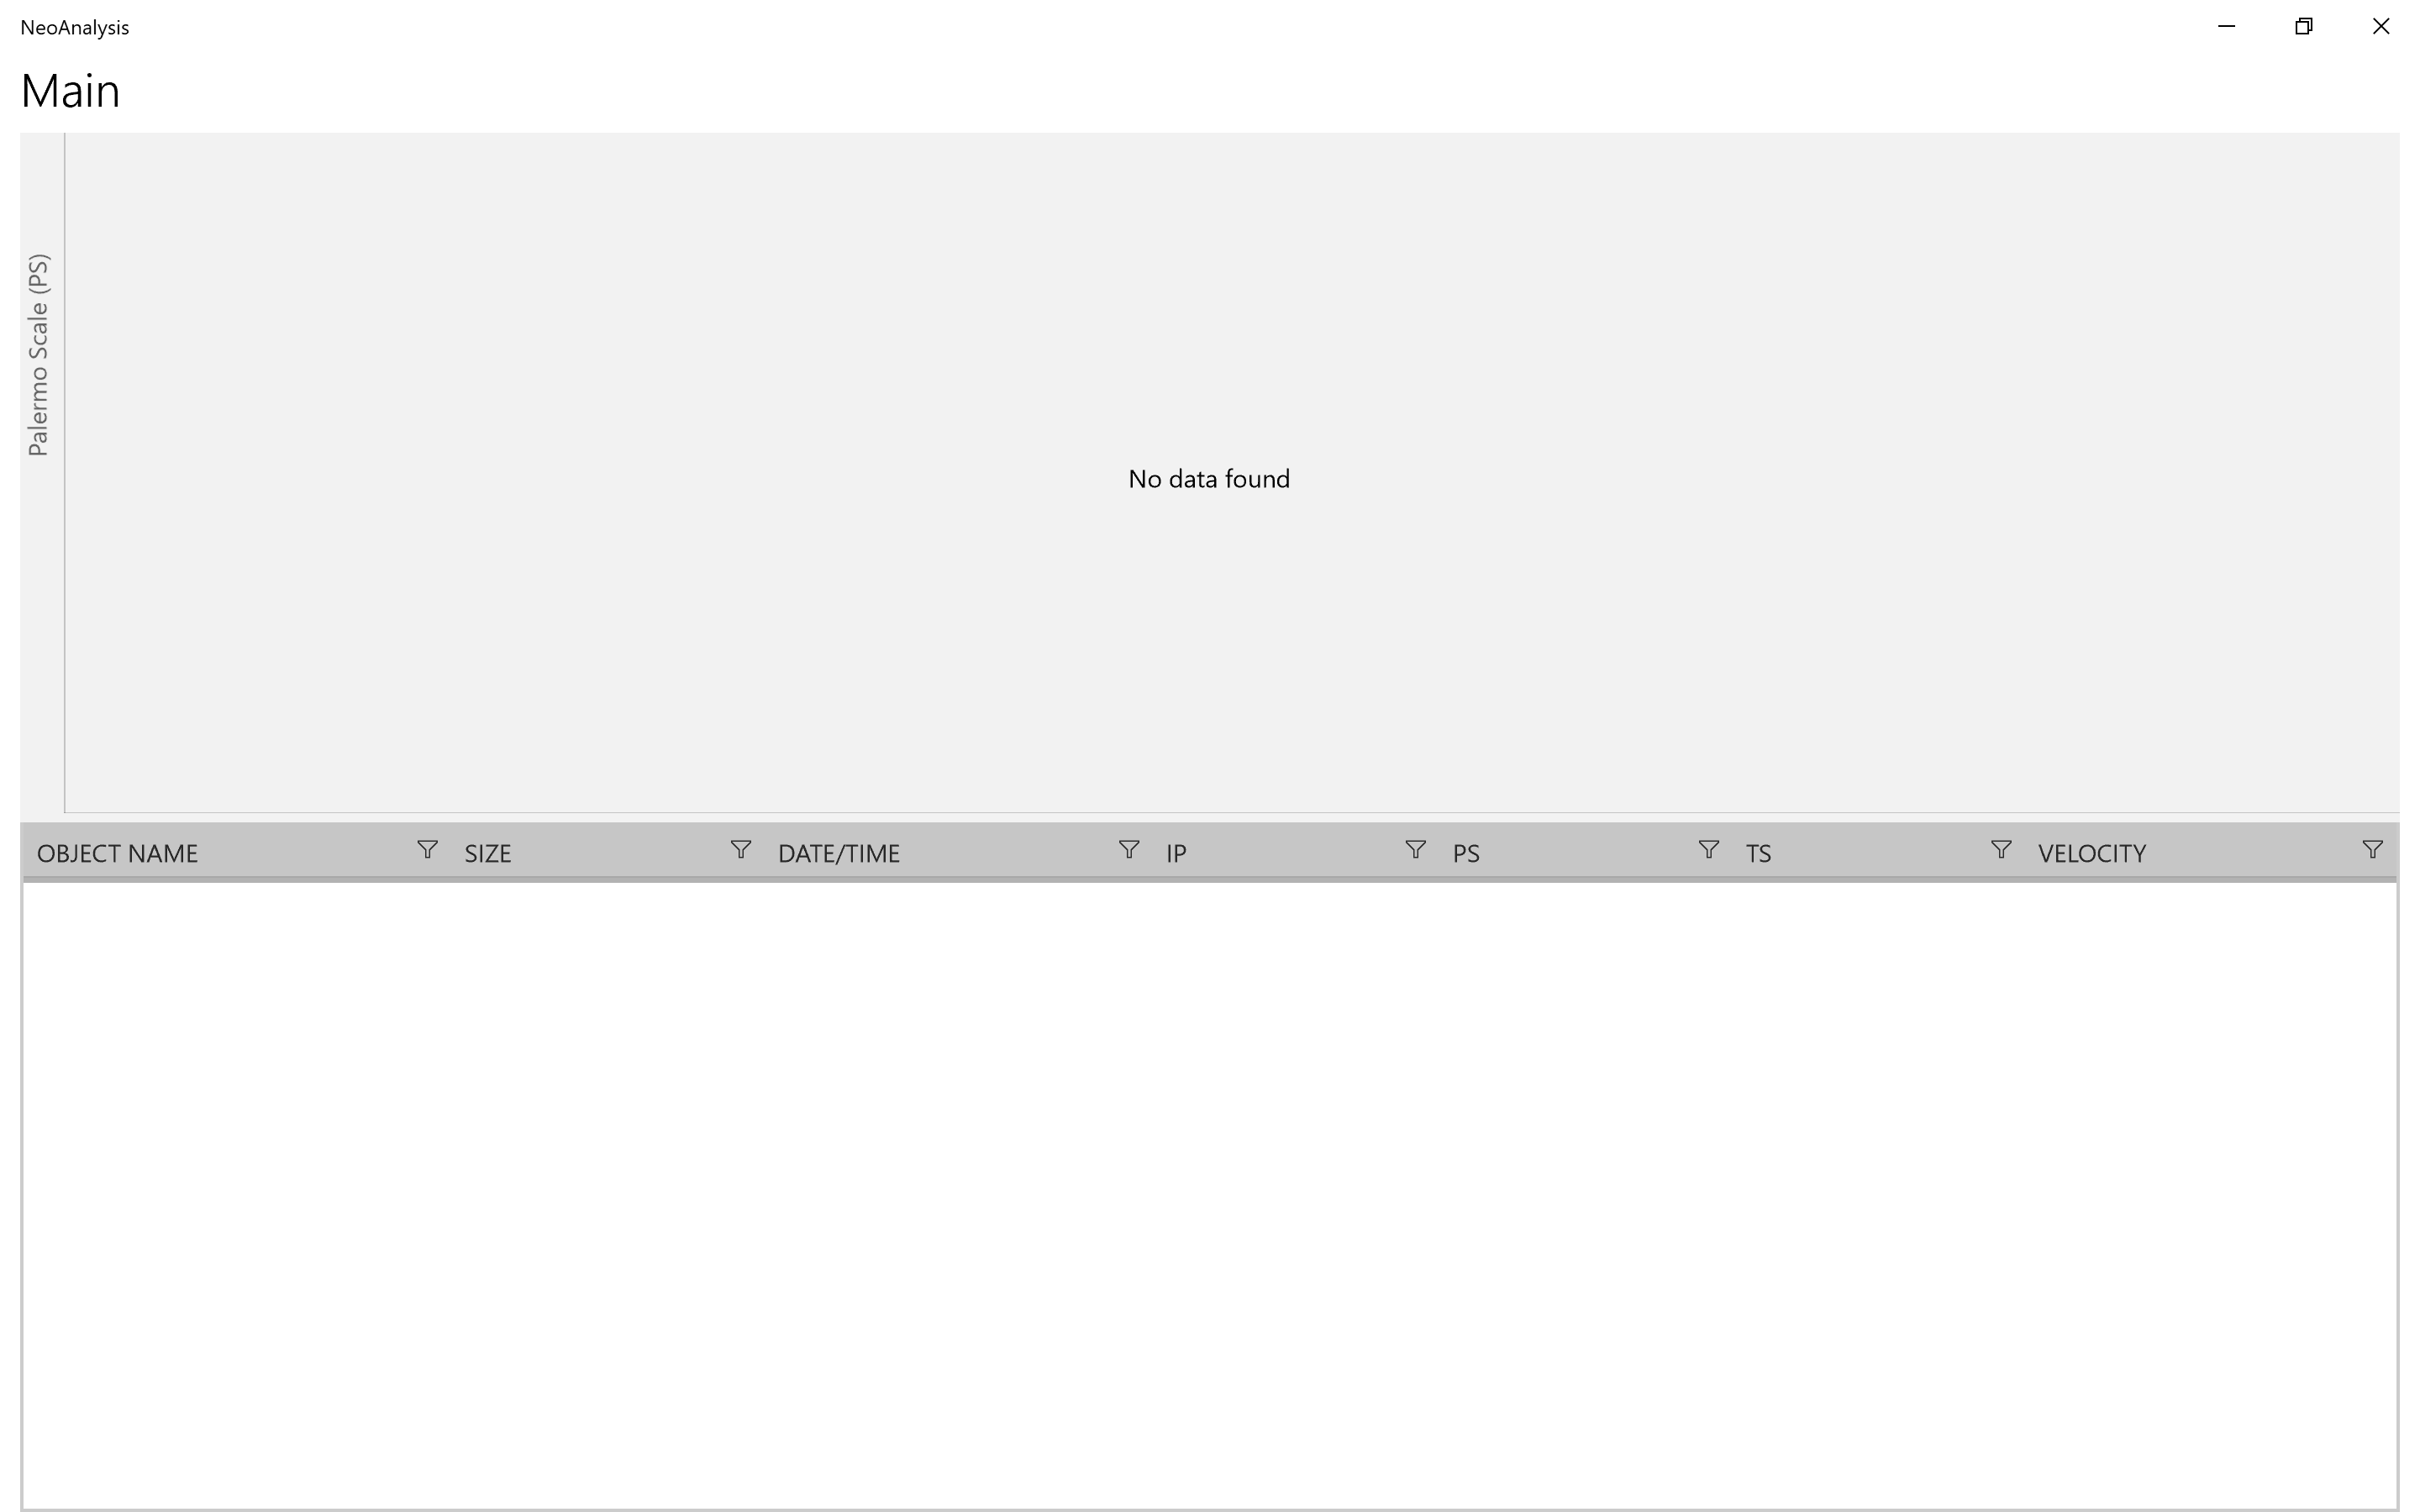
I'll update this example to define a point series for the Chart. This will be used to plot the NEOs against its value for Palermo Technical Impact Hazard Scale. Thus, any points plotted at or near the top of the Chart will be NEOs that we'll have to keep a close eye on!
<Page .. xmlns:tc="using:Telerik.UI.Xaml.Controls.Chart" xmlns:tg="using:Telerik.UI.Xaml.Controls.Grid"> <Grid> <Grid.RowDefinitions> <RowDefinition Height="*" /> <RowDefinition Height="*" /> </Grid.RowDefinitions> <tc:RadCartesianChart x:Name="chart" Grid.Row="0"> <tc:RadCartesianChart.VerticalAxis> <tc:LinearAxis Title="Palermo Scale (PS)" /> </tc:RadCartesianChart.VerticalAxis> <tc:RadCartesianChart.HorizontalAxis> <tc:DateTimeContinuousAxis LabelFormat="{}{0,0:yyyy}" MajorStep="10" /> </tc:RadCartesianChart.HorizontalAxis> <tc:RadCartesianChart.Grid> <tc:CartesianChartGrid MajorLinesVisibility="XY" /> </tc:RadCartesianChart.Grid> <tc:PointSeries ItemsSource="{Binding}"> <tc:PointSeries.CategoryBinding> <tc:PropertyNameDataPointBinding PropertyName="CloseApproachDateTime" /> </tc:PointSeries.CategoryBinding> <tc:PointSeries.ValueBinding> <tc:PropertyNameDataPointBinding PropertyName="PS" /> </tc:PointSeries.ValueBinding> </tc:PointSeries> </tc:RadCartesianChart> <tg:RadDataGrid x:Name="grid" Grid.Row="1"> <!-- removed for brevity --> </tg:RadDataGrid> </Grid></Page>Running this example isn't terrible useful since we haven't bound either control to our underlying data:
Bringing it All Together
I have one more thing left to do before I start analyzing the NEO-related data with Chart and Grid; I have to bind the underlying data to the controls. This is accomplished by populating the data context of the page with the data pertaining to NEOs. As I indicated earlier in this article, there are numerous sources available to find this data. For this example, I've created a local cache of the data from one such service in the form of a CSV file. I then used the popular libraryT CsvHelper to pull values out from this file and to populate an in-memory object collection representing the NEOs.
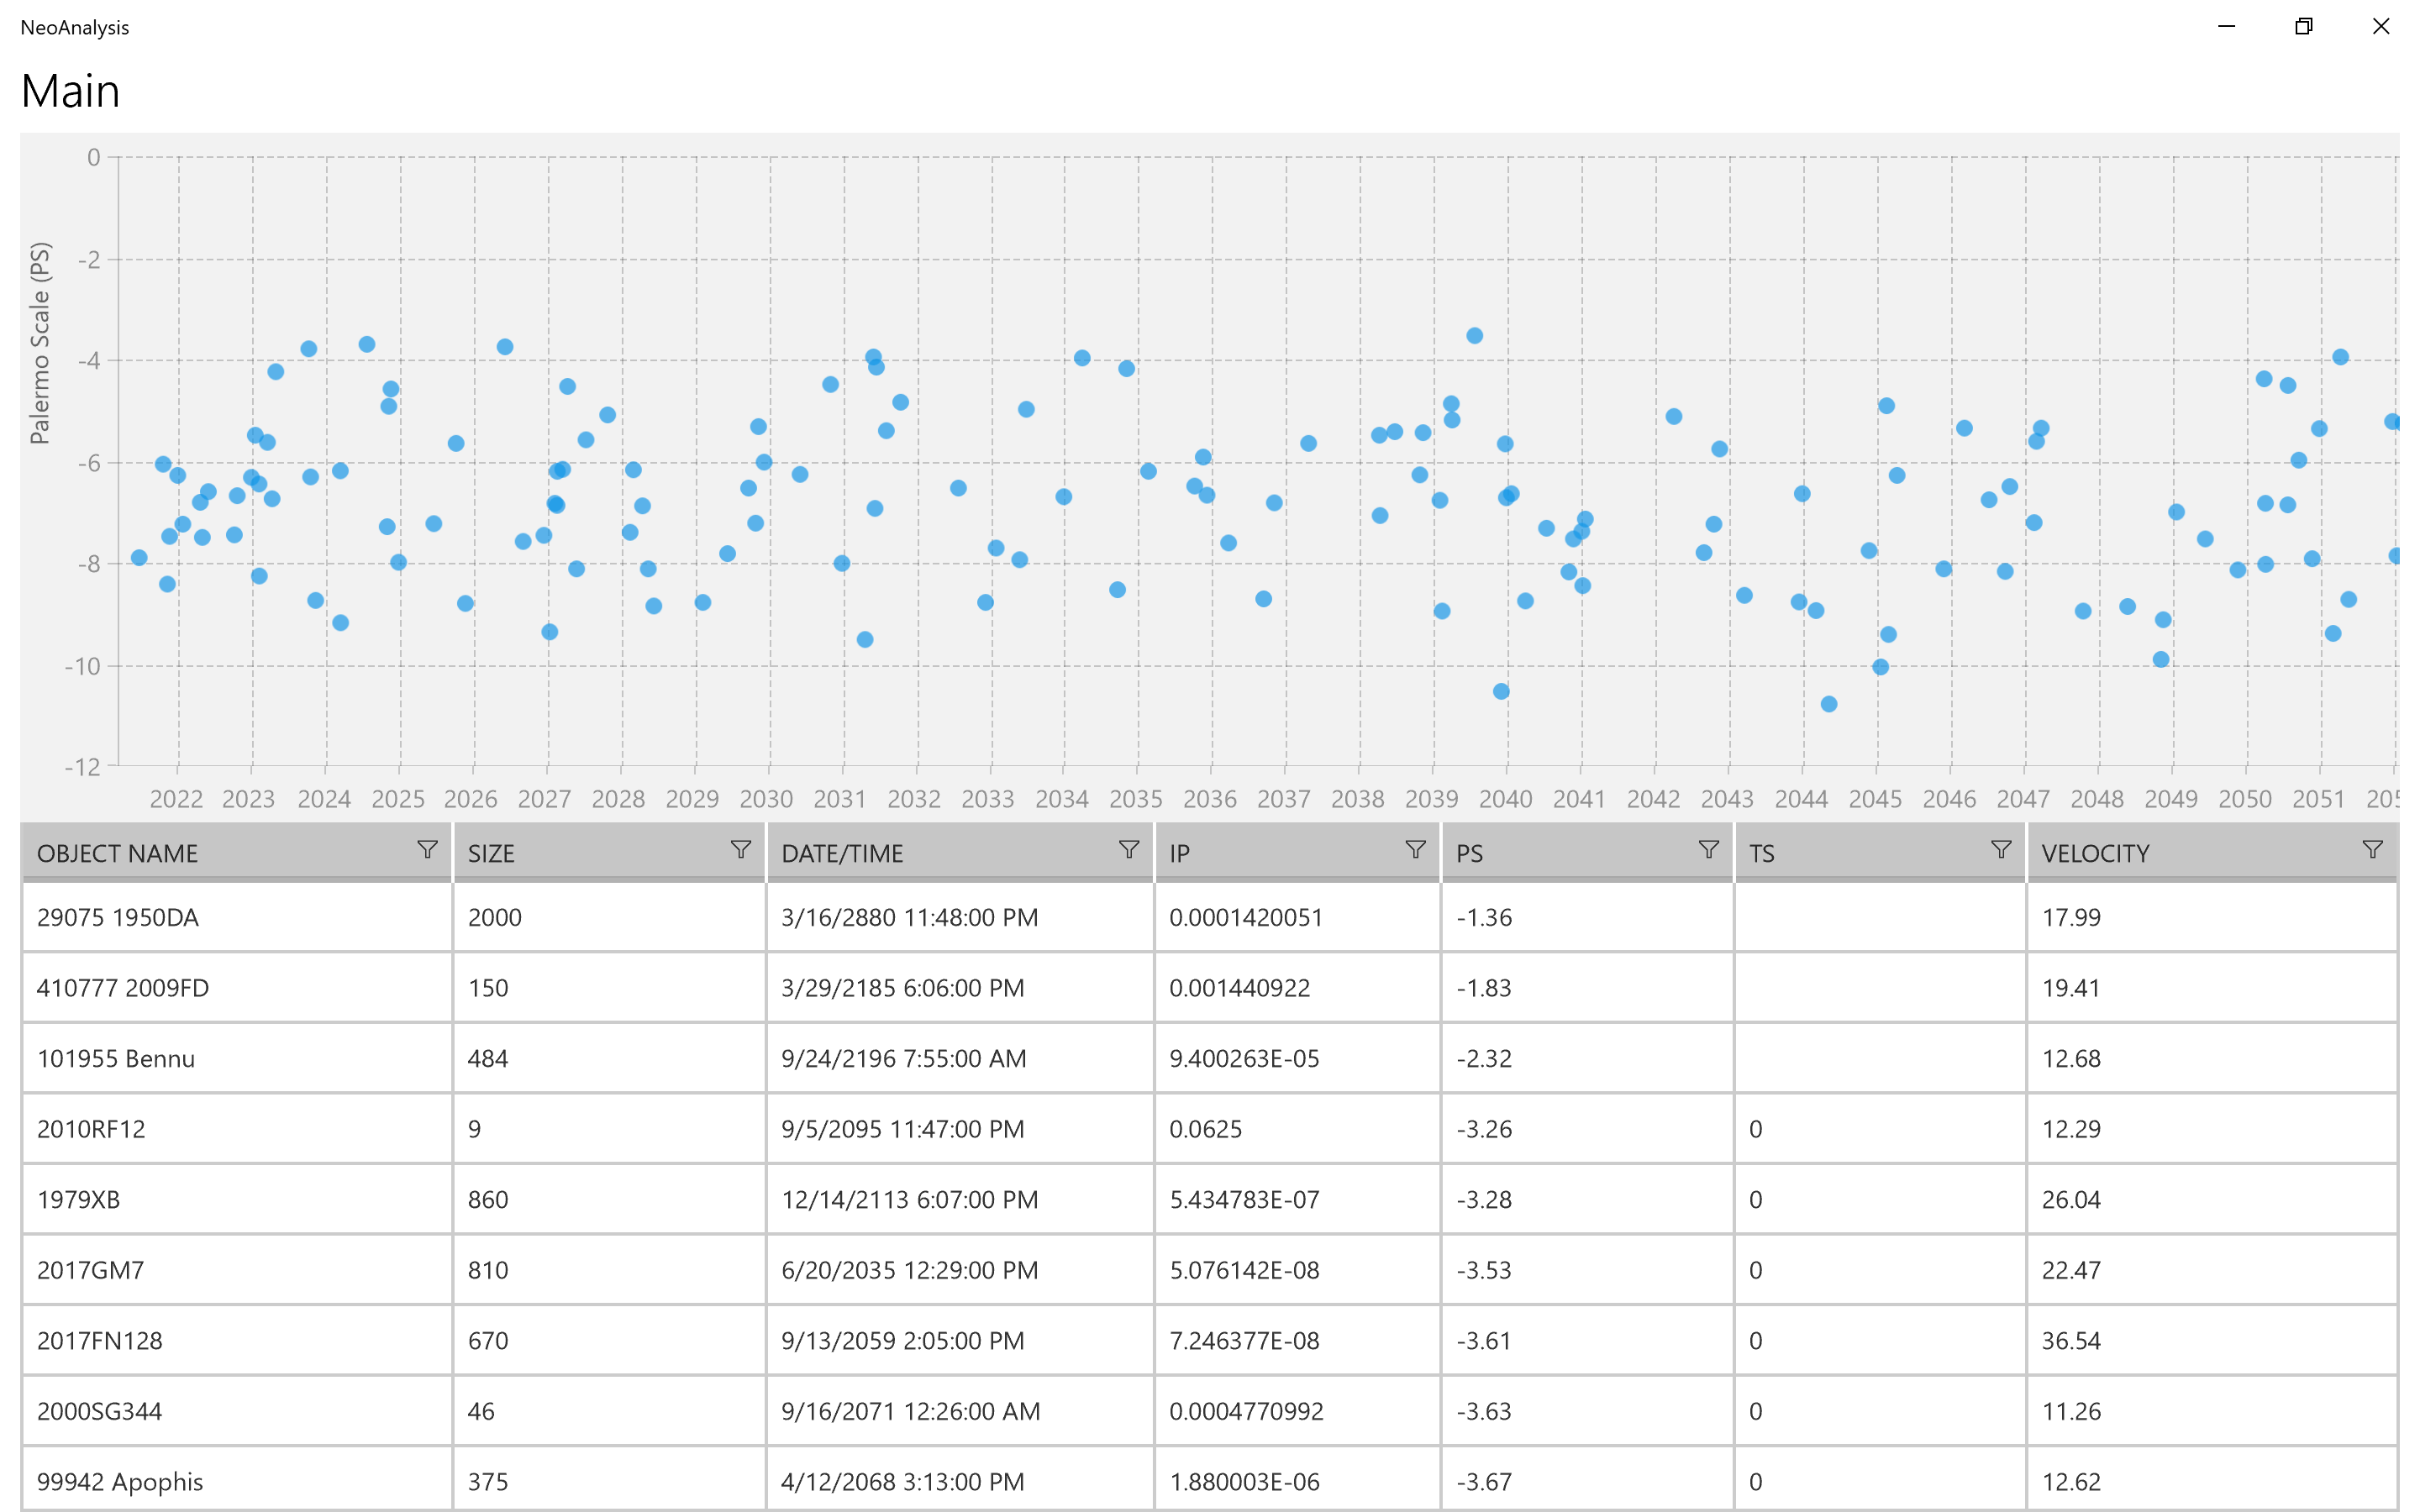
Here's what the application looks like with the data bound to the Chart and Grid on the main page:
The Chart has a number of built-in features that enable you to scroll and zoom through the data that's bound to it. Likewise, the Grid has a number of built-in features that enable you to filter and sort through thousands of items.
NEO Tracker at Microsoft Build 2017
If you attended Microsoft Build 2017 last year, you may have seen me build this application built on-stage with Nikola Metulev. You can watch a replay of the session in case you missed it:
The focus of our session was to demonstrate how to build custom controls for UWP. However, we felt very creative; we ended up building a lot more than we originally anticipated. (I love it when this happens!)
Next Steps
I'd strongly recommend that you check out the tools cited in this article to help you build UWP applications. Specifically, Windows Template Studio, the UWP Community Toolkit, and Telerik UI for UWP. Also, take a moment to check out Progress Test Studio for APIs. It's currently available as a Beta. We'd love for you to check it out!
If you're interested in learning more about UWP and the current state of .NET, please download our free whitepaper entitled, The State of .NET in 2018. It discusses the evolution of the .NET Framework (including UWP) and how its latest incarnation addresses the challenges presented by new cross-platform portable apps and the future-facing technologies developers are working on.

John Bristowe
John Bristowe is a member of the Developer Relations team at Progress. He specialises in web and mobile app development.