Format Dates
The way the ASP.NET AJAX Chart dates are shown on the axis labels, series labels and series tooltips are controlled via the DataFormatString property that must be set in the corresponding chart element as follows:
-
Series Labels and Series Tooltips - {0} and/or {1} placeholders are used to denote the corresponding SeriesItem's X and/or Y value in the DateFormatString followed by ":" and the desired date specifier(e.g.,
DataFormatString="{1} units are ordered on {0:d}"). -
Axis Labels - Only the desired date specifier must be set in the DateFormatString property,as placeholders are not applicable (e.g., DataFormatString="y").
Date formats can be used inside the Client Templates . You can find more information in the Formatting Numbers article, in the section, Formatting Labels and Tooltips by Using their Client Templates.
Table 1 lists standard date format specifiers with descriptions. Figure 1 shows formatting the d, m|M and D pattern while Example 1 shows the markup to create the figure.
Table 1: List of standard date format specifiers with descriptions.
| Format Specifier | Description | Pattern Equivalent (for en-US Culture) |
|---|---|---|
| d | short date pattern | M/d/yyyy (e.g., the date 11th of November 2000 will be formatted as "11/6/2000") |
| D | long date pattern | dddd, MMMM dd, yyyy (e.g., the date 11th of November 2000 will be formatted as "Monday, November 06, 2000") |
| F | full date/time pattern | dddd, MMMM dd, yyyy h:mm:ss tt (e.g., the date 11th of November 2000 will be formatted as "Monday, November 06, 2000 12:00:00 AM") |
| g | general date/time pattern (short time) | M/d/yyyy h:mm tt (e.g., the date 11th of November 2000 will be formatted as "11/6/2000 12:00 AM") |
| G | general date/time pattern (long time) | M/d/yyyy h:mm:ss tt (e.g., the date 11th of November 2000 will be formatted as "11/6/2000 12:00:00 AM") |
| m or M | month/day pattern | MMMM dd (e.g., the date 11th of November 2000 will be formatted as "November 06") |
| u | universal sortable date/time pattern | yyyy'-'MM'-'dd HH':'mm':'ss'Z' (e.g., the date 11th of November 2000 will be formatted as "2000-11-06 00:00:00Z") |
| y or Y | month/year pattern | MMMM, yyyy (e.g., the date 11th of November 2000 will be formatted as "November, 2000") |
Table 2 lists custom date format specifiers with descriptions. Figure 2 shows formatting the "MMM-yyyy", "ddd, MMM, yyyy" and "MMM yyyy" pattern while Example 2 shows the markup to create the figure.
Table 2: List of custom date format specifiers with descriptions.
| Format Specifier | Description |
|---|---|
| d | The day of the month from 1 to 31. |
| dd | The zero-padded day of the month from 01 to 31. |
| ddd | The abbreviated name of the day of the week. |
| dddd | The full name of the day of the week. |
| M | The month from 1 to 12. |
| MM | The zero-padded month from 01 to 12. |
| MMM | The abbreviated name of the month. |
| MMMM | The full name of the month. |
| yy | The year, from 00 to 99. |
| yyyy | The year as a four-digit number. |
| h | The hour, using 12-hour clock from 1 to 12. |
| hh | The zero-padded hour, using 12-hour clock from 01 to 12. |
| H | The hour, using 24-hour clock from 0 to 23. |
| HH | The zero-padded hour, using 24-hour clock from 00 to 23. |
| m | The minute from 0 to 59. |
| mm | The zero-padded minute from 00 to 59. |
| s | The second from 0 to 59. |
| ss | The zero-padded second from 00 to 59. |
| tt | The AM/PM designator. |
Figure 1: Formatting axis labels, series labels and series tooltip with standard format via the DateFormatString property.
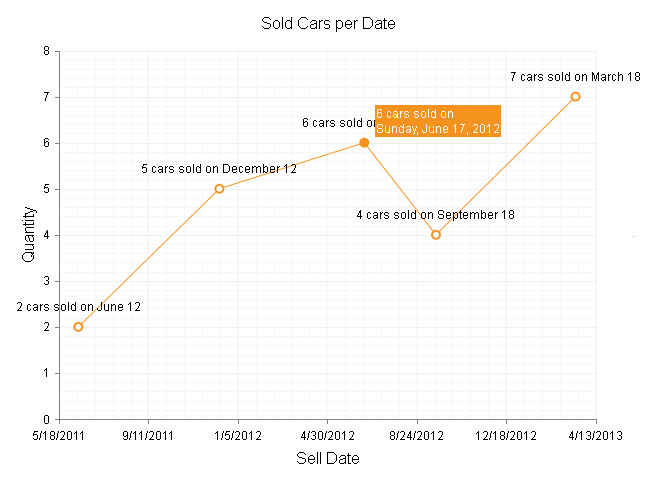
Example 1 shows the simple markup used to format the series labels, axis labels and series tooltip with standard format in Figure 1.
<telerik:RadHtmlChart runat="server" ID="RadHtmlChart1" Width="640px" Height="480px">
	<PlotArea>
		<Series>
			<telerik:ScatterLineSeries DataFieldY="SellQuantity" DataFieldX="SellDate">
				<LabelsAppearance DataFormatString="{1} cars sold on {0:m}">
				</LabelsAppearance>
				<TooltipsAppearance Color="White" DataFormatString="{1} cars sold on<br/>{0:D}" />
			</telerik:ScatterLineSeries>
		</Series>
		<XAxis BaseUnit="days">
			<TitleAppearance Text="Sell Date">
			</TitleAppearance>
			<LabelsAppearance DataFormatString="d">
			</LabelsAppearance>
			<MajorGridLines Color="#EFEFEF" Width="1"></MajorGridLines>
			<MinorGridLines Color="#F7F7F7" Width="1"></MinorGridLines>
		</XAxis>
		<YAxis>
			<TitleAppearance Text="Quantity">
			</TitleAppearance>
			<MajorGridLines Color="#EFEFEF" Width="1"></MajorGridLines>
			<MinorGridLines Color="#F7F7F7" Width="1"></MinorGridLines>
		</YAxis>
	</PlotArea>
	<ChartTitle Text="Sold Cars per Date">
	</ChartTitle>
</telerik:RadHtmlChart>Figure 2: Formatting axis labels, series labels and series tooltip with custom pattern via the DateFormatString property.
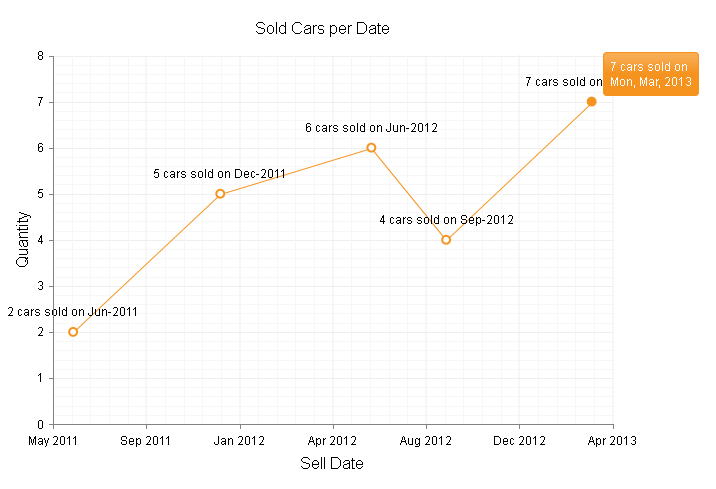
Example 2 shows the simple markup used to format the series labels, axis labels and series tooltip with custom pattern in Figure 2.
<telerik:RadHtmlChart runat="server" ID="RadHtmlChart1" Width="640px" Height="480px">
	<PlotArea>
		<Series>
			<telerik:ScatterLineSeries DataFieldY="SellQuantity" DataFieldX="SellDate">
				<LabelsAppearance DataFormatString="{1} cars sold on {0:MMM-yyyy}">
				</LabelsAppearance>
				<TooltipsAppearance Color="White" DataFormatString="{1} cars sold on<br/>{0:ddd, MMM, yyyy}" />
			</telerik:ScatterLineSeries>
		</Series>
		<XAxis BaseUnit="days">
			<TitleAppearance Text="Sell Date">
			</TitleAppearance>
			<LabelsAppearance DataFormatString="MMM yyyy">
			</LabelsAppearance>
			<MajorGridLines Color="#EFEFEF" Width="1"></MajorGridLines>
			<MinorGridLines Color="#F7F7F7" Width="1"></MinorGridLines>
		</XAxis>
		<YAxis>
			<TitleAppearance Text="Quantity">
			</TitleAppearance>
			<MajorGridLines Color="#EFEFEF" Width="1"></MajorGridLines>
			<MinorGridLines Color="#F7F7F7" Width="1"></MinorGridLines>
		</YAxis>
	</PlotArea>
	<ChartTitle Text="Sold Cars per Date">
	</ChartTitle>
</telerik:RadHtmlChart>The above dates are formatted in the default "en-US" culture. More information on how to localize text elements is available in the Localization article.