Localization
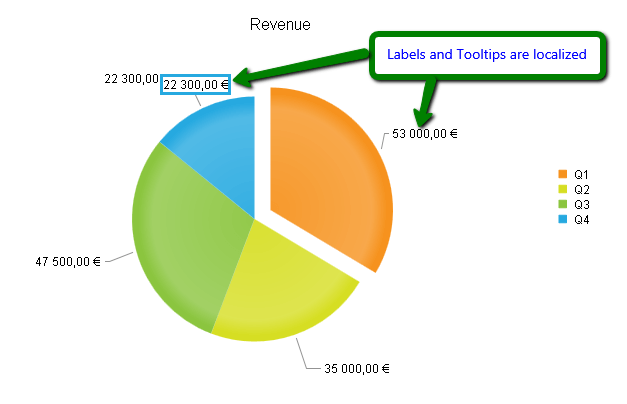
Telerik makes it easy to localize the ASP.NET AJAX Chart. Some chart elements have custom strings that you localize before you pass them to the control and some text can be localized by using the KendoUI framework. This Help article will show you how to use the KendoUI framework (Example 1) to create the localized PieSeries shown in Figure 1. RadHtmlChart can use KendoUI framework localizations and in order to set a certain culture,you should follow the steps that are listed here. Here is a summary of the steps:
-
Add a reference in your page to the desired culture file. You can find the KendoUI Culture files in the "js/cultures" folder located in the root of the archive. You can download KendoUI from the Download page of Your Telerik.com Account.
When using an external script the KendoUI culture script must be declared before setting the culture of the kendo object.
-
Set the desired culture through the kendo object.
-
Apply the desired numeric format either in the DataFormatString property or in the kendo.format() method when using templates. You can see an example on this regard in the Format Numbers help article.
- ChartTitle , XAxis.Title / YAxis.Title , Series.Names and text in categorical Axes' Items are custom strings that developers pass to the chart and are not localized by the control.
- Labels and tooltips of SeriesItems , and labels of numeric or date axes can be localized by the KendoUI framework.
Example of a Localized Chart
You can see in Example 1 and Figure 1, an example of a localized PieSeries RadHtmlChart.
Example 1: Use the KendoUI framework JavaScript culture files to localize the labels and tooltips of a Pie chart.
<form id="form1" runat="server">
	<script type="text/javascript" src="kendo/js/cultures/kendo.culture.fr-FR.min.js"></script>
	<script type="text/javascript">
		kendo.culture("fr-FR");
	</script>
	<!--Where "fr-FR" is the desired culture-->
	<asp:ScriptManager runat="server" ID="ScriptManager1">
	</asp:ScriptManager>
	<telerik:RadHtmlChart runat="server" ID="RadHtmlChart1" Height="400px" Width="400px">
		<PlotArea>
			<Series>
				<telerik:PieSeries>
					<SeriesItems>
						<telerik:PieSeriesItem Exploded="true" Y="53000" Name="Q1" />
						<telerik:PieSeriesItem Exploded="false" Y="35000" Name="Q2" />
						<telerik:PieSeriesItem Exploded="false" Y="47500" Name="Q3" />
						<telerik:PieSeriesItem Exploded="false" Y="22300" Name="Q4" />
					</SeriesItems>
					<LabelsAppearance DataFormatString="C">
					</LabelsAppearance>
					<TooltipsAppearance DataFormatString="C"></TooltipsAppearance>
				</telerik:PieSeries>
			</Series>
			<YAxis>
			</YAxis>
		</PlotArea>
		<ChartTitle Text="Revenue">
		</ChartTitle>
	</telerik:RadHtmlChart>
</form>
Figure 1: Localized labels and tooltips using the KendoUI framework.

Figure 1 shows a Pie chart localized from the default culture of the page: "en-US" to "fr-FR" culture.The format of the indicated labels and tooltips has been changed from $22,300.00 and $53,000.00 to 22 300,00 € and 53 000,00 €.