Gridlines
RadChart has been deprecated since Q3 2014 and is marked as obsolete as of the 2026 Q2 SP1 (v2026.2.708) release. This is the last release that includes the RadChart component — its source code will be removed from the assembly in the next release. We strongly recommend using RadHtmlChart, Telerik's modern client-side charting component. To transition from RadChart to RadHtmlChart, refer to the following migration articles:
Explore the RadHtmlChart documentation and online demos to determine how it fits your development needs.
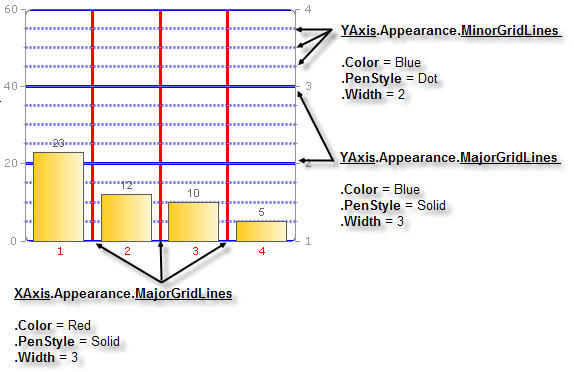
Gridlines are auxiliary lines that form a grid for easier reading of the chart. Gridlines can be vertical or horizontal. Vertical gridlines are controlled by the XAxis and horizontal gridlines are controlled by YAxis and YAxis2. Gridlines can be "major", e.g. falling on the labeled axis Step values."Minor" gridlines appear for YAxisand YAxis2 that fall between Step values. See the figure below where major gridlines fall on 20 and 40 of the YAxis and minor gridlines fall between the major gridlines.
To control the visibility and general appearance of gridlines use the the PlotArea.<axis>.Appearance property to reach MajorGridLines and MinorGridlines properties.XAxis has only MajorGridLines while YAxis have both MajorGridLines and MinorGridlines properties.Both major and minor gridline objects include the following properties:
-
Visible
-
Color
-
PenStyle (Solid, Dash, Dot, DashDot, DashDotDot and Custom)
-
Width
In the example below both X axis and Y axis are visible.XAxis MajorGridLines are red solid lines 3 pixels wide. YAxisMinorGridlines are shown as blue dotted lines 2 pixels wide and YAxisMajorGridLines are shown as blue solid lines 3 pixels wide.