Step-By-Step Skinning Example
RadChart has been deprecated since Q3 2014 and is marked as obsolete as of the 2026 Q2 SP1 (v2026.2.708) release. This is the last release that includes the RadChart component — its source code will be removed from the assembly in the next release. We strongly recommend using RadHtmlChart, Telerik's modern client-side charting component. To transition from RadChart to RadHtmlChart, refer to the following migration articles:
Explore the RadHtmlChart documentation and online demos to determine how it fits your development needs.
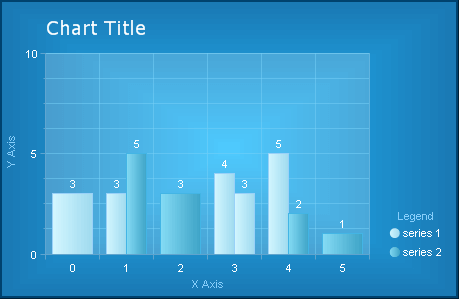
Here is a list of the steps one has to make in order to style RadChart to look like the image we used when describing the Chart elements. We start with a plain chart with no visual properties defined.
-
Styling the chart’s borders and background
-
Appearance -> Appearance -> Border -> Color : 0; 66; 110
-
Appearance -> Appearance -> Border -> Width : 5
-
Appearance -> Appearance -> FillStyle -> FillType : Gradient
-
Appearance -> Appearance -> FillStyle -> FillSettings -> GradientMode : Center
-
Appearance -> Appearance -> FillStyle -> MainColor : 35; 189; 254
-
Appearance -> Appearance -> FillStyle -> SecondColor : 26; 120; 179
-
Styling the title
-
Elements -> ChartTitle -> Appearance -> Border -> Visible : False
-
Elements -> ChartTitle -> Appearance -> FillStyle -> MainColor : None / Transparent
-
Elements -> ChartTitle -> TextBlock -> Appearance -> TextProperties -> Color : White
-
Elements -> ChartTitle -> TextBlock -> Appearance -> TextProperties -> Font : Verdana; 14pt
-
Elements -> ChartTitle -> Appearance ->Position -> AlignedPosition : TopLeft
-
Elements -> ChartTitle -> Appearance -> Dimensions -> Margins : 4%; 10px; 14px; 8%
-
Styling the legend
-
Elements -> Legend -> Appearance -> FillStyle -> MainColor : None / Transparent
-
Elements -> Legend -> Appearance -> Border -> Visible : False
-
Elements -> Legend -> Appearance -> ItemTextAppearance -> TextProperties -> Color : White
-
Elements -> Legend -> TextBlock -> Text : Legend
-
Elements -> Legend -> TextBlock -> Visible : True
-
Elements -> Legend -> TextBlock -> Appearance -> TextProperties -> Color : LightSkyBlue
-
Elements -> Legend -> TextBlock -> Appearance -> Position -> AlignedPosition : Top
-
Elements -> Legend -> Appearance -> Position -> AlignedPosition -> BottomRight
-
Elements -> Legend -> Appearance -> Dimensions -> Margins : 1px; 3%; 12%; 1px
-
Styling the plotarea
-
Elements -> PlotArea -> Appearance -> Border -> Color : 97; 180; 223
-
Elements -> PlotArea -> Appearance -> FillStyle -> MainColor : 50; 255; 255; 255
-
Elements -> PlotArea -> Appearance -> Dimensions -> Margins : 18%; 90px; 15%; 10%
-
Styling the X Axis
-
Elements -> PlotArea -> XAxis -> Appearance -> Color : 96; 164; 205
-
Elements -> PlotArea -> XAxis -> Appearance -> MajorGridLines -> Color : 120; 209; 248
-
Elements -> PlotArea -> XAxis -> Appearance -> MajorTick -> Color : 96; 164; 205
-
Elements -> PlotArea -> XAxis -> Appearance -> TextAppearance -> TextProperties -> Color : White
-
Elements -> PlotArea -> XAxis -> AxisLabel -> TextBlock -> Text -> X Axis
-
Elements -> PlotArea -> XAxis -> AxisLabel -> TextBlock -> Appearance -> TextProperties -> Color : LightSkyBlue
-
Elements -> PlotArea -> XAxis -> AxisLabel -> Appearance -> Dimensions -> Paddings : 1px; 1px; 10%; 1px
-
Styling the Y Axis
-
Elements -> PlotArea -> YAxis -> Appearance -> Color : 95; 165; 208
-
Elements -> PlotArea -> YAxis -> Appearance -> MajorGridLines -> Color : 120; 209; 248
-
Elements -> PlotArea -> YAxis -> Appearance -> MajorTick -> Color : 95; 165; 208
-
Elements -> PlotArea -> YAxis -> Appearance -> MajorGridLines -> Color : 120; 209; 248
-
Elements -> PlotArea -> YAxis -> Appearance -> MinorTick -> Color : 95; 165; 208
-
Elements -> PlotArea -> YAxis -> Appearance -> TextAppearance -> TextProperties -> Color : White
-
Elements -> PlotArea -> YAxis -> AxisLabel -> TextBlock -> Text -> Y Axis
-
Elements -> PlotArea -> YAxis -> AxisLabel -> TextBlock -> Appearance -> TextProperties -> Color : LightSkyBlue
-
Styling the data series
-
Data -> Series -> Series 1 -> Appearance -> Appearance -> Border -> Color : 153; 209; 248
-
Data -> Series -> Series 1 -> Appearance -> Appearance -> FillStyle -> MainColor : 213; 247; 255
-
Data -> Series -> Series 1 -> Appearance -> Appearance -> FillStyle -> SecondColor : 157; 217; 238
-
Data -> Series -> Series 1 -> Appearance -> Appearance -> TextAppearance -> TextProperties -> Color : White
-
Data -> Series -> Series 2 -> Appearance -> Appearance -> Border -> Color : 67; 181; 229
-
Data -> Series -> Series 2 -> Appearance -> Appearance -> FillStyle -> MainColor : 136; 221; 246
-
Data -> Series -> Series 2 -> Appearance -> Appearance -> FillStyle -> SecondColor : 59; 161; 197
-
Data -> Series -> Series 2 -> Appearance -> Appearance -> TextAppearance -> TextProperties -> Color : White