Marked Zones
RadChart has been deprecated since Q3 2014 and is marked as obsolete as of the 2026 Q2 SP1 (v2026.2.708) release. This is the last release that includes the RadChart component — its source code will be removed from the assembly in the next release. We strongly recommend using RadHtmlChart, Telerik's modern client-side charting component. To transition from RadChart to RadHtmlChart, refer to the following migration articles:
Explore the RadHtmlChart documentation and online demos to determine how it fits your development needs.
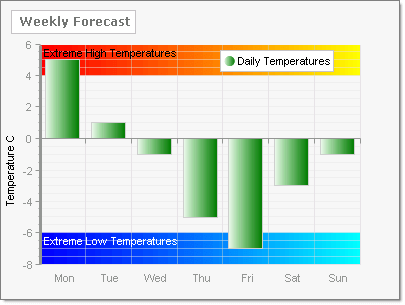
PlotArea MarkedZones are ranges that can be labeled and filled to highlight areas of the chart or to visually group data. The MarkedZones property by default display behind the chart series. You can create any number of members for the MarkedZones collection and each marked zone is defined by a starting and ending X and Y value pairs. You can also control the labelling and appearance for each zone independently.