Mastering the Map in Telerik UI for ASP.NET AJAX

Summarize with AI:
See how to use the Telerik UI for ASP.NET AJAX Map component to create a labeled map.
Progress Telerik is a shining example of quality. They consistently make high-quality components that make our web apps look better and work smarter. Progress Telerik UI for ASP.NET AJAX stands out among component libraries, giving us the best tools for creating dynamic and visually stunning web experiences.
Its components are sophisticated and reliable, with well-thought-out designs and robust functionality.

Image from Leonardo.ai
This post will look into the Map object for ASP.NET WebForms and analyze how to add labels to the map using custom data. We will use Kendo UI for jQuery in this sample.
Let’s Do It!
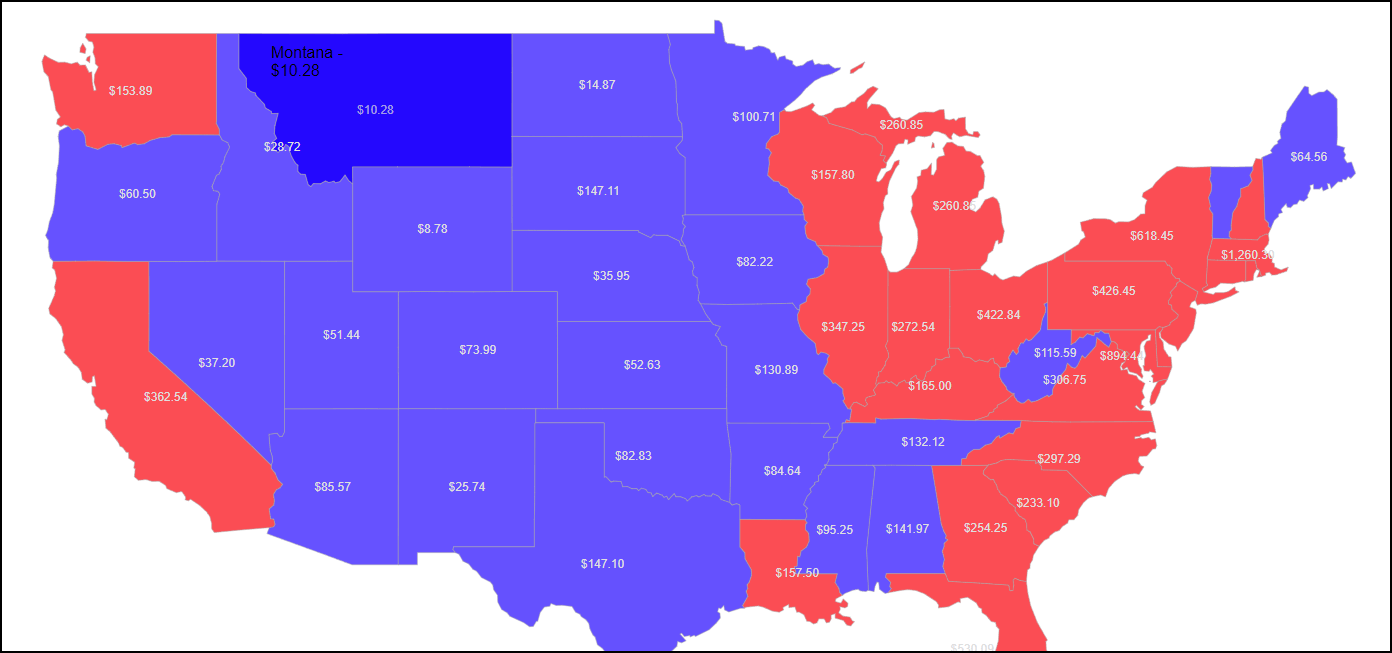
The map image below is the sample that we will demonstrate how to create.

RadMap image sample
We must configure the essential Telerik environment by adding the RadScriptManager, the RadMap component and the data source.
- Create a new WebForm.aspx file. Add the RadScriptManager and others inside the form element.
1.	<telerik:RadScriptManager LoadScriptsBeforeUI="true" ScriptMode="Release" EnableScriptCombine="false" ID="RadScriptManager1" runat="server" EnablePageMethods="true" EnableViewState="true" EnablePartialRendering="True" EnableScriptGlobalization="true" EnableTheming="True">
2.	     <Scripts>
3.	         <asp:ScriptReference Assembly="Telerik.Web.UI" Name="Telerik.Web.UI.Common.Core.js" />
4.	         <asp:ScriptReference Assembly="Telerik.Web.UI" Name="Telerik.Web.UI.Common.jQuery.js" />
5.	         <asp:ScriptReference Assembly="Telerik.Web.UI" Name="Telerik.Web.UI.Common.jQueryInclude.js" />
6.	     </Scripts>
7.	 </telerik:RadScriptManager>
- Add the RadMap component.
1.	<telerik:RadMap Height="1000px" ID="RadMap1" runat="server" Zoom="5" LayersDataSourceID="RadClientDataSource1">
2.	    <CenterSettings Latitude="43.2681" Longitude="-97.7448" />
3.	    <ClientEvents OnShapeCreated="onShapeCreated" OnShapeFeatureCreated="onShapeFeatureCreated"
4.	        OnShapeMouseEnter="onShapeMouseEnter" OnShapeMouseLeave="onShapeMouseLeave" />
5.	    <LayersCollection>
6.	        <telerik:MapLayer Type="Shape" ClientDataSourceID="RadClientDataSource1">
7.	            <StyleSettings>
8.	                <FillSettings Opacity= "0.7" />
9.	            </StyleSettings>
10.	        </telerik:MapLayer>
11.	    </LayersCollection>
12.	</telerik:RadMap>
We configure the ClientEvents we will use here and set the StyleSetting. We add an opacity of 0.7, so when we pass the mouse over, we change it to 1 to highlight the shape, like the state of Montana in the RadMap image sample.
- Add the RadClientDataSource component.
1.	<telerik:RadClientDataSource ID="RadClientDataSource1" runat="server">
2.	    <DataSource>
3.	        <WebServiceDataSourceSettings ServiceType="GeoJSON">
4.	            <Select Url="states.json" DataType="JSON" />
5.	        </WebServiceDataSourceSettings>
6.	    </DataSource>
7.	</telerik:RadClientDataSource>
In this code, the ServiceType= "GeoJSON" attribute of the WebServiceDataSourceSettings tag specifies the data format in which the web service is expected to return.
In this case, GeoJSON is a format for encoding various geographic data structures. It is built on JavaScript Object Notation (JSON), making it simple to work with in a web environment.
The Select Url="states.json" attribute specifies the URL for the web service. Tip: If you specify a URL outside your project, configure CORS.
The JavaScript for This RadMap
The state.json I provide in this sample has the density value for each U.S. state, but we can build our own data. For this sample, we created a const with values where the property name is the key:
1. const dataStates = [['Alabama', 141.972], ['Alaska', 1.896], ['Arizona', 85.57], ['Arkansas', 84.64], ['California', 362.54], ['Colorado', 73.99], ['Connecticut', 1108.65], ['Delaware', 696.45], ['District of Columbia', 15097.5], ['Florida', 530.09], ['Georgia', 254.25], ['Hawaii', 321.15], ['Hawaii', 321.15], ['Idaho', 28.72], ['Illinois', 347.25], ['Indiana', 272.54], ['Iowa', 82.215], ['Kansas', 52.63], ['Kentucky', 165], ['Louisiana', 157.5], ['Maine', 64.56], ['Maryland', 894.44], ['Maryland', 894.44], ['Massachusetts', 1260.30], ['Michigan', 260.85], ['Michigan', 260.85], ['Michigan', 260.85], ['Michigan', 260.85], ['Minnesota', 100.71], ['Mississippi', 95.25], ['Missouri', 130.89], ['Montana', 10.28], ['Nebraska', 35.95], ['Nevada', 37.2], ['New Hampshire', 220.5], ['New Jersey', 1783.5], ['New Mexico', 25.74], ['New York', 618.45], ['North Carolina', 297.29], ['North Dakota', 14.874], ['Ohio', 422.84], ['Oklahoma', 82.83], ['Oregon', 60.495], ['Pennsylvania', 426.45], ['Rhode Island', 1509], ['South Carolina', 233.10], ['South Dakota', 147.105], ['Tennessee', 132.12], ['Texas', 147.10], ['Utah', 51.44], ['Vermont', 1dw01.595], ['Virginia', 306.75], ['Virginia', 306.75], ['Virginia', 306.75], ['Washington', 153.89], ['Washington', 153.89], ['Washington', 153.89], ['West Virginia', 115.59], ['Wisconsin', 157.8], ['Wyoming', 8.7765], ['Puerto Rico', 16]];
For your implementation, this data can be in the state.json or you can build it yourself and load it from an endpoint.
Creating the Labels
On the client event onShapeCreated, we can create the bbox on the shape to hold the values we’d like to display.
1.	function onShapeCreated(e) {
2.
3.	var shape = e.shape;
4.	var key = shape.dataItem.properties.name;
5.	var valueArray = dataStates.find(function (item) {
6.	    if (item[0] === key) return item;
7.	});
8.
9.	var customValue = parseFloat(valueArray[1]);
10.
11.	if (customValue > 150) {
12.	    shape.options.fill.set("color", "red"); // Red for values greater than 150
13.	} else {
14.	    shape.options.fill.set("color", "blue"); // Green otherwise
15.	}
16.
17.	var bbox = e.shape.bbox(); // Get the "box" of each of the states
18.
19.	if (bbox.width() <= PMinWidthToDisplayLabel) {
20.	    return;
21.	}
22.
23.	var options = { style: ‘currency’, currency: ‘USD’ };
24.	var labelText = customValue.toLocaleString('en-US', options);
25.	var center = bbox.center(); // We need the center to  display the label exactly on it later.
26.	var label = new kendo.drawing.Text(labelText);
27.	label.options.fill.color = "#DEDEDE"; // Set the color
28.	var labelCenter = label.bbox().center();
29.
30.	label.position([ // Position the label
31.	    center.x - labelCenter.x,
32.	    center.y - labelCenter.y
33.	]);
34.
35.	e.layer.surface.draw(label); // Render the label on the layer surface
36.
37.	}
In line 4, we read the value from state.json for the current shape, shape.dataItem.properties.name, which is used as the key value for the dataStates var.
In line 11, we use an arbitrary value to change the shape’s colors. In this case, I choose 150.
In line 17, we create the object box to hold the label.
In line 19, we display the label using another arbitrary value. This is useful to avoid repeating the values in the islands of Alaska.
In lines 23 and 24, we transform the data into currency value.
From lines 26 to 27, we customize the content. In line 30, we centralize the position of the label. In line 35, we add the label to the layer.
Adding the Tooltip Content
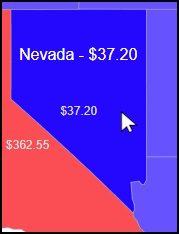
We can add custom pieces of information on the tooltip when the mouse is over it.
The below image demonstrates what it looks like.

Mouse over Nevada
Here is the event onShapeFeatureCreated for the tooltip on the shape:
1.	function onShapeFeatureCreated(e) {
2.
3.	    var key = e.properties.name;
4.	    var valueArray = dataStates.find(function (item) {
5.	        if (item[0] === key) return item;
6.	    });
7.
8.	    var customValue = parseFloat(valueArray[1]);
9.
10.	    var options = { style: ‘currency’, currency: ‘USD’ };
11.	    var tooltipText = customValue.toLocaleString('en-US', options);
12.
13.	    e.group.options.tooltip = {
14.	        content: e.properties.name + " - " + tooltipText,
15.	        position: “cursor”,
16.	        offset: 10,
17.	        width: 120
18.	    };
19.	}
In line 3, we retrieve the key. In line 4, we get the value.
Tip: If your JSON already has a property to display, load it from
e.properties.MyCustomValueInJson, whereMyCustomValueInJsonis your property name.
In line 14, we pass the content for the tooltip.
Conclusion
Telerik UI for ASP.NET AJAX powered with Kendo UI for jQuery gives us a strong and dependable set of parts for making dynamic and visually stunning web experiences. This post showed how to use the Map object to add labels to a map based on custom data. We learned how to set up the Telerik environment, add the RadMap component and connect to a data source. We’ve also looked at how to make labels and give the tooltip our own information. With these tools and methods, developers can create rich and interactive maps for our web apps.
Download a Telerik DevCraft trial now. Even during the trial, you can call Progress support or contact me on LinkedIn to exchange ideas; I speak English and Portuguese.
References
- Source code
- Search the web for a GeoJSON that matches your requirements: https://www.bing.com/search?&q=download+GeoJSON
- Learn about GeoJSON: https://geojson.org/
Don’t forget: Telerik UI for ASP.NET AJAX comes with a free 30-day trial. Better yet, try the Telerik DevCraft bundle for free to see what other .NET or JavaScript component libraries plus reporting, testing and debugging tools Progress has to offer.

Jefferson S. Motta
Jefferson S. Motta is a senior software developer, IT consultant and system analyst from Brazil, developing in the .NET platform since 2011. Creator of www.Advocati.NET, since 1997, a CRM for Brazilian Law Firms. He enjoys being with family and petting his cats in his free time. You can follow him on LinkedIn and GitHub.

