5 Reasons Not to Create Your JavaScript Data Grid from Scratch

Data grids (sometimes referred to as data tables) are an essential part of many business applications, and the task to create them can be monumental. Learn about the pitfalls of rolling your own grid, as noted by our engineering teams and the many we have met in the field.
Of the many awesome things JavaScript (React, Angular, Vue... ) developers can create in their apps, most are really enjoyable, some will give you a bit of a headache but also satisfaction in the end, and a handful should be labeled, “Here be dragons.” I’d argue that the data grid component (also referred to as a “table”) falls into the latter category.

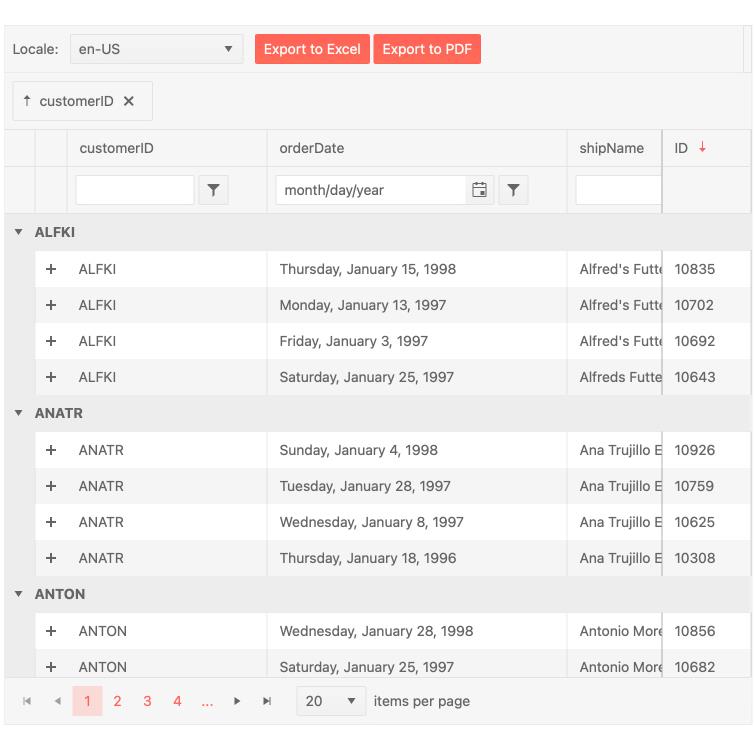
A JavaScript data grid implementation with multiple features: paging, filtering, grouping, localization, sticky (frozen) columns and export to PDF & Excel.
Based on five exciting years of experience in the UI components space, I have an urgent request: Don’t set out to write your own JavaScript data grid! I know it sounds like a fun, challenging project that would be great for your résumé, but unless this table is just a list of items with a single functionality (e.g. filtering), you are getting into uncharted waters. Things may get rough faster than you can imagine.
I know writing a grid may be one of your goals as a developer. But before you do, take a few minutes to scan these five hard truths I’ve learned from the Kendo UI engineering teams (people who have written data grids for various frameworks to satisfy customer requirements) and from our users (developers who have run into these icebergs in the field).
1. It’s a Black Hole!
Unless you’re working with the most disciplined client/manager, what started as a requirement to implement a simple grid with basic paging and filtering functionality is rarely going to end there. On a very simple note, you will need to add buttons and possibly a dropdown just to enable paging.
And with every additional feature requested, the complexity of your data grid component grows exponentially. Ah, sorting and editing would make the grid so much more convenient, though. And now that we have so much data, grouping is simply a must-have. Did we mention the whole app needs to be responsive as half our users browse through mobile devices?
Suddenly managing your JavaScript grid’s expanding functionality and mix-and-match external libraries you’ve integrated along the way to save time is becoming a riddle wrapped in an enigma. And that’s without even considering maintenance yet – to which we’ll dedicate a separate section.
“We tried rolling our own grid and, as scope creeped, implementation and maintenance costs shot up. The client was far from satisfied with the originally requested feature set.” – This is a sentiment that echoes in many conversations we have with developers.
In summary, before you set out to build a JavaScript data grid from the ground up, ask yourself this hypothetical, but all-too-real question: “Would you drop all your other responsibilities to build and maintain a single component?”
2. The Grid Is a Façade for Multiple UI Components and Features
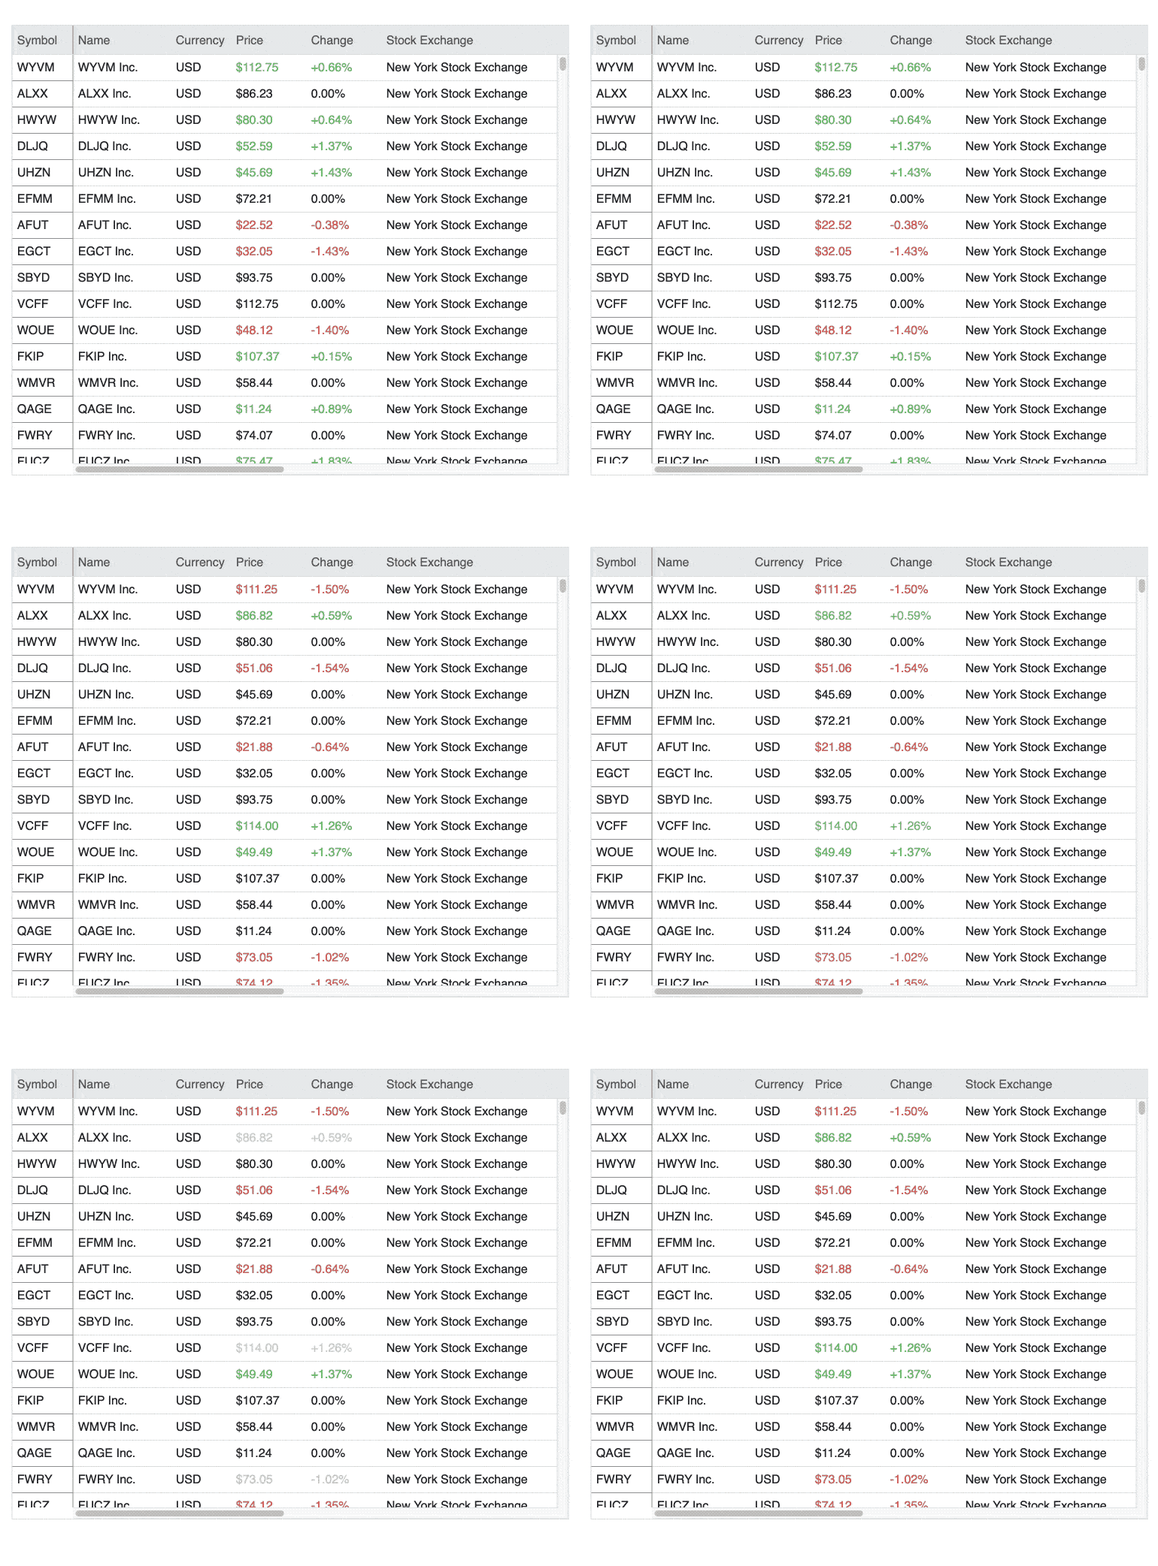
What your end users see as a humble table, on the flip side can really be a long list of different components and functionality. A long list with teeth. At first, adding a button here or regular textbox there isn’t so bad. It may even be fun! But hold on, the user just requested to be able to edit a date. Have you ever tried to implement your own datepicker component? That request alone can set you back a couple of weeks. Same with a feature such as the ability to live update cells, or the ability to export a grid’s contents to an Excel spreadsheet, which I know—from experience—that users ask for all the time. To get an idea what such a feature entails, check out this real-time data loading implementation in a sample app built with the Kendo UI for Angular Data Grid.
What’s more, integrating buttons, dropdowns, context menus and various input elements into your JavaScript data table can feel like trying to fit a square peg into a round hole if you’re using different libraries for each of these components. Compatibility between your disparate pieces of code/packages is not the only concern here—if your grid has a date input, you may need to add internationalization and localization when users are spread geographically. This needs to be applied to all the building blocks that comprise your grid, which can be very challenging when applied after the fact.
Accessibility compliance is a whole other ball game, as meeting accessibility guidelines will require first reading the various specs, interpreting them for your specific use case and only then implementing them in a complex component such as your Excel-like grid. What we noted about i18n above also applies here: If you weren’t thinking about accessibility from the beginning, you may find yourself rewriting huge portions of your code just to try to be compliant.
3. But Wait, There’s More: Support and Maintenance
Remember how in school we first we learned the laws of physics as they apply to an ideal environment: “Nothing can travel faster than the speed of light in a vacuum.” Same is true for development. If you were working in a vacuum, you could be done with your grid once and for all and continue with your life.
In reality, you could be responsible for most or all of these accompanying tasks: bug fixing and replying to users constantly comparing your grid to what they know best—Excel; writing documentation so others can work with it, too; browser support; issues with third-party libraries you’ve implemented; and managing changes coming from a new framework version, to name a few.
4. Data Grid Performance Is Hard to Optimize
As you keep adding to the neat list of features of your data grid, you will start hearing complaints that the grid is loading too slowly. On mobile devices, you need consider how to smoothly handle touch actions instead of mouse and keyboard input.
Many JavaScript data table implementations fail because of user frustrations with performance. As you start researching how to make your grid load faster and handle data more efficiently, most answers point at optimizations that you had to do before even starting.
For example, with the KendoReact Data Grid, we made a decision from the start to decouple data operations (paging, sorting, filtering, grouping, etc.) that can slow down the component from the internals of the Grid. As part of this effort, we created a dedicated a Data Query library that simplifies dealing with the data operations in the Grid. With the logic around data handled by libraries or the server rather than a UI component, the Grid becomes super fast while still letting users slice and dice the data to their hearts’ desires.
5. It’s Already Been Done—and Done Well!
“Don’t reinvent the wheel” is a mantra commonly chanted by developers. Been there, done that, printed it on a t-shirt. We hear this sentence so often that it rarely even registers anymore. Let’s approach it with a beginner’s mind for just a minute.
The oldest discovered wheel dates back to about 5,500 years ago in Mesopotamia. From a present-day perspective, 5,500 years is a lot of time for people to try to create a better wheel, a new kind of wheel, a wheel to call your own. Indeed, many have tried. Look around, though. We still use the Wheel of Mesopotamia™, that perfect round shape that one of our predecessors invented over a million years after the first humans appeared.
Now, is there a better metaphor to use for a UI component that’s square 99% of the time? Probably, but you get the point. The hard work has been done. If you can use someone else’s grid and it serves your purpose well, why spend countless hours recreating it instead of focusing on building rockets to the moon, or whatever strikes your fancy.
I mentioned earlier that my team has built multiple data grids. We have run into all the same pitfalls described so far. However, as a company we have been building data grids for the web for over 18 years, so we know what to expect when we set out on a journey to write a table from the ground up and can plan accordingly.
There’s one last thought I want to leave you with before you tell me in the comments how great writing a data grid has been for you. As I’ve spent so much time outlining why you should NOT build your own JavaScript grid, I need to provide an alternative. What is it that I recommend? Don’t re-invent the wheel. Use one of the many wheels already out there: use a third-party data grid. And I can’t speak for any of the multiple solutions out there, but I can say that the Kendo UI team has done their best in creating these four powerful, yet easy to implement, grids:
- Kendo UI for Angular Data Grid
- KendoReact Data Grid
- Kendo UI for Vue Data Grid
- Kendo UI for jQuery Data Grid
So, before you set out on the long and winding road of writing your own grid, take a step back and think about the options available to you. If you have some basic requirements, you might be able to build something on your own or use one of the many open source data grids out there. However, if you have more complex and advanced requirements, or know your users well enough that you can see them asking for an Excel twin, then take one of our Kendo UI Data Grids for a spin.
We’ve built these meticulously for each framework to ensure you get to benefit from a developer-friendly and feature-rich grid that integrates well with your existing apps—and as a bonus we throw in over 100+ other UI components in each library to help with any non-grid UX requirements. Let’s roll!
P.S. To be precise, we’ve written many more Data Grids than these four. If you’re interested in implementing data grids for any other technology—check out what's available in our developer toolbox, DevCraft.

Nora Petrova
Nora is a product marketing manager and the proud mother of Sophie. She is dedicated to enhancing developer experience and boosting productivity and is passionate about improving designer-developer collaboration. A snowboarder, an improv theater performer and a writer (even if her work often stays unpublished), she finds joy in exploring both the physical world and the limitless realm of imagination.
