
Telerik Reporting
What's New R2 2020
What's New HistoryFull-Featured Web Report Designer
With R2 2020, we continue the development of Web Report Designer in Telerik Reporting. It enables developers to bring report editing functionality to their end users right from their web applications.
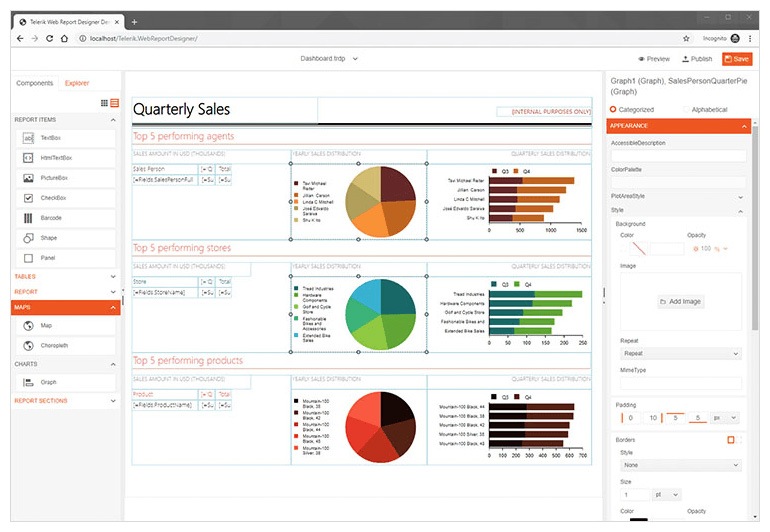
Let’s review the major enhancements in this release that drive feature parity with desktop report designers.
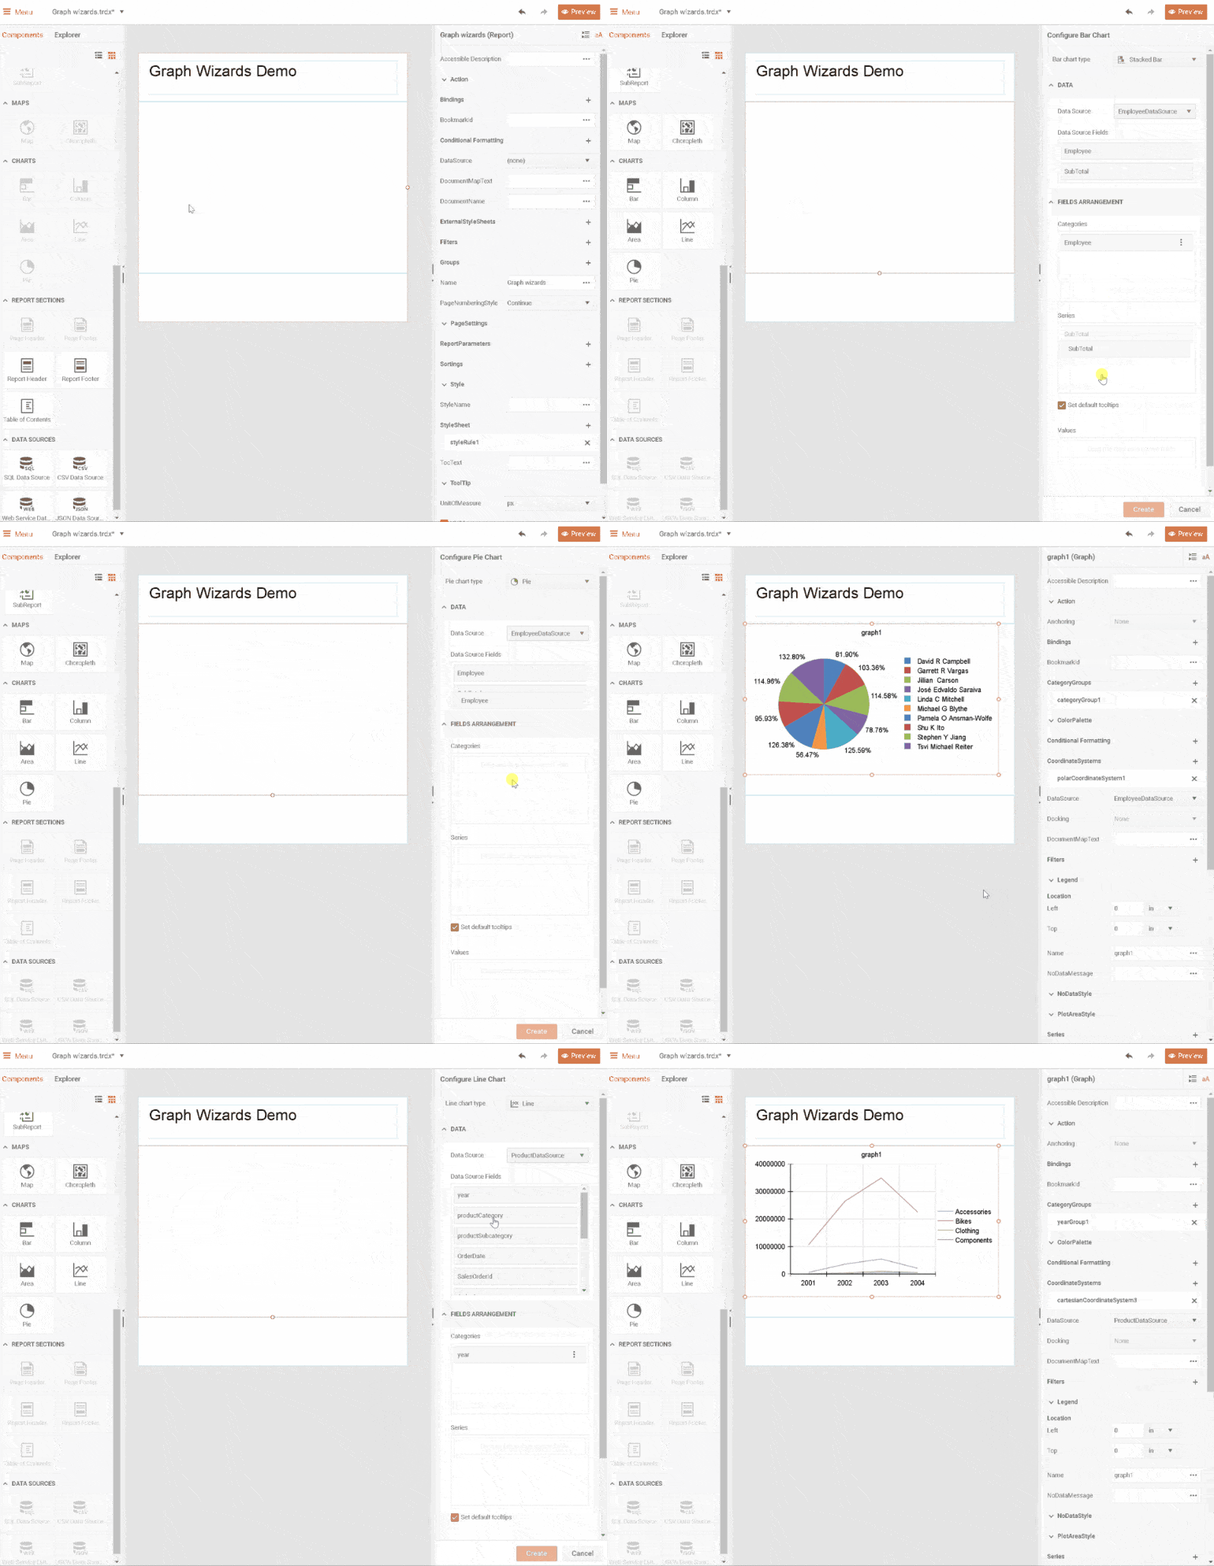
Graph item Wizard
The new Graph item Wizard enables easy setup of line, pie, area, bar and column charts without leaving the comfort of the Properties area. Configuring the Categories, Series and Values is done intuitively by dragging and dropping the corresponding fields.
Faster Backend
The Web Report Designer relies heavily on the type information served from the backend so that it can offer the editing capabilities for the Telerik.Reporting APIs. With this release we consolidated big chunks of requests, which makes the initial loading of the report designer much faster. The change is easily noticeable when using the full .NET framework service implementation where the report now loads up to 3x faster than before.
Overall UX
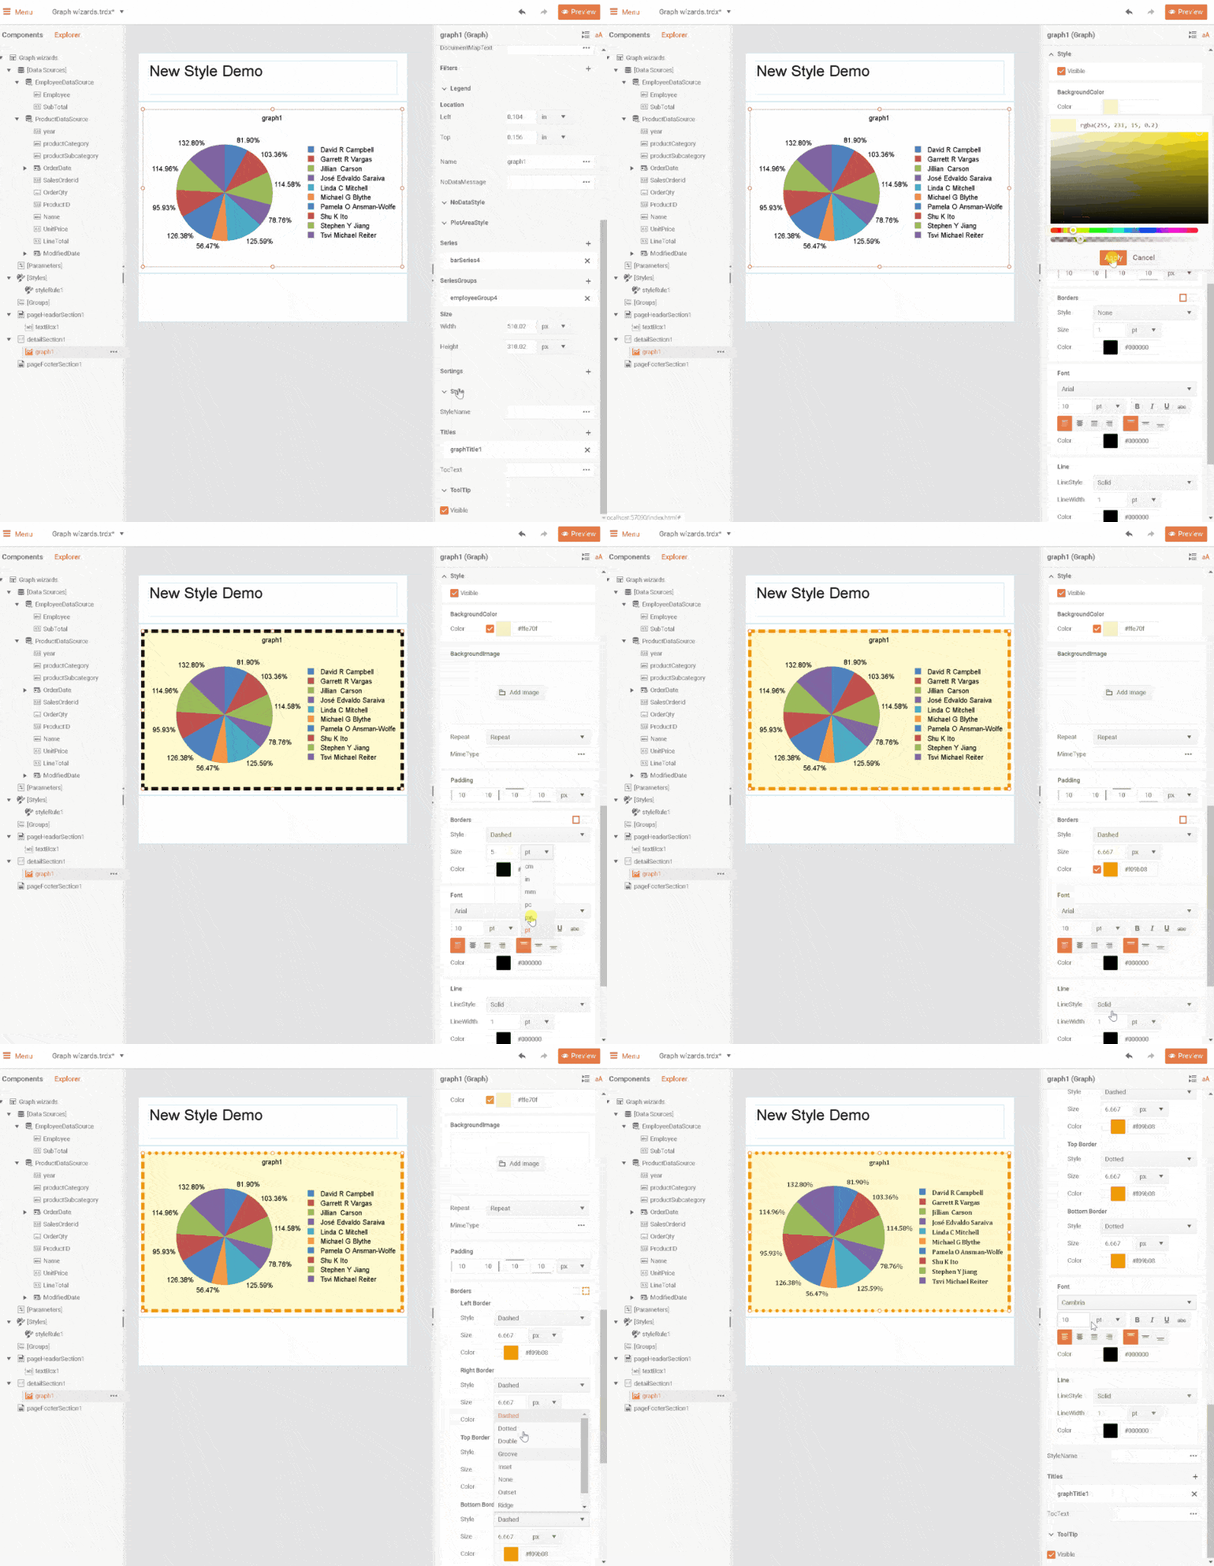
The overall User Experience is leveled up by multiple changes, fixes and refinements of the Properties area editors, additional commands and behaviors in the Report Explorer area. The Web Designer also got a loader to indicate if a task takes more than expected.
Blazor Report Viewer V.2.0
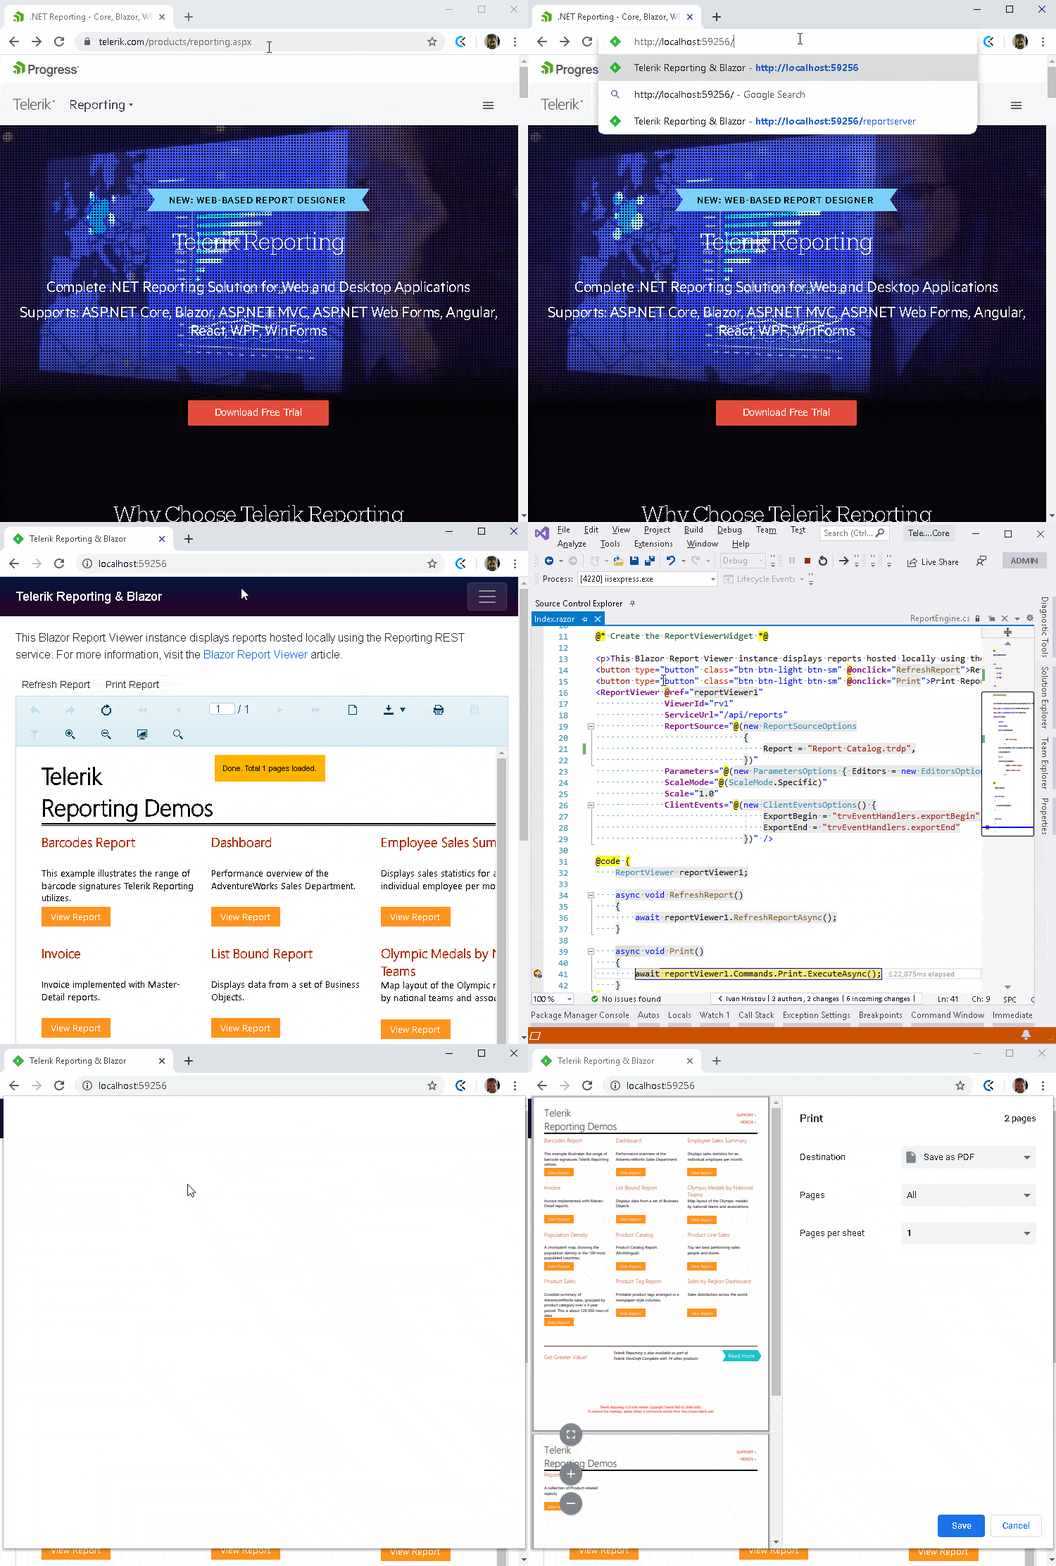
Some months ago, Telerik Reporting introduced a new report viewer for Blazor. It wraps the flexible HTML5/JS web report viewer and ensures fast and easy preview of reports directly into a Blazor application. With this new addition any web developer is empowered to:
- Add reporting functionality to an application built with Blazor using a dedicated Blazor component
- Style the viewer using our flexible Kendo UI themes to match the look of the Blazor application
With R2 2020 the Blazor Report Viewer is extended further with advanced properties, methods, and commands using the Razor syntax so that it covers the full API offered by the HTML5 Report Viewer.
*Telerik Reporting features report viewers for Blazor, ASP.NET Core, ASP.NET MVC, ASP.NET Web Forms, WPF, WinForms, HTML5, Angular, React, and Vue apps.
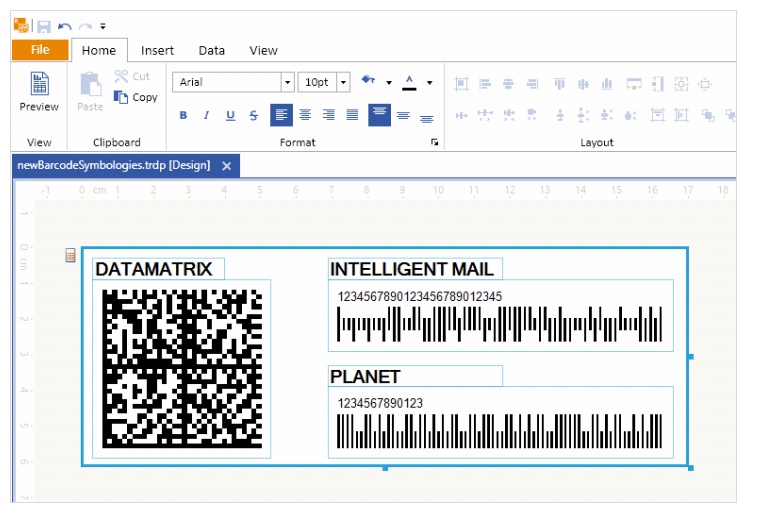
New Barcode Symbologies
With R2 2020, we enable the report authors who want to use the highly requested Data Matrix barcode symbology into their reports. We’re also introducing Planet and IntelligentMail symbologies, previously available in our Desktop control suites.
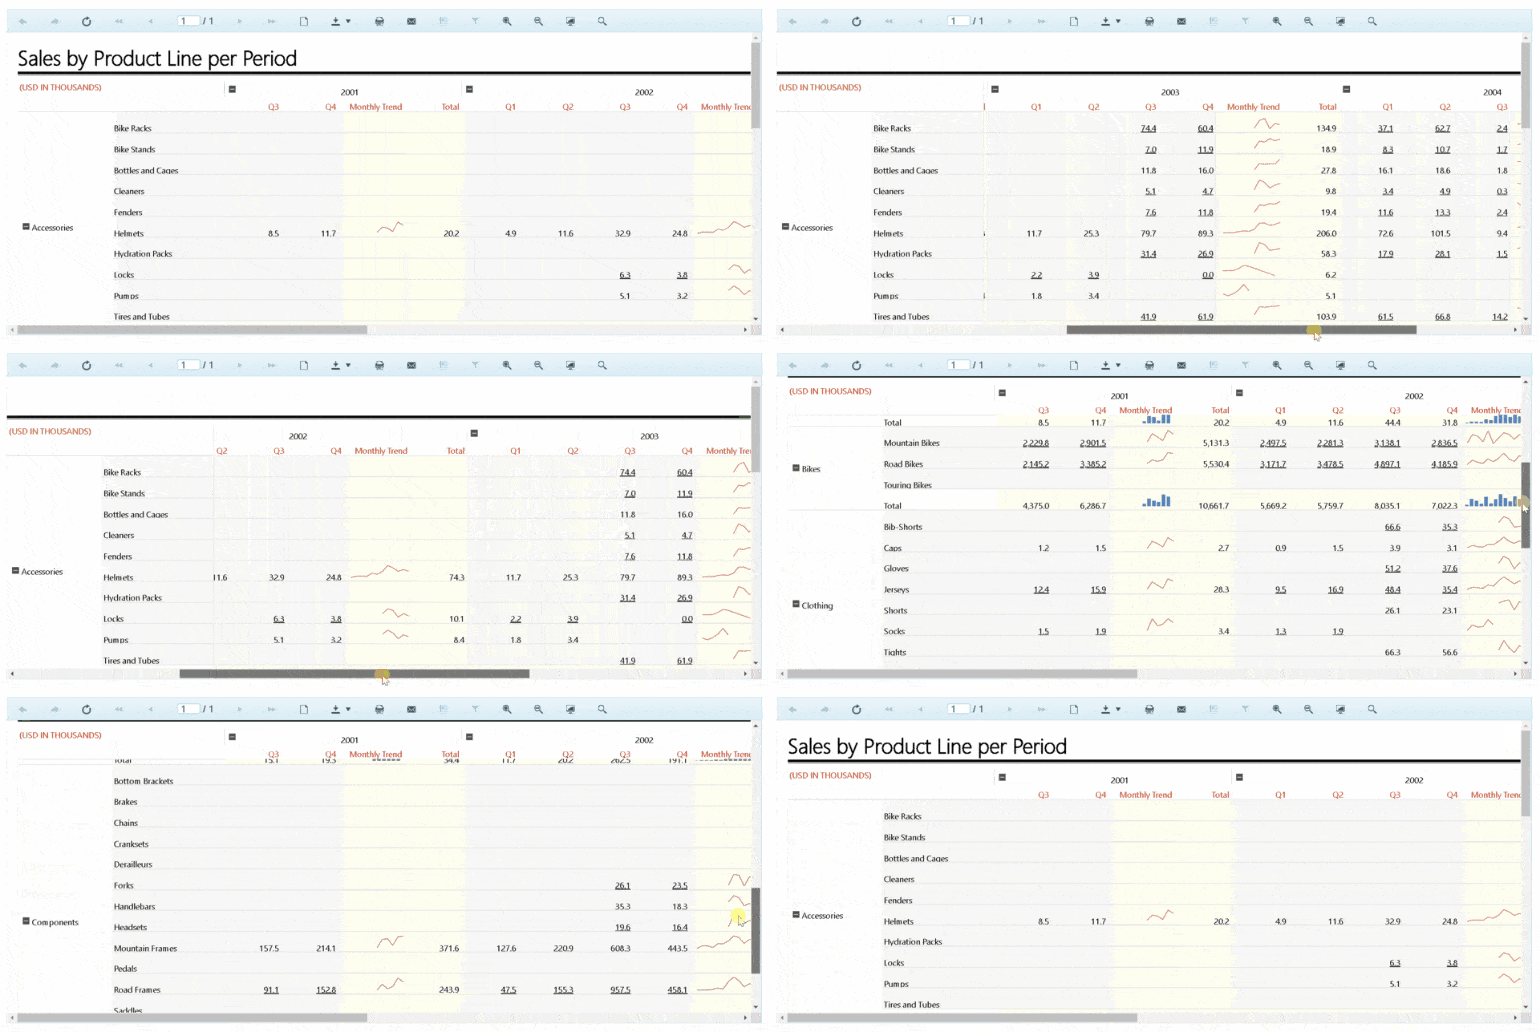
Ability to Freeze Table/Band Header in Web-based Report Viewers
In R2 2020, we have improved the end user’s experience by enabling the Table headers’ freeze. This would prevent the row and column headers from scrolling out of view while examining extensive data of a report document in our Web-based report viewers. The feature is like the one found in MS Excel, where users can keep an area of a worksheet visible while scrolling to another area.
Base64-encoded Images Support in PictureBox Item in Reporting
Nowadays, when it is all Web, Base64 encoded data is a common way of transferring and storing data, including images. We’ve covered this scenario by enabling Picture box and other image containers to be directly bound to a Base64-encoded string representing the image data.
Reports Web Service Improvements
As the most exercised way of report generation, the service constantly gets internal improvements. This time, it’s the way it stores its cached report pages for preview. By default, they are now compressed to save space and transfer to time to the target cache provided.
The second improvement brings a change in the custom report resolver APIs so that implementer has access to additional information while resolving the report.
New features & Roadmap
Have a feature request?
Post your feedback via the Reporting feedback portal or the public forums
What's new across all Telerik products?
See the updates feed

Next Steps
See Telerik’s Report Designer in action and check how much it can do out of the box
Check out the offers. Purchase an individual license for .NET reporting or treat yourself to one of our bundles.
Try Telerik’s .NET Reporting tool with dedicated technical support.


