Telerik Report Server
What's New R1 2023
What's New HistoryReport Engine Evolution
The report authors can now propagate data to an inner report using the newly introduced DataSource property on the SubReport item. This is extremely useful if the main report is bound to a data source supporting hierarchical data like JSON (either using the JsonDataSource or the WebServiceDataSource component). Until now, we only supported propagating parameter values to the inner report, and it had to resolve the inner data itself based on these parameter values.
The report authors can write more concise expressions when fallback conditions matches are needed. The new Ifs and Switch conditional functions replace the need for nesting If function calls. Additionally, the If function inherited the original IIf function, introducing “lazy” evaluation of its arguments and thus optimizing the report processing. Lastly, more values are considered valid when conditional arguments are evaluated, e.g., 0 is considered false and 100 is considered true. Read more about the introduced behavior in the Conditional functions help article.
You can now upgrade from older Telerik Report Server versions easier as we introduced an engine execution switch to apply per report as necessary. This switch turns off an optimization introduced in the more recent product versions. This optimization is not compatible with a legacy report programming model that changed the report definition using Bindings. Using the new switch called CacheDefinitionProperties, you can take advantage of the optimization for your future reports without having to rework your legacy report definitions.

Predefine and Reuse Data Sources Across Different Reports in Report Server
Turn on the Web Report Designer in the Telerik Report Server settings to use this new collaboration functionality. The report authors can predefine Data Source instances that connect to the source data and return tabular data sets. The authors then reference these data sources when creating new or editing existing reports. There are multiple benefits of this functionality—it empowers the report authors to reuse one data source definition across multiple reports conveying different messages. What’s even more powerful is that two professionals can collaborate to produce the reports: A data expert can define the data sources, and the visualization specialist can use a data source as a client to present the data in the best possible way. We called the feature Shared data sources.

Separate Excel Worksheets in Report Server
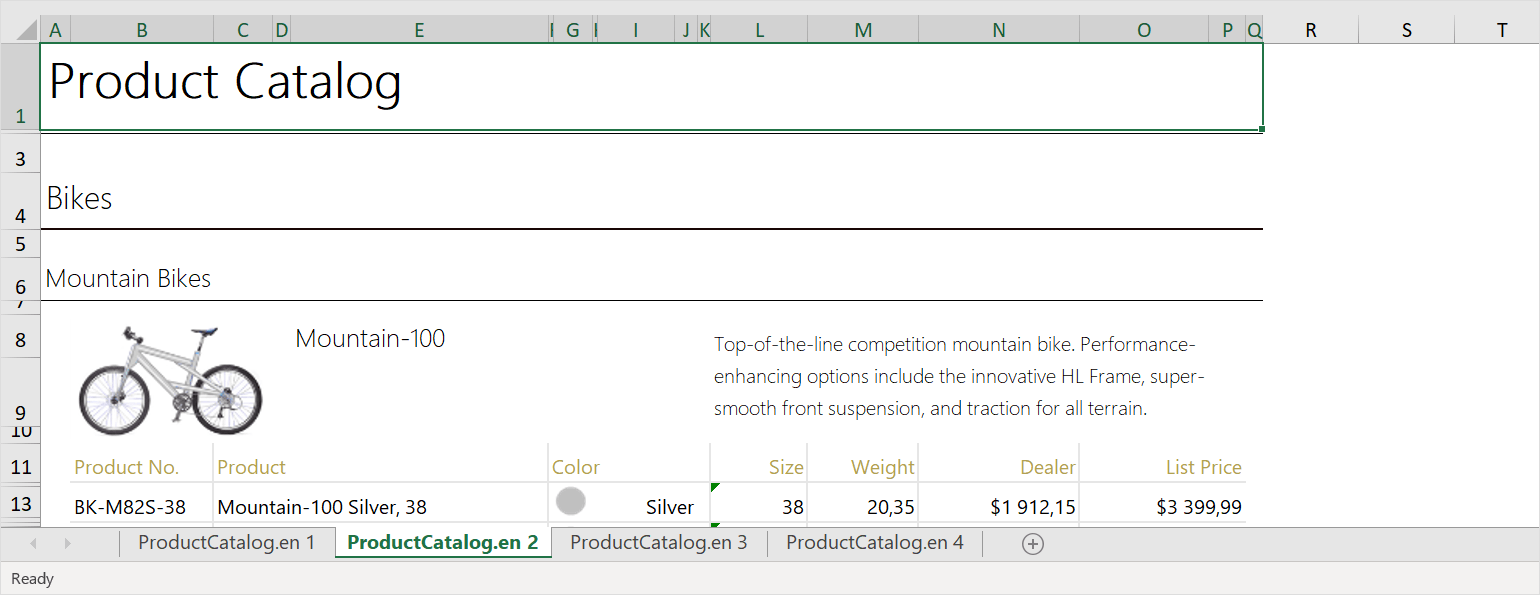
The export functionality can now generate separate Excel worksheets based on the page breaks in the report definition. A dedicated device info setting named SplitWorksheetOnPageBreakturns on this functionality. It works similarly to the so-called “soft page breaks.” The report authors can apply it to place different report sections or table groups in separate worksheets.

Web Report Designer Enhancements
The Web Report Designer provides users with an improved design experience when editing Table/Crosstab/List items. When users are selecting multiple cells, the selection border now traces these cells to make the operation visual hint clear. Additionally, the resize handles appear only on the bounding rectangle of the selected cells instead of on each cell individually, making the resize call-to-action straightforward. Resize operations affect the included rows or columns proportionally.

New features & Roadmap
Have a feature request?
Post your feedback via the Report Server feedback portal or the public forums
What's new across all Telerik products?

Next Steps
See Report Server in action and learn what it can do out of the box.
Check out the offers.
Try Report Server with dedicated technical support.


