Plot Bands
Plot Bands are colored ranges in the ASP.NET AJAX Chart, the purpose of which is to highlight areas of the chart by changing its background in a predefined axis range. Telerik introduced the plot bands in the Q1 2014 release.
The plot bands appear on the chart as colored areas that fill the entire space between two grid lines on the x-axis or on the y-axis.
You can set up such a range by creating PlotBand items and populating them in the PlotBands collection of the axis element (XAxis and YAxis).
Each PlotBand item exposes properties that allow you to specify how the colored area should be visualized:
-
From - The starting grid line of the plot band on the X or Y axes.
-
FromDate - The starting date for the plot band. Will have effect for a date axis only. Available as of R1 2019.
-
To - The ending grid line of the plot band on the X or Y axes.
-
ToDate - The end date for the plot band. Will have effect for a date axis only. Available as of R1 2019.
-
Alpha - The opacity of the plot band in range [0-255].
-
Color - The color of the plot band.
The value of the properties From and To depends on the type of the chart:
-
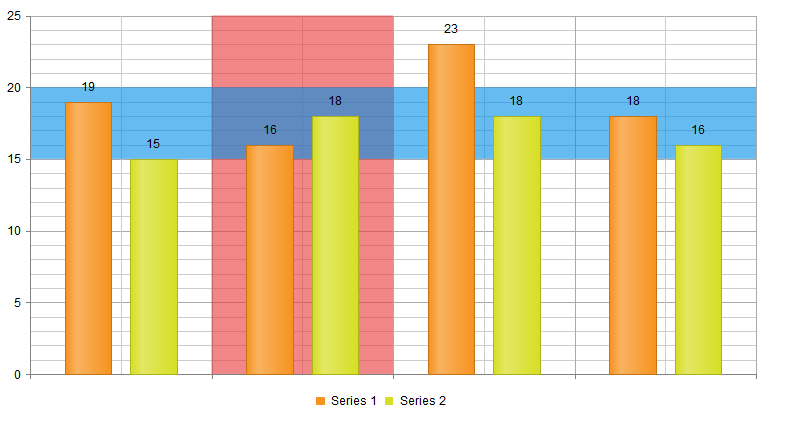
For the x-axis of categorical chart types (Area, Bar, Column, etc.), you need to set the index of the corresponding category. See Figure 1 and Example 1.
-
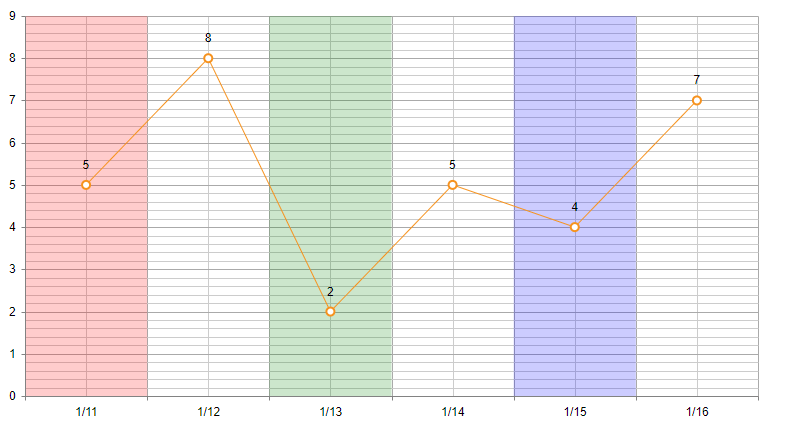
For a date axis, you can set an integer as the item index in the From and To properties. Alternatively, the FromDate and ToDate properties let you set a .NET date as of R1 2019. The exact numbers from the date (year, month, day, hour, minute, second, millisecond) are serialized for rendering without time zone conversions. Parsing the date, if set in the markup, is done by .NET according to your current settings. To use date objects, you must set both properties, if one of them does not have a value, the numbers will be serialized instead.
-
For numerical chart types (Scatter, Scatter Line, Bubble) and for the y-axis of categorical chart types, you need to set the actual value from the axis in the From and To properties.
Figure 1: A chart with two plot bands. The red band is on a categirical x-axis and the blue band is on the y-axis. Produced by the code in Example 1.

Example 1: Creating a chart that has two plot bands – one on a categorical x-axis and one on the y-axis.
<telerik:RadHtmlChart ID="Chart" runat="server" Width="760px" Height="420px">
	<PlotArea>
		<XAxis>
			<PlotBands>
				<telerik:PlotBand From="1" To="2" Color="#e83737" Alpha="100" />
			</PlotBands>
		</XAxis>
		<YAxis>
			<PlotBands>
				<telerik:PlotBand From="15" To="20" Color="#008de7" Alpha="100" />
			</PlotBands>
		</YAxis>
		<Series>
			<telerik:ColumnSeries Name="Series 1">
				<SeriesItems>
					<telerik:CategorySeriesItem Y="19" />
					<telerik:CategorySeriesItem Y="16" />
					<telerik:CategorySeriesItem Y="23" />
					<telerik:CategorySeriesItem Y="18" />
				</SeriesItems>
			</telerik:ColumnSeries>
			<telerik:ColumnSeries Name="Series 2">
				<SeriesItems>
					<telerik:CategorySeriesItem Y="15" />
					<telerik:CategorySeriesItem Y="18" />
					<telerik:CategorySeriesItem Y="18" />
					<telerik:CategorySeriesItem Y="16" />
				</SeriesItems>
			</telerik:ColumnSeries>
		</Series>
	</PlotArea>
	<Legend>
		<Appearance Position="Bottom"></Appearance>
	</Legend>
</telerik:RadHtmlChart>
Figure 2: A date axis with plot bands. Produced by the code in Example 2.

Example 2: How to add plot bands for a date axis. The FromDate and ToDate properties are available as of R1 2019. Indexes work in all versions that support Plot Bands.
<telerik:RadHtmlChart runat="server" ID="Chart2" Width="760px" Height="420px">
	<PlotArea>
		<Series>
			<telerik:LineSeries DataFieldY="valuesField"></telerik:LineSeries>
		</Series>
		<XAxis DataLabelsField="datesField" Type="Date">
			<PlotBands>
				<telerik:PlotBand From="0" To="1" Color="Red" Alpha="200" />
				<telerik:PlotBand FromDate="2019/1/13" ToDate="2019/1/14" Color="Green" Alpha="200" />
			</PlotBands>
		</XAxis>
	</PlotArea>
</telerik:RadHtmlChart>protected void Page_Load(object sender, EventArgs e)
{
if (!Page.IsPostBack)
{
Chart2.DataSource = GetData();
Chart2.DataBind();
}
PlotBand plotBand3 = new PlotBand(new DateTime(2019, 1, 15),
new DateTime(2019, 1, 16, 15, 16, 17),
System.Drawing.Color.Blue,
200);
Chart2.PlotArea.XAxis.PlotBands.Add(plotBand3);
}
protected DataTable GetData()
{
DataTable dt = new DataTable();
dt.Columns.Add("valuesField", typeof(int));
dt.Columns.Add("datesField", typeof(DateTime));
dt.Rows.Add(5, new DateTime(2019, 1, 11));
dt.Rows.Add(8, new DateTime(2019, 1, 12));
dt.Rows.Add(2, new DateTime(2019, 1, 13));
dt.Rows.Add(5, new DateTime(2019, 1, 14));
dt.Rows.Add(4, new DateTime(2019, 1, 15));
dt.Rows.Add(7, new DateTime(2019, 1, 16));
return dt;
}