Creating RadChart Programmatically - more complex example
RadChart has been deprecated since Q3 2014 and is marked as obsolete as of the 2026 Q2 SP1 (v2026.2.708) release. This is the last release that includes the RadChart component — its source code will be removed from the assembly in the next release. We strongly recommend using RadHtmlChart, Telerik's modern client-side charting component. To transition from RadChart to RadHtmlChart, refer to the following migration articles:
Explore the RadHtmlChart documentation and online demos to determine how it fits your development needs.
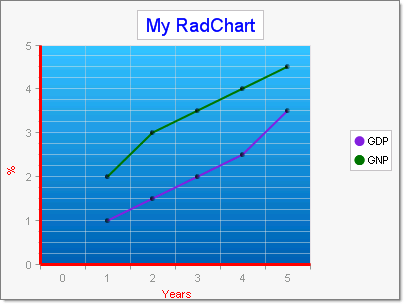
The figure above shows a more complex chart than the minimal example of programmatically created RadChart. This example demonstrates how to:
-
Create the chart, define the chart title and the title's appearance.
-
Define two different chart series, how to hide the series labels and tailor the series appearance.
-
Add multiple chart series items with data.
-
How to display point marks to highlight the data points.
-
Fill the plot area background with a gradient color.
-
Set axis line and label appearance.
// Define chart and titleRadChart radChart = new RadChart();
radChart.ChartTitle.TextBlock.Text = "My RadChart";
radChart.ChartTitle.TextBlock.Appearance.TextProperties.Color = System.Drawing.Color.Blue;
// Define chart series
ChartSeries chartSeries = new ChartSeries();
chartSeries.Appearance.LabelAppearance.Visible = false;
chartSeries.Name = "GDP";
chartSeries.Type = ChartSeriesType.Line;
chartSeries.Appearance.LineSeriesAppearance.Color = System.Drawing.Color.BlueViolet;
// Define the items in the series
chartSeries.AddItem(1);
chartSeries.AddItem(1.5);
chartSeries.AddItem(2.0);
chartSeries.AddItem(2.5);
chartSeries.AddItem(3.5);
// visually enhance the datapoints
chartSeries.Appearance.PointMark.Dimensions.AutoSize = false;
chartSeries.Appearance.PointMark.Dimensions.Width = 5;
chartSeries.Appearance.PointMark.Dimensions.Height = 5;
chartSeries.Appearance.PointMark.FillStyle.MainColor = System.Drawing.Color.Black;
chartSeries.Appearance.PointMark.Visible = true;
// Define chart series
ChartSeries chartSeries2 = new ChartSeries();
chartSeries2.Appearance.LabelAppearance.Visible = false;
chartSeries2.Name = "GNP";
chartSeries2.Type = ChartSeriesType.Line;
chartSeries2.Appearance.LineSeriesAppearance.Color = System.Drawing.Color.Green;
// Define the items in the series
chartSeries2.AddItem(2);
chartSeries2.AddItem(3);
chartSeries2.AddItem(3.5);
chartSeries2.AddItem(4);
chartSeries2.AddItem(4.5);
// visually enhance the data points
chartSeries2.Appearance.PointMark.Dimensions.AutoSize = false;
chartSeries2.Appearance.PointMark.Dimensions.Width = 5;
chartSeries2.Appearance.PointMark.Dimensions.Height = 5;
chartSeries2.Appearance.PointMark.FillStyle.MainColor = System.Drawing.Color.Black;
chartSeries2.Appearance.PointMark.Visible = true;
// set the plot area gradient background fill
radChart.PlotArea.Appearance.FillStyle.FillType = Telerik.Charting.Styles.FillType.Gradient;
radChart.PlotArea.Appearance.FillStyle.MainColor = System.Drawing.Color.FromArgb(65, 201, 254);
radChart.PlotArea.Appearance.FillStyle.SecondColor = System.Drawing.Color.FromArgb(0, 107, 186);
// Set text and line for X axis
radChart.PlotArea.XAxis.AxisLabel.TextBlock.Text = "Years";
radChart.PlotArea.XAxis.AxisLabel.TextBlock.Appearance.TextProperties.Color = System.Drawing.Color.Red;
radChart.PlotArea.XAxis.Appearance.Width = 3;
radChart.PlotArea.XAxis.Appearance.Color = System.Drawing.Color.Red;
// Set text and line for Y axis
radChart.PlotArea.YAxis.AxisLabel.TextBlock.Text = "%";
radChart.PlotArea.YAxis.AxisLabel.TextBlock.Appearance.TextProperties.Color = System.Drawing.Color.Red;
radChart.PlotArea.YAxis.Appearance.Width = 3;
radChart.PlotArea.YAxis.Appearance.Color = System.Drawing.Color.Red;
// Add the series to the chart, chart to page.radChart.Series.Add(chartSeries);radChart.Series.Add(chartSeries2);this.Page.Controls.Add(radChart)