New to Telerik UI for .NET MAUI? Start a free 30-day trial
.NET MAUI Chart ScatterSplineArea Series
Updated over 1 year ago
The Cartesian Chart visualizes ScatterSplineArea Series as the area enclosed by the coordinate axes and curved line segments that connect the series data points. The ScatterSplineArea Series inherit from the ScatterPointSeries class and also require both axes of the chart to be Numerical Axes.
Features
The ScatterSplineArea Series provides the following properties:
XValueBinding—Defines the binding that will be used to fill theXValueof theScatterDataPointmembers of theDataPointscollection.YValueBinding—Defines the binding that will be used to fill theYValueof theScatterDataPointmembers of theDataPointscollection.Stroke(Color)—Changes the color for drawing lines.StrokeThickness(double)—Changes the width of the lines.Fill(Color)—Changes the color for filling the area shapes.
ScatterSplineArea Series Example
The following example shows how to create a RadCartesianChart with a ScatterSplineArea Series:
1. Create the needed business objects, for example:
C#
public class NumericalData
{
    public double XData { get; set; }
    public double YData { get; set; }
}
2. Create a ViewModel:
C#
public class NumericalViewModel
{
    public ObservableCollection<NumericalData> Data { get; set; }

    public NumericalViewModel()
    {
        this.Data = GetNumericData();
    }

    public static ObservableCollection<NumericalData> GetNumericData()
    {
        var data = new ObservableCollection<NumericalData>
        {
            new NumericalData { XData = 4, YData = 9 },
            new NumericalData { XData = 8, YData = 10 },
            new NumericalData { XData = 9, YData = 13 },
            new NumericalData { XData = 12, YData = 24 },
            new NumericalData { XData = 17, YData = 24 },
            new NumericalData { XData = 21, YData = 4 },
            new NumericalData { XData = 26, YData = 13 },
            new NumericalData { XData = 29, YData = 3 },
            new NumericalData { XData = 30, YData = 16 },
        };
        return data;
    }
}
3. Use the following snippet to declare a RadCartesianChart with a ScatterSplineArea Series in XAML:
XAML
<telerik:RadCartesianChart>
<telerik:RadCartesianChart.BindingContext>
<local:NumericalViewModel />
</telerik:RadCartesianChart.BindingContext>
<telerik:RadCartesianChart.HorizontalAxis>
<telerik:NumericalAxis LabelFitMode="MultiLine" />
</telerik:RadCartesianChart.HorizontalAxis>
<telerik:RadCartesianChart.VerticalAxis>
<telerik:NumericalAxis />
</telerik:RadCartesianChart.VerticalAxis>
<telerik:RadCartesianChart.Series>
<telerik:ScatterSplineAreaSeries XValueBinding="XData"
YValueBinding="YData"
ItemsSource="{Binding Data}" />
</telerik:RadCartesianChart.Series>
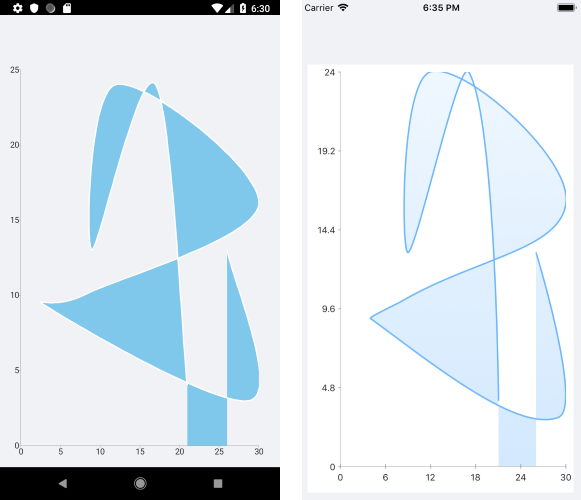
</telerik:RadCartesianChart>The following image shows the end result:
Customization Example
You can further customize the ScatterSplineArea Series:
C#
var series = new ScatterSplineAreaSeries
{
	Stroke = new Color(0.6, 0.6, 0.9),
	StrokeThickness = 5,
	Fill = new Color(0.8, 0.8, 1)
};