New to Telerik UI for .NET MAUI? Start a free 30-day trial
.NET MAUI Chart ScatterPoint Series
Updated over 1 year ago
The ScatterPoint Series are represented on the chart as data points that are not connected. Each scatter data point has to provide values for the X and Y coordinates on the RadCartesianChart. The ScatterPoint Series require both axes of the chart to be Numerical Axes.
Features
The ScatterPoint Series provides the following properties:
XValueBinding—Defines the binding that will be used to fill theXValueof theScatterDataPointmembers of theDataPointscollection.YValueBinding—Defines the binding that will be used to fill theYValueof theScatterDataPointmembers of theDataPointscollection.
Example
The following example shows how to create a RadCartesianChart with a ScatterPoint Series:
1. Create the needed business objects, for example:
C#
public class NumericalData
{
    public double XData { get; set; }
    public double YData { get; set; }
}
2. Create a ViewModel:
C#
public class SeriesNumericalViewModel
{
    public ObservableCollection<NumericalData> Data1 { get; set; }
    public ObservableCollection<NumericalData> Data2 { get; set; }

    public SeriesNumericalViewModel()
    {
        this.Data1 = GetNumericData1();
        this.Data2 = GetNumericData2();
    }

    public static ObservableCollection<NumericalData> GetNumericData1()
    {
        var data = new ObservableCollection<NumericalData>
        {
            new NumericalData { XData = 2, YData = 13 },
            new NumericalData { XData = 19, YData = 31 },
            new NumericalData { XData = 22, YData = 33 },
            new NumericalData { XData = 28, YData = 35 },
            new NumericalData { XData = 33, YData = 46 },
            new NumericalData { XData = 38, YData = 34 },
            new NumericalData { XData = 49, YData = 66 },
            new NumericalData { XData = 55, YData = 24 },
            new NumericalData { XData = 62, YData = 41 },
        };
        return data;
    }
    public static ObservableCollection<NumericalData> GetNumericData2()
    {
        var data = new ObservableCollection<NumericalData>
        {
            new NumericalData { XData = 7, YData = 13 },
            new NumericalData { XData = 19, YData = 17 },
            new NumericalData { XData = 22, YData = 19 },
            new NumericalData { XData = 28, YData = 21 },
            new NumericalData { XData = 33, YData = 35 },
            new NumericalData { XData = 38, YData = 43 },
            new NumericalData { XData = 49, YData = 15 },
            new NumericalData { XData = 55, YData = 21 },
            new NumericalData { XData = 62, YData = 47 },
        };
        return data;
    }
}
3. Use the following snippet to declare a RadCartesianChart with a ScatterPoint Series in XAML and in C#:
XAML
<telerik:RadCartesianChart PaletteName="LightSelected">
<telerik:RadCartesianChart.BindingContext>
<local:SeriesNumericalViewModel />
</telerik:RadCartesianChart.BindingContext>
<telerik:RadCartesianChart.HorizontalAxis>
<telerik:NumericalAxis LabelFitMode="MultiLine" />
</telerik:RadCartesianChart.HorizontalAxis>
<telerik:RadCartesianChart.VerticalAxis>
<telerik:NumericalAxis />
</telerik:RadCartesianChart.VerticalAxis>
<telerik:RadCartesianChart.Series>
<telerik:ScatterPointSeries XValueBinding="XData"
YValueBinding="YData"
ItemsSource="{Binding Data1}" />
<telerik:ScatterPointSeries XValueBinding="XData"
YValueBinding="YData"
ItemsSource="{Binding Data2}" />
</telerik:RadCartesianChart.Series>
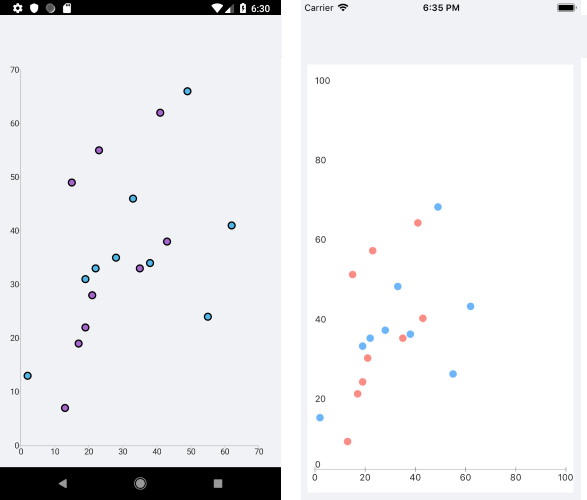
</telerik:RadCartesianChart>The following image shows the end result: