.NET MAUI Chart Area Series
Use AreaSeries to plot categorical data as a continuous line with a filled area between the line and the chart axis. This series is useful when you want to emphasize both the trend and the magnitude of the values across categories.
AreaSeries derives from the categorical stroked series types, so it requires one categorical axis and one numerical axis in a RadCartesianChart. The series fill is defined by the chart axes, which matters when you want the shaded area to appear above instead of below the line.
When to Use the Area Series
Use AreaSeries when you want to:
- Show how values change across categories.
- Emphasize the distance between the data points and the chart baseline.
- Combine a trend line with a filled visual that is easier to compare at a glance.
Features
The AreaSeries exposes the following properties:
Fill—Defines the fill of the area.Stroke—Defines the color of the series line.StrokeThickness—Defines the width of the series line.
Area Series Example
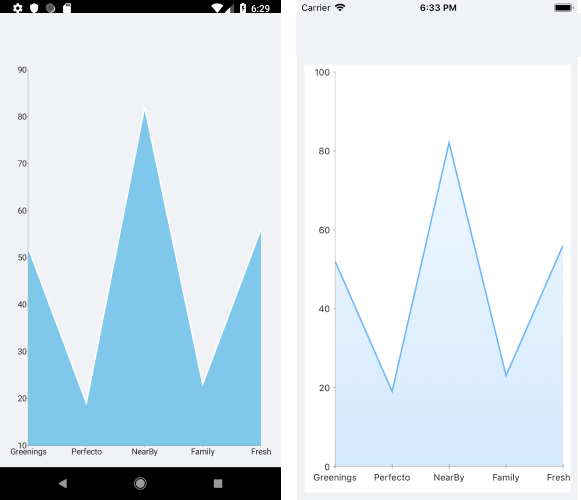
The following example shows how to create a RadCartesianChart with an AreaSeries:
- Create a sample business object:
public class CategoricalData
{
    public object Category { get; set; }
    public double Value { get; set; }
}- Create a
ViewModel:
public class CategoricalViewModel
{
    public ObservableCollection<CategoricalData> Data { get; set; }

    public CategoricalViewModel()
    {
        this.Data = GetCategoricalData();
    }

    private static ObservableCollection<CategoricalData> GetCategoricalData()
    {
        var data = new ObservableCollection<CategoricalData>
        {
            new CategoricalData { Category = "Greenings", Value = 52 },
            new CategoricalData { Category = "Perfecto", Value = 19 },
            new CategoricalData { Category = "NearBy", Value = 82 },
            new CategoricalData { Category = "Family", Value = 23 },
            new CategoricalData { Category = "Fresh", Value = 56 },
        };
        return data;
    }
}- Declare a
RadCartesianChartwith anAreaSeriesin XAML or C#:
<telerik:RadCartesianChart>
    <telerik:RadCartesianChart.BindingContext>
        <local:CategoricalViewModel />
    </telerik:RadCartesianChart.BindingContext>
    <telerik:RadCartesianChart.HorizontalAxis>
        <telerik:CategoricalAxis LabelFitMode="MultiLine"
                              PlotMode="OnTicks" />
    </telerik:RadCartesianChart.HorizontalAxis>
    <telerik:RadCartesianChart.VerticalAxis>
        <telerik:NumericalAxis />
    </telerik:RadCartesianChart.VerticalAxis>
    <telerik:RadCartesianChart.Series>
        <telerik:AreaSeries ValueBinding="Value"
                         CategoryBinding="Category"
                         ItemsSource="{Binding Data}" />
    </telerik:RadCartesianChart.Series>
</telerik:RadCartesianChart>
The following image shows the result:
Customization Example
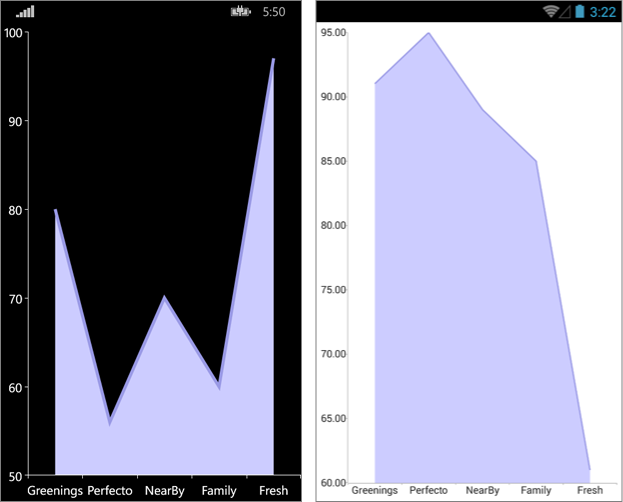
You can further customize the Area Series:
var series = new AreaSeries
{
	Fill = new Color(0.8, 0.8, 1),
	Stroke = new Color(0.6, 0.6, 0.9),
	StrokeThickness = 5
};
The following image shows a customized area series with a thicker line and a light fill: