or
1 answer
79 views
Wondering if the new Diagram component will satisfy feature requirements we have for our application:
1. Admin/Developer builds a Diagram and saves to JSON text and puts that in SQL database (Table/Field json or nvarchar(max)) which is then loaded by end user in app.
2. Some shapes in the diagram will be read only, can't be modified.
3. Restrict what type shapes can be added and provide default size of shape.
4. Shapes contain an image (as background).
5. User clicks on shapes within the Diagram and event fires and we do stuff (execute code, get data, make visible another component, etc.)
6. Or User links shapes but can't modify the shape/contents but can establish links between shapes (that we can respond to and update back end database) ... an event link connection trigger.
7. User can save the connections/layout.
Viable?
Rob.

Dimo
Telerik team

answered
on
19 Aug 2026
1 answer
100 views
I had a previous forum post of mine I was looking for, but no matter what terms I used I couldn't get it to return. Luckily it wasn't too old so I could scroll to see it.
The post I was searching for was this one: https://www.telerik.com/forums/teleriktaskboard---repls-are-broken-question
But if I search for the term TelerikTaskBoard it will not get returned, even though it's in the subject and body.
The post I was searching for was this one: https://www.telerik.com/forums/teleriktaskboard---repls-are-broken-question
But if I search for the term TelerikTaskBoard it will not get returned, even though it's in the subject and body.
Dimo
Telerik team
answered
on
14 Aug 2026
1 answer
41 views
We are using our map to display our company's different locations across the US, but we also have a list of points for our competitors' locations. I wanted to make it so our pins our colored blue and the competitor locations are colored red, but I have been having a lot of trouble trying to achieve this. Do you guys know of any good way i could achieve this effect?
Dimo
Telerik team
answered
on
13 Aug 2026
1 answer
82 views
I have one page in my existing .NET Framework app that uses RadSplitter, RadPane and RadScheduler where the RadScheduler is using a web handler to construct and feed the Scheduler with the data to populate it. Is it just a matter of reworking the UI and adjusting the web handler to a an endpoint or service, or do I have to totally rework data binding? This could was written over 15 years ago and I really don't want to have to rewrite it.
Thanks in advance.
Matt.
2 answers
694 views
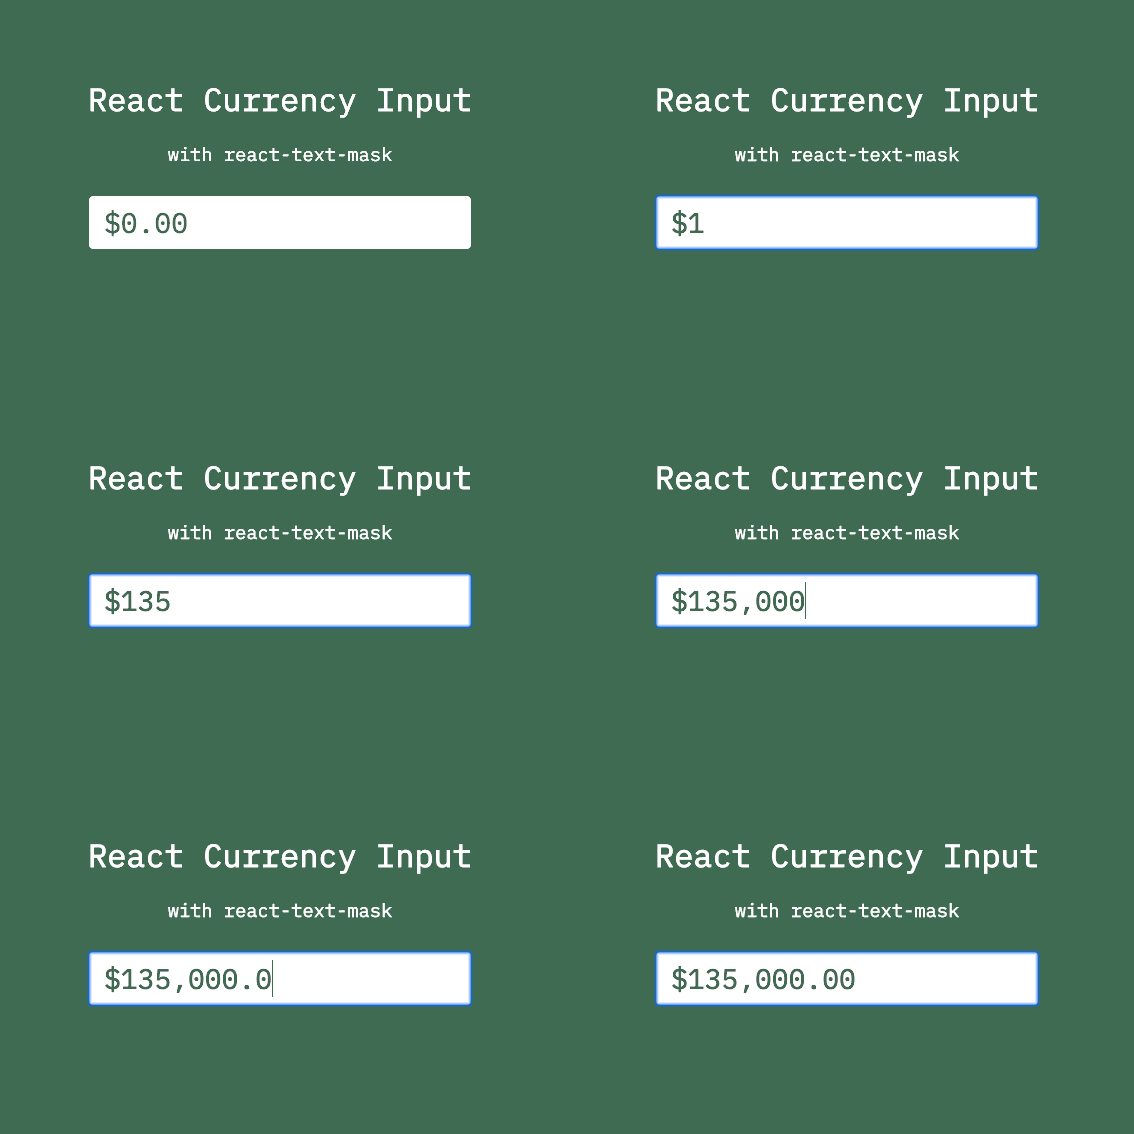
There is currently no component that has automatic currency formatting for Blazor. This is critical feature for business users who work with large amounts. People have no idea what they are typing without focusing out of input box.

Johannes
Top achievements
 Rank 1
 Iron
Iron
Rank 1
Iron
answered
on
10 Aug 2026
1 answer
48 views
I'm trying to replicate what I believe is a tabstrip menu display (not the best description).
I've attached a sample of what I'm trying to do. Basically, when a menu item is selected, a new windows in the viewport is opened and the page is displayed there. Multiple pages can be opened when selecting menu items.
Clicking the X on the left would close all open windows. Home would be always displayed.
Is this done with Tabstrip or some other component?
1 answer
272 views
I need to get the node number of the tree view. I know there is a TreeItem that has the Level property but I can't figure out how to get it. I tried using an Item Template and that is where I am stuck. I couldn't figure out how to get the item info.
<div>This is the tree view <br />
<TelerikTreeView
    Data="TreeViewList">
    <TreeViewBindings>
        <TreeViewBinding
            ParentIdField="ParentId"
            IdField="Id"
            HasChildrenField="HasChildren"
            TextField="Name">
        </TreeViewBinding>
    </TreeViewBindings>
</TelerikTreeView>
</div>
Patrick | Technical Support Engineer, Senior
Telerik team
updated answer
on
04 Aug 2026
1 answer
53 views
Our Blazor Server app runs on a server where the TimeZone is UTC. This is a multi-tenant application and tenants connect from Time Zones from California to Eastern Europe. We will leave or server at UTC.
The issue is reproduced when using the TelerikDatePicker with a nullable Date for the value. Our form defaults to Null for the Date values, as it is a selection form and the dates are optional.
For a customer in California (PDT) after 5PM (0:00 UTC) - the Calendar control in the Popup starts setting the default Day that is highlighed in the calendar control to the next day.
Is there a way to set the Default selected date using a Method? Some sort of delegate? We do pass the user's current Date Time and Timezone when the Blazor circuit is created and we have methods already built to return the current Date and Time in their Timezone. But we haven't found a way to set the default Date for the Date Picker (Calendar control) - when the Date value is null.
We do not want to set the value - but want to leave it null. This only applies to the embedded calendar control that pops up when the user clicks the icon to do so.
Dimo
Telerik team
answered
on
04 Aug 2026
2 answers
166 views
It appears none of the 'open in REPL' buttons work for the TelerikTaskBoard component. Some don't load any code in the REPL, others error at runtime.
I was trying to figure out how you got the Add Card pane to overlay the task board instead of push, when using the default Add Card hooks. The default behavior appears to be the Add card pushes the taskboard content. The online AI bot said this wasn't exposed via a parameter, but your demos that run in the Demos it uses an overlay. And I didn't see how this was working, as we want the same behavior.
Also there's no option to add TaskBoard as a tag here in forum posts.
Craig
Top achievements
Rank 1
 Iron
Iron
Iron
Iron
Rank 1
Iron
Iron
updated answer
on
28 Jul 2026
1 answer
47 views
Hi,
I'm using the CSS zoom property to scale my website and noticed that the Telerik Splitter does not behave correctly when a zoom level is applied.
I've adjusted the Blazor Splitter demo to reproduce the issue. I simply added a css Class with the zoom property set and applied it to the TelerikSplitter Element. After that resizing of the the splitter panes by dragging the splitter handle is not possible anymore:
https://blazorrepl.telerik.com/cgYBGVEC17NDglUz26
Given that CSS zoom is supported by all major browsers according to Can I Use (https://caniuse.com/css-zoom), is the Splitter component expected to work correctly in a zoomed container, or is this currently a known limitation?
Thanks!
Edit:
This issue seems to affect not only the Splitter but also other draggable elements. For example, resizing Grid columns is affected as well.