Zoom and Scroll Data Over Time with RadHtmlChart for ASP.NET AJAX
Summarize with AI:
Zooming and scrolling are not merely feature requests about the RadHtmlChart but capabilities which can be achieved with the control now. The introduction of the Data Navigation functionality in Q3 2013 lets you zoom and scroll your visualized data over time.
What are the Data Navigation and the Stock Layout?
The terms “Data Navigation Functionality” and “Stock Layout” refer to the one and the same setup of RadHtmlChart that lets you:
- zoom and scroll particular time frames with the Navigator pane.
- plot data for the selected time range from the Navigator pane in the main chart.
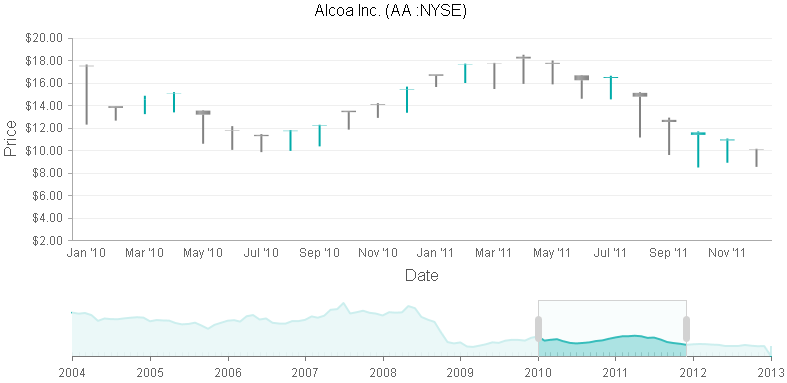
Here is how the Stock Layout looks like:
How to Configure the Data Navigation Functionality in RadHtmlChart
- Create a regular instance of RadHtmlChart and set its Layout property to “Stock”.
- Bind the chart to a data source that contains DateTime field for the XAxis and numeric field/fields used for the YAxis.
- Add the Navigator tag in the chart and create inside it a supported series type that loads data from the already bound data source.
Optionally you can fine tune the main chart and the Navigator pane through their properties.
Here is how a simple setup could look like:
<telerik:RadHtmlChart ID="RadHtmlChart1" runat="server" Width="750px" Height="400px" Layout="Stock" DataSourceID="myDataSourceID"> <Navigator> <Series> <telerik:LineSeries DataFieldY="Close"></telerik:LineSeries> </Series> <RangeSelector From="2007/01/01" To="2010/12/31" /> </Navigator> <PlotArea> <Series> <telerik:CandlestickSeries DataOpenField="Open" DataHighField="High" DataLowField="Low" DataCloseField="Close"></telerik:CandlestickSeries> </Series> <XAxis Type="Date" DataLabelsField="Date"> </XAxis> </PlotArea></telerik:RadHtmlChart>
Supported Series in the Main Chart and the Navigator
The supported series types in the main chart and in the Navigator are the following:
You can use the above series types in any combination (e.g. the main chart can use Candlestick series while the Navigator can use Area series and vice versa).
Now, let's try a short tutorial that will illustrate how to integrate a RadHtmlChart with a Stock Layout with several other controls to get:
An Interactive Stock Chart with RadTabStrip, RadHtmlChart and RadGrid
We are going to create an interactive Stock Chart (i.e., a chart that displays the open, high, low and close prices of a stock) with RadTabStrip, RadHtmlChart and RadGrid controls as follows:
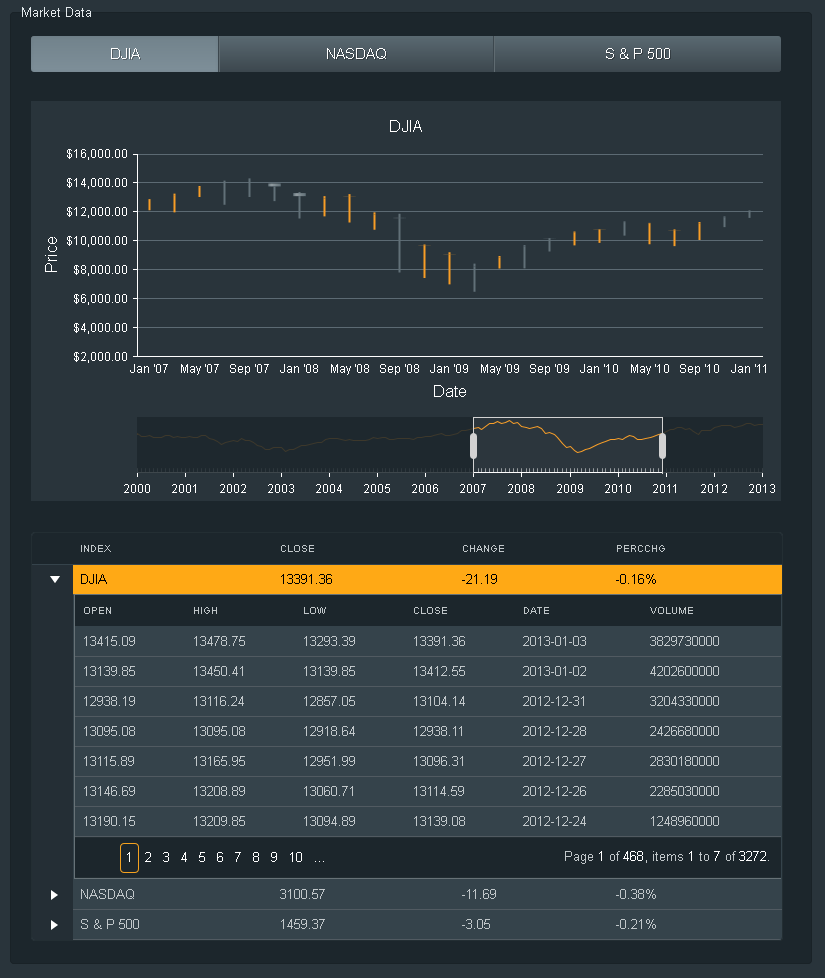
- RadTabStrip will display the names of three of the major US stock market indexes - DJIA, NASDAQ and S & P 500 in separate tabs.
- RadHtmlChart will visualize the data for the selected stock index from the RadTabStrip for a particular time frame (i.e. 1999/12/31 – 2013/01/03). The main chart will use Candlestick series while the Navigator pane will use Line series. The data for each index is taken from an XmlDataSource.
- RadGrid will manage the data as follows:
- Latest Close, Change and Percentage Change prices for the three indexes will be displayed in the MasterTableView. The data is taken from an XmlDataSource.
- All the data from the chart's data source - Open, High, Low, Close and Date fields, including the Volume field will be displayed in the DetailTable.
A relation between the RadTabStrip and the RadGrid will also be created, so that when a particular Tab is clicked, the corresponding row from the RadGrid will be selected and vice versa.This is done via the client-side API and event the controls offer.
The final result is this layout:
RadTabStrip’s Configuration
We have already mentioned that the RadTabStrip contains three Tabs that are named of the used indexes –DJIA, NASDAQ and S & P 500. We only need to add the server-side event – OnTabClickwhere the data source and the title for the chart can be switched when a Tab is clicked:
protected void RadTabStrip1_TabClick(object sender, RadTabStripEventArgs e) { RadTab TabClicked = e.Tab; string currIndex = TabClicked.Text; switch (currIndex) { case "DJIA": RadHtmlChart1.ChartTitle.Text = "DJIA"; RadHtmlChart1.DataSourceID = "DJIADataSource"; TabClicked.Selected = true; break; case "NASDAQ":... } }
RadGrid’s MasterTableView Configuration
The MasterTableView is configured to display only the latest prices for the indexes as follows:
<MasterTableView Width="100%" DataKeyNames="Index" ClientDataKeyNames="Index" AllowMultiColumnSorting="false" Name="MasterTableView1"> <Columns> <telerik:GridBoundColumn SortExpression="Index" HeaderText="Index" HeaderButtonType="TextButton" DataField="Index"> </telerik:GridBoundColumn> <telerik:GridBoundColumn SortExpression="Close" HeaderText="Close" HeaderButtonType="TextButton" DataField="Close"> </telerik:GridBoundColumn> <telerik:GridBoundColumn SortExpression="Change" HeaderText="Change" HeaderButtonType="TextButton" DataField="Change"> </telerik:GridBoundColumn> <telerik:GridBoundColumn SortExpression="PercChg" HeaderText="PercChg" HeaderButtonType="TextButton" DataFormatString="{0}%" DataField="PercChg"> </telerik:GridBoundColumn> </Columns></MasterTableView>
The ClientDataKeyNames property is set to the name of the "Index" column, so we can easily obtain this value on the client through getDataKeyValue() method later on.
The row selection will be enabled only for the MasterTableView by:
- Setting ‘true’ value for the ClientSettings.Selecting.AllowRowSelect property.
- Handling the server-side ItemDataBound event of the RadGrid where the row selection will be enabled only for the MasterTableView:
protected void RadGrid1_ItemDataBound(object sender, GridItemEventArgs e){ if (e.Item is GridDataItem && e.Item.OwnerTableView.Name != "MasterTableView1") { e.Item.SelectableMode = GridItemSelectableMode.None; } else if (!IsPostBack == true && e.Item is GridDataItem && e.Item.OwnerTableView.Name == "MasterTableView1" && e.Item.ItemIndex == 0) { e.Item.Selected = true; }}Note the "else if" statement in the ItemDataBound event - it is the place where the first row of the MasterTableView is selected only on the initial page load.
RadGrid’s DetailTable Configuration
The data that is visualized in the RadHtmlChart will be shown in the DetailTable, so that it can be seen in tabular view:
<DetailTables> <telerik:GridTableView DataKeyNames="Close" Name="Close" Width="100%"> <Columns> <telerik:GridBoundColumn SortExpression="Open" HeaderText="Open" HeaderButtonType="TextButton" DataField="Open"> </telerik:GridBoundColumn> <telerik:GridBoundColumn SortExpression="High" HeaderText="High" HeaderButtonType="TextButton" DataField="High" UniqueName="High"> </telerik:GridBoundColumn> <telerik:GridBoundColumn SortExpression="Low" HeaderText="Low" HeaderButtonType="TextButton" DataField="Low" UniqueName="Low"> </telerik:GridBoundColumn> <telerik:GridBoundColumn SortExpression="Close" HeaderText="Close" HeaderButtonType="TextButton" DataField="Close" UniqueName="Close"> </telerik:GridBoundColumn> <telerik:GridBoundColumn SortExpression="Date" HeaderText="Date" HeaderButtonType="TextButton" DataField="Date" UniqueName="Date"> </telerik:GridBoundColumn> <telerik:GridBoundColumn SortExpression="Volume" HeaderText="Volume" HeaderButtonType="TextButton" DataField="Volume" UniqueName="Volume"> </telerik:GridBoundColumn> </Columns> </telerik:GridTableView></DetailTables>
This data, however, is different for each index and therefore each DetailTable must be bound to the corresponding data source. The DetailTableDataBind server-side event is used for the purpose:
protected void RadGrid1_DetailTableDataBind(object source, Telerik.Web.UI.GridDetailTableDataBindEventArgs e) { GridDataItem dataItem = (GridDataItem)e.DetailTableView.ParentItem; string currIndex = dataItem.GetDataKeyValue("Index").ToString(); switch (currIndex) { case "DJIA": e.DetailTableView.DataSource = ParseXMLToDataTable(DJIADataSource); break; case "NASDAQ":... } } protected DataTable ParseXMLToDataTable(XmlDataSource currXmlDataSource) { DataSet ds = new DataSet(); XmlDocument XmlDocument1 = currXmlDataSource.GetXmlDocument(); System.IO.StringReader xmlSR = new System.IO.StringReader(XmlDocument1.InnerXml); ds.ReadXml(xmlSR); return ds.Tables[0]; }
Note that when implementing a DetailTableDataBind event handler, you should construct a detail data source (list of objects) that the detail table view displays. That is the purpose of the custom method - ParseXMLToDataTable().
The Client-side Interaction between TabStrip, RadHtmlChart and RadGrid
Since the RadHtmlChart’s data source is switched in the TabStrip’s OnTabClick event, the only interaction that must be created is the relation between the tabs' clicking and the grid rows' selection. The following client-side events are handled:
- RadTabStrip’s OnClientTabSelected event – The target index of the clicked tab is obtained from the name of the tab. Then we can make an iteration through the RadGrid’s rows until the target index matches the value from the grid’s “Index” column. The last step is to select this row:
function OnClientTabSelected(sender, eventArgs) { var targedIndexName = eventArgs.get_tab().get_text(); var grid = getGridReference(); var MasterTable = grid.get_masterTableView(); var gridRows = MasterTable.get_dataItems(); for (var i = 0; i < gridRows.length; i++) { var currIndexName = gridRows[i].getDataKeyValue("Index"); if (currIndexName == targedIndexName) { grid.remove_rowSelected(OnRowSelected); MasterTable.selectItem(i); grid.add_rowSelected(OnRowSelected); } }
- RadGrid’s OnRowSelected even – The target index is be obtained from the selected row of the grid in the “Index” column. Then we can reference the TabStrip, find the target tab by its name and click it:
function OnRowSelected(sender, eventArgs) { var indexName = eventArgs.get_gridDataItem().getDataKeyValue("Index"); var tabStrip = getTabStripReference(); var tab = tabStrip.findTabByText(indexName); tabStrip.remove_tabSelected(OnClientTabSelected); tab.click(); tabStrip.add_tabSelected(OnClientTabSelected);}
Note that the OnRowSelected event is detached just before selecting the grid row and then it is attached again. The same is with the OnClientTabSelected event – it is detached just before the tab is clicked and then it is attached again. This manipulation is needed in order to avoid recursive calling of both events.
Excited About Implementing RadHtmlChart in your Applications?
The Data Navigation functionality is useful for displaying large sets of data over time that let you zoom and scroll to particular time ranges. We have demonstrated how to configure a sample Stock Chart by configuring the Data Navigation functionality of the RadHtmlChart and then integrate that chart in a scenario with RadTabStrip and RadGrid controls. Now it is time to go ahead and make your own implementation of the RadHtmlChart in an interactive application.
Don’t forget to download the demo that showcases this feature from here.

Danail Vasilev
Danail Vasilev is a Tech Support Engineer at Telerik’s ASP.NET AJAX Division, where he is mainly responsible for RadHtmlChart, RadGauge and RadButton controls. He joined the company in 2012 and ever since he has been responsible for providing help to customers of Telerik UI for ASP.NET AJAX suite and improving the online resources. Apart from work he likes swimming and reading books.

