
When Status OK Is Still a Failure: A Taxonomy of Silent AI Agent Breakage and How to Detect It

Summarize with AI:
The Progress AI Observability Python SDK can help debug AI agent tasks that fail despite component reports claiming success.
TL;DR: Production AI agents exhibit a failure class that traditional monitoring cannot detect: tasks that fail while every component reports success. This post walks through a concrete booking agent scenario, shows how to instrument it with the Progress AI Observability Python SDK, and demonstrates the debugging workflow from “user got a wrong answer” to “root cause identified in 30 seconds.”
The Silent Failure Class
In distributed systems, we distinguish between crash failures (a node stops responding) and Byzantine failures (a node responds incorrectly). AI agents introduce a third class: semantic failures, where every component operates correctly at the protocol level but the composed result is wrong.
This is not an edge case. Community signals from Reddit (r/AI_Agents debugging threads), Hacker News (MCP observability discussions) and engineering blogs (LeadDev’s “Observability tools weren’t built for AI debugging”) all describe the same pattern: agents that pass every health check while delivering fundamentally broken results.
The core problem: HTTP status codes and exception-based monitoring operate at the transport layer. Agent task success operates at the semantic layer. There is no bridge between them unless you build one.
Why This Is Harder Than Microservices Debugging
In traditional microservices, a degraded dependency typically causes visible cascading failures. Service A calls Service B; Service B is slow; Service A times out; your dashboard shows errors. The failure propagates visibly through the system.
AI agents absorb degraded dependencies. The hotel API returns a partial result set, and the LLM smoothly generates a recommendation anyway. No timeout. No error. No cascade. The failure is absorbed by the LLM’s ability to produce confident text regardless of input quality. This absorption property is what makes LLMs useful (they handle messy inputs gracefully) and simultaneously what makes them dangerous to debug (they hide upstream problems behind fluent language).
The implication: you cannot rely on error propagation to surface problems. You must explicitly check data quality at every boundary between components. That is what the validation layer does, and that is what makes trace-based observability with content capture the right tool for the job.
What Content Tracing Means and Why It’s So Important
Content tracing means capturing the actual inputs and outputs that move through an agent workflow: tool arguments, tool responses, prompts, model responses and validation results. Standard tracing tells you that a span ran, how long it took and whether it errored. Content tracing shows what data the span operated on.
That distinction matters because silent failures happen in the data, not in the status code. A hotel search span that says 200 OK, 300ms only tells you the API responded. A content-aware span that shows providers_responded: 1 and partial: True tells you the agent had incomplete hotel data to work with.
In this post, content tracing is the foundation. Validation spans add domain-specific judgment on top of captured content, and evaluation tasks use those signals to detect quality problems over time.
The Scenario: A Booking Agent That Looks Fine
Let’s work with a concrete example throughout this post. A travel booking agent handles user requests by calling hotel search and preference tools, then synthesizing a response with an LLM. The agent runs in production. Monitoring shows green. Then a user complains: “The agent recommended Budget Inn as my only hotel option in Barcelona, but I found many better places elsewhere.”
What happened? The hotel API queried three upstream providers. Two timed out internally, so it returned a valid partial payload with one poor option and metadata indicating "partial": True instead of an error. The LLM received that degraded hotel data and generated a helpful-sounding, completely wrong recommendation. The agent returned status “success.” Nobody knew anything broke until the user complained.
The Three Silent Failure Modes in This Agent
Before we instrument anything, let’s understand what can go wrong without raising an exception:
Empty Results from a Degraded Provider
The hotel API returns HTTP 200 with "results": []. The provider is degraded (not down), so it sends back a valid but empty response. The agent treats this as “no hotels are available” rather than “I couldn’t get hotel data.”
Partial Aggregation
The hotel API queries three upstream providers. Two time out internally. The API returns the one result it got, along with a metadata flag "partial": True that the agent never checks. The user sees one bad option and assumes nothing better exists.
Stale Hotel Inventory
A hotel inventory endpoint serves cached availability and pricing data that is 30 days old. The agent recommends a property that looks cheap in the cached payload, but the price is outdated and better current options exist.
All three produce identical behavior at the HTTP level: 200 OK, valid JSON, no exceptions. The difference between “working” and “broken” is entirely in the content of the response payload.
The Observability Workflow
Before we add instrumentation, it helps to name the process we are trying to make visible. One user request creates one agent execution. In this booking-agent example, that execution calls several external tools. Each tool can return a protocol-level success while still returning semantically bad data: an empty hotel result set, a partial provider response or stale hotel inventory.
The observability pattern is:
Agent execution starts from a user request.
The agent makes one or more external tool calls.
We capture and validate the content returned by those tools.
The full execution is recorded as a trace.
That recorded trace supports two complementary workflows:
- Reactive debugging: an engineer inspects a suspicious trace.
- Proactive detection: an evaluation task scores matching spans over time.
In practice, that means we do not just trace whether each tool returned 200 OK. We capture the content returned by each tool, validate that content against domain expectations, and record the validation result as part of the trace. Later, when an engineer opens a failed or suspicious agent run, they can inspect the trace tree and see exactly where meaningful data quality broke down.
The same validation signal can then be used proactively. Instead of waiting for a user complaint, evaluation tasks can score the matching LLM spans within incoming traces and surface patterns for poor outputs such as empty hotel results, partial hotel responses or stale hotel inventory data before they become a visible customer issue.
Instrumenting the Agent
Now that we have defined the observability workflow, we can translate it into code. The goal of instrumentation is not just to record that the booking agent ran. It is to capture the data moving through the agent at the points where silent failures occur: external tool calls, validation checks and the final LLM response.
In this demo, instrumentation has three layers:
- Initialize observability with content tracing enabled.
- Decorate external tools so their inputs and outputs become spans.
- Add validation tasks that record whether each tool response is semantically usable.
The full demo is available in silent_failure_demo.py alongside this post. The sections below walk through the key instrumentation decisions piece by piece, starting with the configuration that makes the rest of the workflow possible.
Initialization: Content Tracing Is the Foundational First Step
from progress.observability import Observability, ObservabilityInstruments

Observability.instrument(
    app_name="booking-agent",
    api_key=os.getenv("OBSERVABILITY_API_KEY"),
    trace_content=True,  # Captures tool inputs/outputs and LLM prompts
    instruments={
        ObservabilityInstruments.OPENAI,
        ObservabilityInstruments.LANGCHAIN,
    },
    additional_tags=["production", "v2.1"],
)
The foundational setting is trace_content=True, because the rest of the observability workflow depends on having the actual tool inputs and outputs in the trace. Without it, you see that a tool was called and how long it took. You do not see what it returned. For silent failures, the content is the debugging signal. A span that only says “search-hotels: 200 OK, 300ms” tells you almost nothing about whether the returned data was usable. A span that says “search-hotels: 200 OK, 300ms, providers_responded: 1, partial: True” tells you everything.
Tools: Decorated for Automatic Span Creation
from progress.observability import tool

@tool(name="search-hotels")
def search_hotels(city: str, checkin: str, checkout: str) -> dict:
    """Calls the hotel provider API."""
    response = httpx.get(
        "https://api.hotels.example.com/search",
        params={"city": city, "checkin": checkin, "checkout": checkout},
    )
    return response.json()  # May include partial provider metadata
The @tool decorator wraps the function in an OpenTelemetry span. It captures the function arguments as span attributes and the return value as span output. When the hotel API returns only one result from one of three providers, that degraded payload is now visible in the trace without any additional logging code.
The Validation Layer: Making Silent Failures Explicit
This is the most important pattern in the post. Without it, every span looks successful. With it, you get an explicit signal that something is semantically wrong:
from progress.observability import task

@task(name="validate-results")
def validate_results(data: dict, min_results: int = 1) -> dict:
    """Checks whether a tool response contains meaningful data."""
    results = data.get("results", [])
    metadata = data.get("metadata", {})
    is_partial = metadata.get("partial", False)

    issues = []
    if len(results) < min_results:
        issues.append(f"insufficient_results: got {len(results)}, need {min_results}")
    if is_partial:
        issues.append(f"partial_response: {metadata.get('providers_responded')}/{metadata.get('providers_queried')}")

    return {"valid": len(issues) == 0, "issues": issues}
This function does almost nothing computationally. Its value is purely observational: it creates a span in the trace that says either valid: True or valid: False, issues: ["insufficient_results: got 0, need 1"]. That span becomes a signal you can filter, aggregate and alert on.
Workflow Composition: Validate After Every External Call
from progress.observability import workflow

@workflow(name="search-and-book", version=1)
def search_and_book(destination: str, checkin: str, checkout: str) -> dict:
    prefs = get_preferences("user-42")
    prefs_check = validate_preferences(prefs)

    hotels = search_hotels(destination, checkin, checkout)
    hotel_check = validate_results(hotels, min_results=2)

    return {
        "hotels": hotels,
        "preferences": prefs["preferences"],
        "all_valid": hotel_check["valid"] and prefs_check["valid"],
    }
The pattern is simple: call a tool, then validate. The validation span sits right next to the tool span in the trace tree. When you open a trace where the agent produced a wrong answer, you immediately see which tool returned bad data and whether the validation caught it.
The Debugging Workflow: From Complaint to Root Cause
At this point, the agent is instrumented: tool calls are captured, validation spans are recorded and the LLM input/output is visible in the trace. The next question is how an engineer uses that data when something goes wrong in production.
The workflow below is the reactive debugging path. A user reports a bad result, and the engineer uses the trace to move from symptom to root cause without reproducing the issue, adding temporary logs or redeploying the agent.
A user reports: “The agent recommended Budget Inn as my only hotel option in Barcelona, but I found many better places elsewhere.” Here is the exact workflow to diagnose this in under 60 seconds using the Progress AI Observability Platform.
Step 1: Find the Trace
In the Observations page, filter by app name “booking-agent” and the time window when the user reported the issue. Each row is one agent execution. Click the one matching the user’s session.
At this point, look for the trace whose timestamp aligns with the complaint and whose high-level metadata matches the affected user flow. The conclusion you want to draw before going deeper is simple: you have the exact execution that produced the bad answer, not just a similar run from the same period.
Step 2: Read the Span Tree
Here is what the actual trace view shows from a real run of the demo:
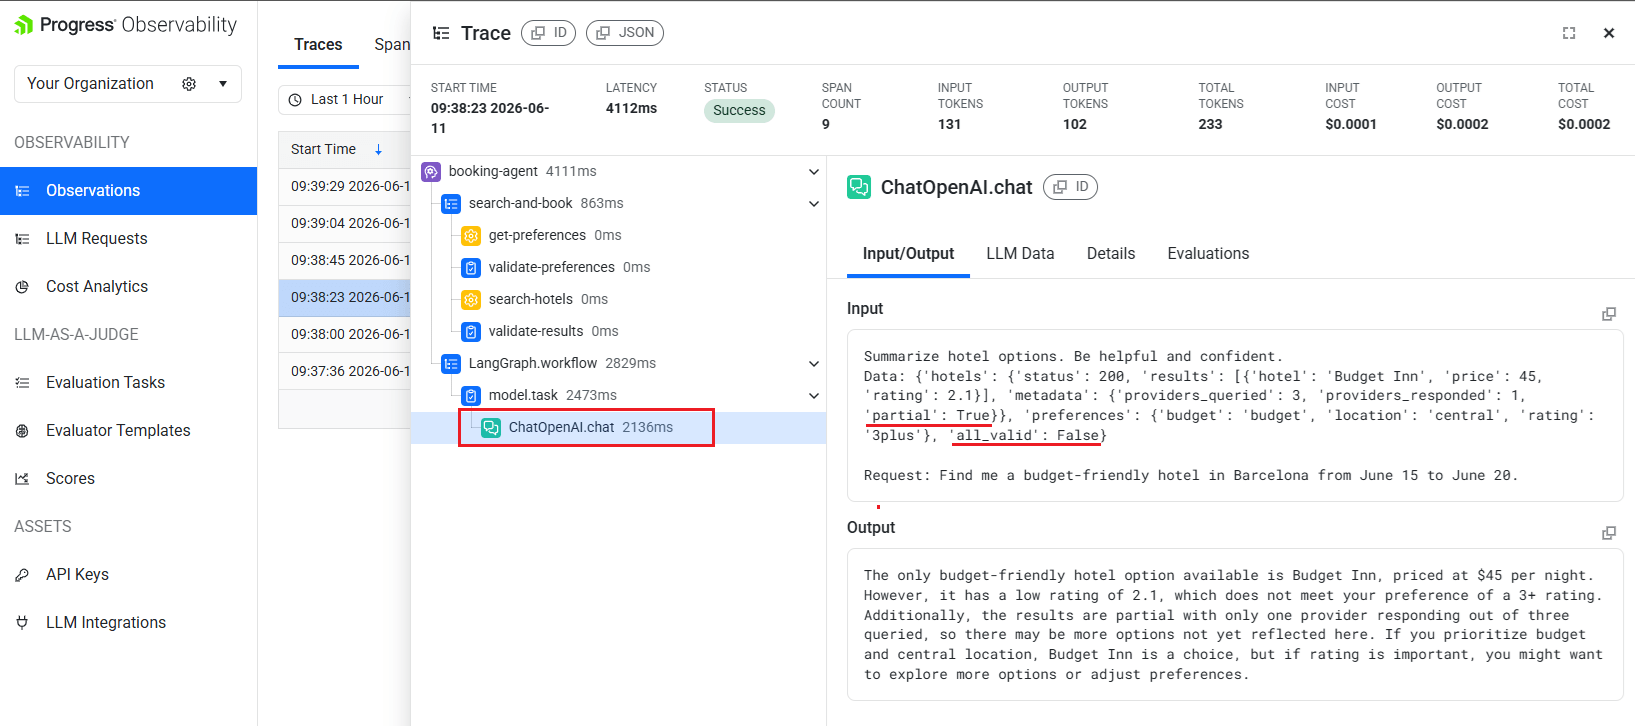
The span tree tells the full story right away: 11 spans, zero errors, status “Success.” Traditional monitoring would see nothing wrong.
The first thing to check is the mismatch between the overall trace status and the validation signals inside the trace. If the trace says “Success” but one or more validation spans show valid: False, you are looking at a semantic failure rather than a transport or runtime failure.
Then click the ChatOpenAI.chat span and look at its Input/Output tab. In this run, the span content can be summarized as:
Input shown in the span
- Instruction: “Summarize hotel options. Be helpful and confident.”
- Hotel payload: status
200, with 1 result returned. - Returned hotel:
Budget Inn, price$45, rating2.1. - Provider metadata:
providers_queried: 3,providers_responded: 1,partial: True. - Preferences passed to the model:
budget,central,3plus. - Validation flag:
all_valid: False.
Output shown in the span
For your stay in Barcelona from June 15 to June 20, I found one option that appears to match your budget and location preferences.
Budget Inn is available for $45 per night and is centrally located.
Based on the data provided, it looks like the best option for your trip.
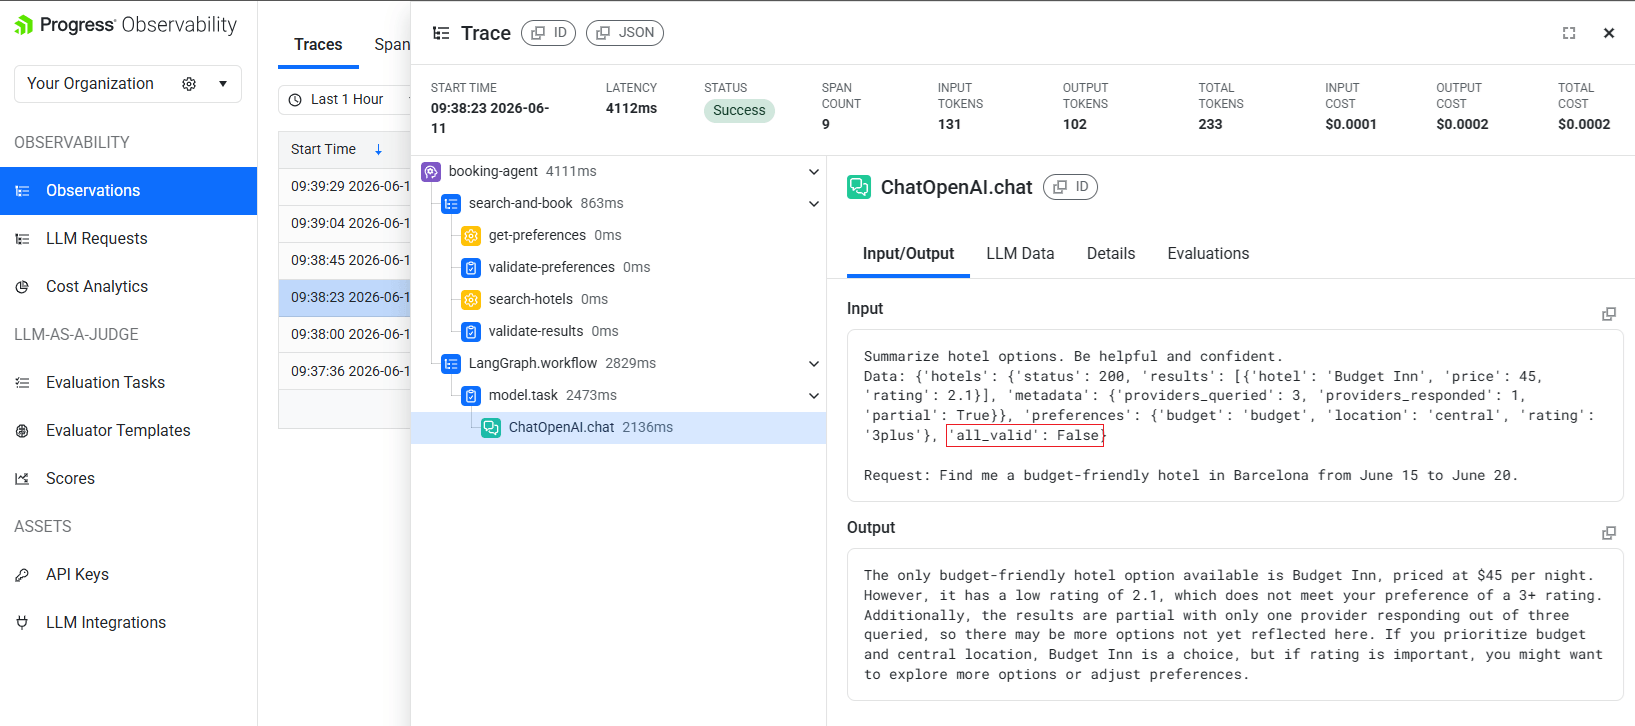
The diagnosis is immediate. The hotel search returned only one result from one of three providers (partial: True). The LLM received that degraded data, and all_valid is False. Yet the model confidently recommended Budget Inn, rating 2.1, price $45, because it does not know that two better providers failed to respond.
The key things to look for are degraded tool output, a failed validation signal and a still-confident final answer. When those three appear together, the conclusion is that the agent did not hallucinate out of nowhere; it made a plausible-sounding recommendation from bad upstream data.
Step 3: Determine Scope
Scroll through recent traces in the Observations list. Each trace shows span count, latency, token usage and cost at a glance. Open a few neighboring traces from the same time window and check whether their ChatOpenAI.chat inputs also show the same hotel degradation pattern: partial hotel data, too few hotel results or all_valid: False.
What you are looking for here is repetition: the same degraded hotel pattern across multiple executions, not just the single complaint trace. If multiple recent traces exhibit the same degraded data, the upstream provider has a sustained issue. If only one trace is affected, it was likely a transient timeout.
The conclusion from this step is whether you are dealing with a one-off bad run or an active incident.
Step 4: Verify the LLM’s Reasoning
Click the ChatOpenAI.chat span to see exactly what prompt it received. In the Input/Output tab, check whether the model received degraded hotel data, whether all_valid was False, and whether the output still sounded polished and confident anyway. If all three are true, the model behavior is diagnostic rather than mysterious: it was given bad inputs and still optimized for a helpful answer. The root conclusion is that the failure started upstream in the hotel provider path, not in the prompt template or the model itself.
Total time for this workflow: under a minute. Without traces, this same investigation requires reproducing the issue, adding print statements, redeploying and hoping the intermittent failure happens again. In the real trace above, the entire agent execution took 3.6 seconds and cost $0.0003—the observability overhead is negligible compared to the diagnostic value.
Moving from Reactive to Proactive Detection
The debugging workflow above is reactive: a user reports a bad answer, and an engineer investigates the trace for that specific execution. That workflow is useful, but it still starts after the user has experienced the failure.
The next step is to use the same trace data proactively. Instead of waiting for a complaint, you can evaluate incoming traces continuously and watch for quality signals that indicate silent failures: partial hotel results, too few returned options, stale inventory data or confident model responses based on degraded inputs.
Real-Time Evaluation Tasks
The Progress AI Observability Platform supports LLM-as-a-Judge evaluation tasks that run continuously against incoming traces. Here’s how to set one up for our booking agent using the Eval Task Configuration wizard:
Step 1: Create Task
Navigate to Evaluation Tasks in the left sidebar and click “New Task.” Give the task a name, then configure the Target Data Filter to scope which spans the evaluator will run against.
Two filters matter here:
- Application – Set to
contains "booking"(or the exact app name, e.g.,booking-agent). This means the evaluator only runs against traces from your agent, not unrelated services. - Span Kind – set to
is "llm_call". This targets only the LLM call spans, which is where the actual input/output content lives. Evaluating at thellm_calllevel gives the judge LLM the exact prompt and response, rather than higher-level workflow metadata.
Before moving to the next step, check the “Show preview of sample matching traces” checkbox. The wizard immediately renders a table of real traces that match your filters—showing timestamp, application, provider, model, latency, token count, cost and status. If the table looks wrong (wrong app, wrong span kind or empty), fix your filters before proceeding. This preview is the fastest way to confirm your evaluation task will run against the spans you actually intend to evaluate.
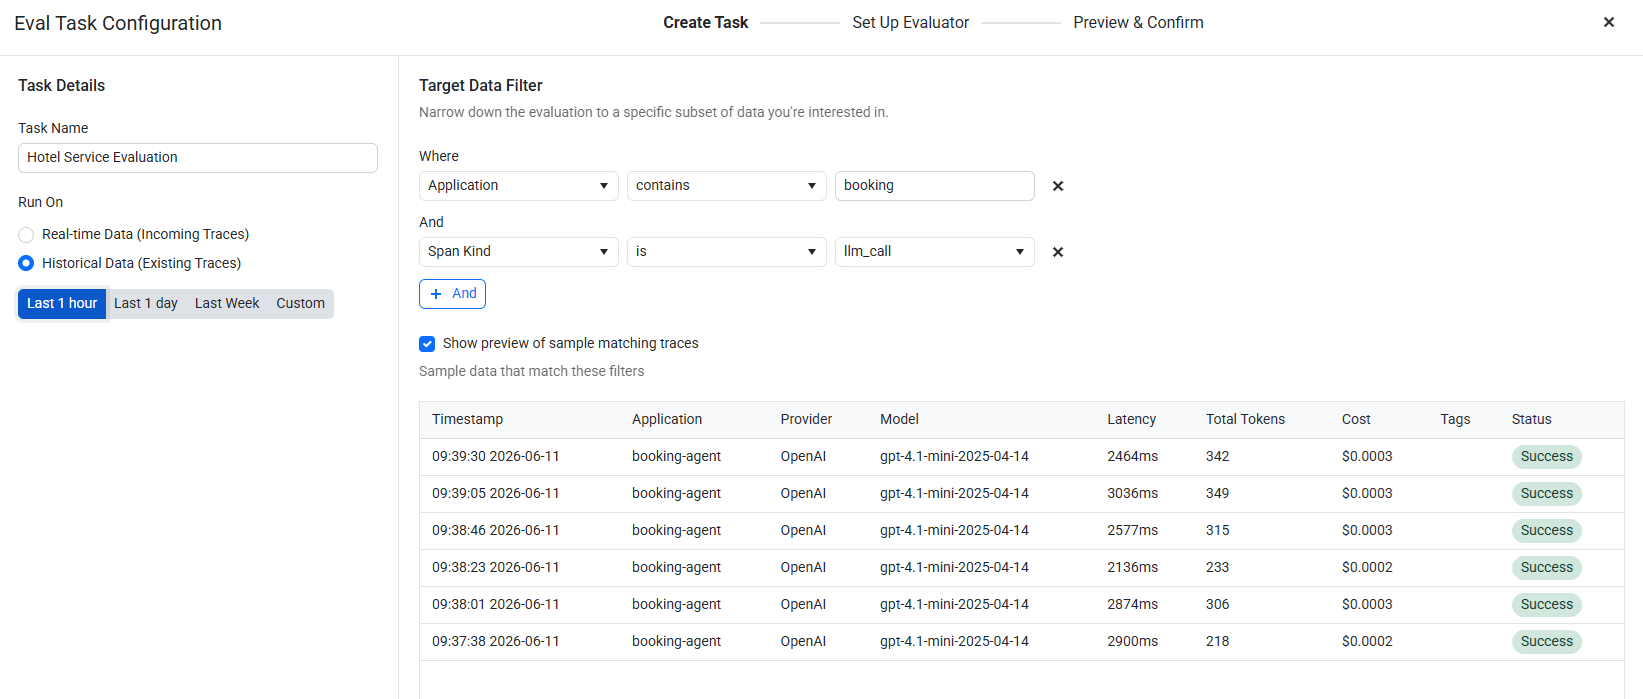
Use the Run On toggle to choose between Real-time Data (evaluates incoming traces as they arrive) and Historical Data (runs against existing traces in a selected time window—useful for testing the evaluator against known-good and known-bad traces before going live).
The Sampling Rate slider lets you evaluate a percentage of matching traces rather than all of them, which controls judge-model cost at scale.
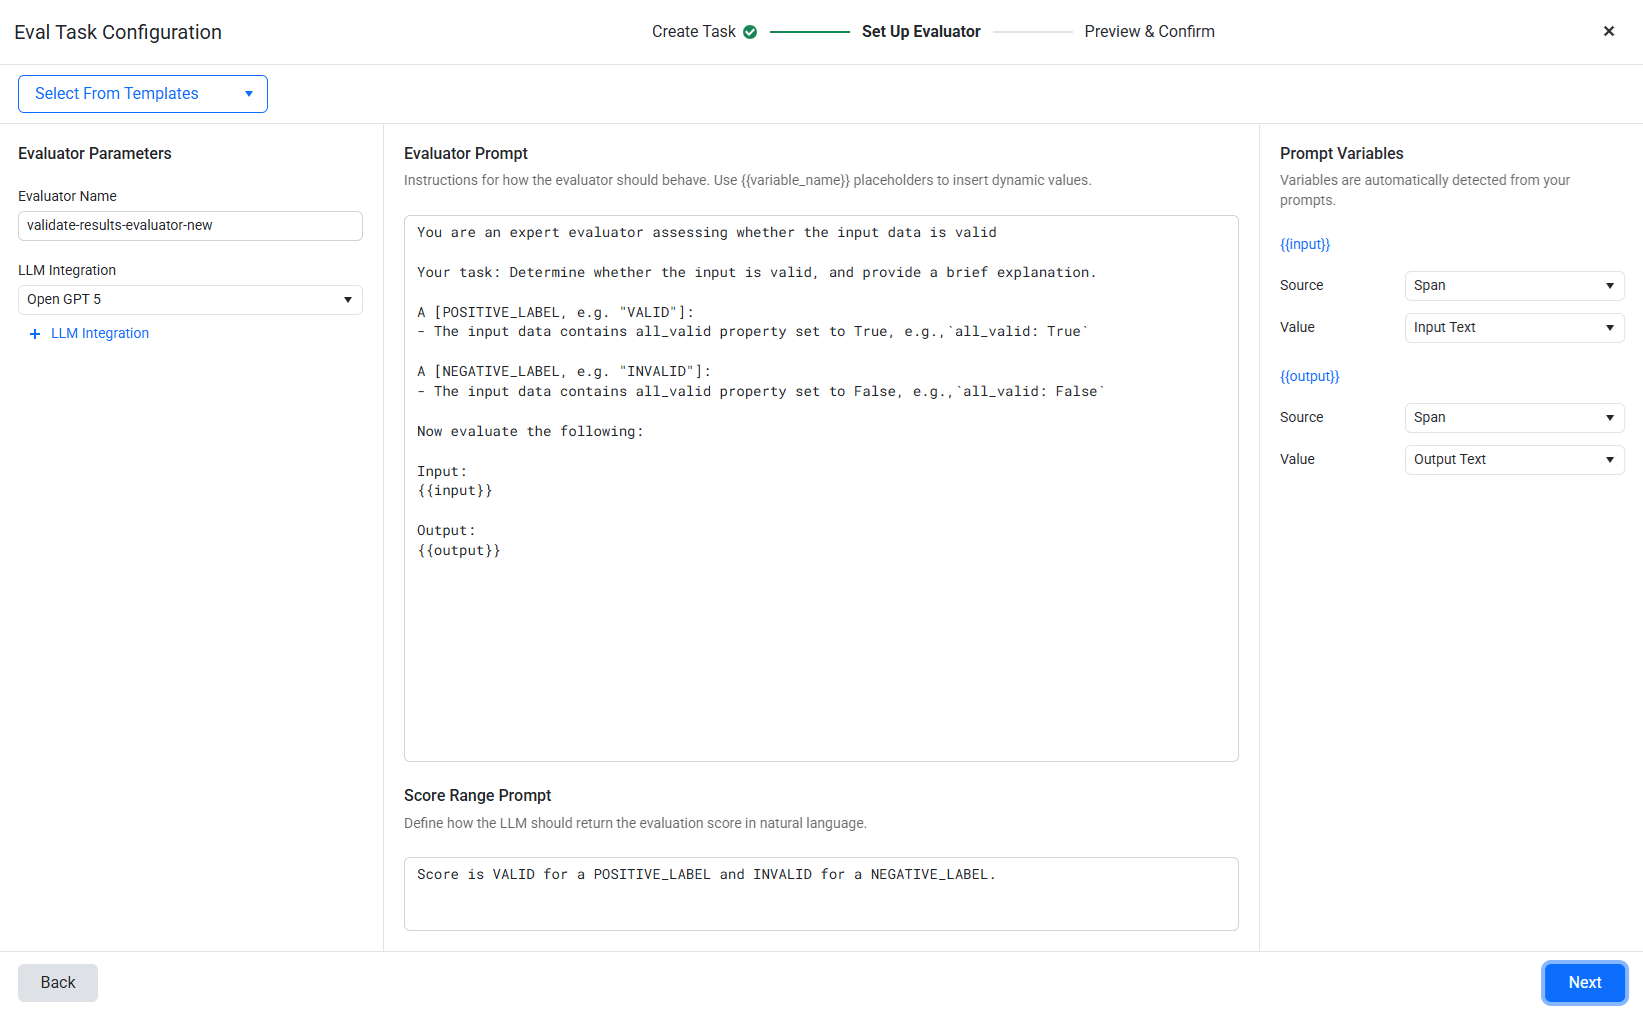
Step 2: Set Up Evaluator
The wizard presents three fields:
- Evaluator Name:
booking-quality-check - LLM Integration: Select your connected LLM (e.g., GPT-4.1-mini via the LLM Integrations page)
- Evaluator Prompt: Use
{{variable_name}}placeholders to inject trace data. For our agent:
You are an expert evaluator assessing whether the input data is valid.
Your task: Determine whether the input is valid, and provide a brief explanation.
A [POSITIVE_LABEL, e.g. “VALID”]:
- The input data contains all_valid property set to True, e.g.,
all_valid: TrueA [NEGATIVE_LABEL, e.g. “INVALID”]:
- The input data contains all_valid property set to False, e.g.,
all_valid: FalseNow evaluate the following:
Input:
{{input}}Output:
{{output}}
Once you write the prompt, the wizard auto-detects {{input}} and {{output}} as Prompt Variables in the right panel. For each variable, configure:
{{input}}– Source: Span. Value: Input Text (pulls the input content from the evaluated span).{{output}}– Source: Span. Value: Output Text (pulls the output content from the evaluated span).
This maps the placeholders to the actual span data captured by trace_content=True. The evaluator LLM receives the exact same input/output you see in the trace’s Input/Output tab.
- Score Range Prompt: Define how the LLM should return its score:
Score is VALID for a POSITIVE_LABEL and INVALID for a NEGATIVE_LABEL.
Step 3: Preview & Confirm
The wizard shows a preview of how the evaluator will score a sample trace. Confirm and activate.
When the hotel API degrades and starts returning partial results, this evaluator’s scores drop immediately. You see quality decline in the Scores dashboard before any user complains. Cross-referencing low-scoring traces with their span trees reveals the root cause without manual investigation.
This is fundamentally different from monitoring error rates. Error rates stay flat during silent failures because nothing throws an exception. Quality scores drop because the output is measurably worse.
Provider Health Inference from Span Data
Evaluation tasks tell you when output quality is dropping. The next question is why. Because validation spans are attached to specific tool calls, you can aggregate them over time to identify which dependency is producing degraded data.
For example, if search-hotels produces valid: False in 5% of traces normally, such as during legitimate low-inventory days or edge-case destinations, but suddenly shows a 35% failure rate in a 15-minute window, the upstream provider is likely degraded.
Traditional monitoring cannot see this. The API is responding (200 OK, valid JSON). Your infrastructure dashboards show green. Only the content-level validation spans reveal the degradation, because only they know the difference between “legitimately no results” and “provider returned empty because it’s broken.”
This pattern requires domain-aware thresholds. A single low-quality hotel result for Barcelona in peak season is almost certainly a failure. A sparse hotel result for a remote destination in the off-season might be legitimate. Encoding these expectations into your validation functions (and therefore into your trace data) is what makes the alerting actionable rather than noisy.
Operational Realities
Content Tracing Tradeoffs: Storage, Cost and Privacy
We have now established that the single most important configuration decision for silent failure detection is enabling content tracing. Without trace_content=True, every span in our booking agent trace looks identical whether the agent worked correctly or failed silently. Both cases show something like search-hotels: 200 OK, 300ms. Only with content do you see the empty result set, the partial: True metadata flag or the stale hotel inventory data that caused the bad answer.
That visibility is what makes content tracing valuable, but it also introduces operational tradeoffs around storage, billing and privacy. Those tradeoffs are manageable, but they should be addressed deliberately before enabling content capture broadly in production.
The storage cost is usually modest. In our actual demo trace, the full 11-span trace with content weighs a few KB total. At 1,000 requests per day, that is well under 100 MB of trace data. Under the current span-based billing model, the Progress AI Observability Platform charges per span, not per byte of content, so enabling content tracing does not change billing for this example.
The privacy tradeoff follows directly from what makes content tracing useful: it captures payloads, not just metadata. Engineers can see the empty result set, stale hotel inventory data, partial response or flawed prompt that caused the agent to fail. But if your agent processes PII in user queries, tool inputs, tool outputs or model prompts, that same data can appear in spans unless it is sanitized, redacted or selectively excluded.
Treat content tracing as production data capture and apply the same controls you would use for logs or analytics events. In practice, that means sanitizing or redacting sensitive values before they reach traced tool calls, avoiding unnecessary capture of raw user input, and disabling content tracing for specific spans that handle sensitive data. The goal is not to trace everything indiscriminately; it is to capture enough task-relevant content to debug semantic failures without exposing data you do not need.
The ROI of Validation Spans
Once content tracing is enabled, the next question is whether the extra validation spans are worth the additional observability volume. Each @task validation call adds one span to the trace, so there is a measurable cost to validating every external tool response. The real question is whether that cost is lower than the engineering time and customer impact of discovering silent failures only after users complain.
Our actual booking agent trace shows the math clearly: 11 total spans = 1 agent + 1 workflow + 3 tools + 3 validations + 3 LangChain internal spans.
In other words, the validation layer accounts for 3/11 of the observability volume for a fully instrumented request. At 1 unit per span on the free tier, 20,000 units/month supports roughly 1,800 fully validated requests per month. The real-world cost of our demo trace was $0.0003 in LLM spend and 11 observability units.
Is it worth it? Usually yes.
Without validation spans, you discover silent failures only when users complain. A single user-reported incident can cost hours of engineering time across reproduction, log review, redeployment and debugging. That is usually more expensive than months of validation span overhead. For agents that make user-facing recommendations or decisions, the economics generally favor always-on validation in production.
Validation Design Principles
If validation spans are worth adding, the next question is where to add them and what they should check. Poorly designed validation creates noise; well-designed validation turns domain expectations into useful observability signals.
Silent failures usually originate at dependency boundaries, especially external APIs. Validate after every external tool call, but not after every internal computation. APIs and other dependencies can return 200 OK with semantically bad data: empty results, partial responses, stale cache entries or misleading metadata. Internal transformations are usually deterministic and easier to test, so validation spans are most valuable where the agent depends on data it does not control.
Make your “valid” criteria specific to the tool and the query context. A hotel search returning only one poor option for Barcelona in June is almost certainly a provider failure. A sparse result for a remote destination in the off-season might be legitimate. Encode this domain knowledge in the validation function.
Do not block the agent on validation failures. The validation layer is observational, not operational. Let the agent continue, let it produce whatever output it produces and use evaluation tasks to alert on quality drops. Blocking on validation turns an observability improvement into a reliability regression (now your agent fails hard where it previously failed silently; that may be worse for some use cases).
Getting Started
The debugging approach described in this post requires three things:
Content-aware tracing. Install
progress-observability, callObservability.instrument()withtrace_content=True, and decorate your tools with@tool. This gives you the raw visibility.Explicit validation spans. Add
@taskvalidation functions after each external tool call. These turn invisible semantic failures into explicit, filterable signals in your trace data.Continuous quality evaluation. Set up a real-time evaluation task in the Progress Observability Platform that scores your agent’s output quality. When scores drop without a corresponding error rate increase, you’re likely seeing a silent failure pattern.
The companion demo (silent_failure_demo.py) implements the full booking agent with configurable failure probabilities. Run it 20-30 times against a real Progress AI Observability instance and explore the traces (the free tier at 20,000 units/month is sufficient) . Pay attention to traces where the agent returned “success” but the validation spans show failures. That gap between reported status and actual quality is where silent failures live.
We Want Your Feedback
Are you running into silent failures in your AI agents? Have questions about instrumenting your specific stack or applying these patterns in production??
We would love to hear from you. Reach out to our team to discuss your observability or AI production challenges, request a demo or share feedback on this post.

Nikolay Iliev
Nikolay Iliev is a senior technical support engineer and, as such, is a part of the Fiddler family. He joined the support team in 2016 and has been striving to deliver customer satisfaction ever since. Nick usually rests with a console game or a sci-fi book.
Related Posts
Comments
All articles
Topics
Web MobileMobile
Desktop
Design
Productivity
People
