
The Chrome DevTools Sources Panel: Overrides vs FileSystem vs Snippets vs Page

Summarize with AI:
It's easy to view and change any page on the browser with Chrome DevTools. The Sources panel is a powerful component of DevTools—let's dive into it to see how it can help us improve our development.
Chrome DevTools is a set of web developer tools which are built directly into Google Chrome. DevTools aid developers in editing pages on the go and in identifying problems quickly, which enables the developer to builder better websites, faster.
With DevTools, it is easy to view and change any page on the browser just by inspecting its elements and changing the HTML and CSS values. In this post, we will be discussing the DevTools Sources panel and all its components. To get started, let’s first demonstrate how to open DevTools on your browser. There a few ways we can do this, as we’ll list below:
Open DevTools
To open Chrome DevTools, follow any of these steps:
- Use the keyboard shortcuts by running the following commands:
-
Command + Control + Con macOs -
Control + Shift + Con Windows and Linux
-
-
Inspect the page by right-clicking anywhere on the browser and clicking
Inspect -
Use Chrome main menu:
- Click the Chrome menu button
- Select
More Tools - Select
Developer Tools
The Sources Panel
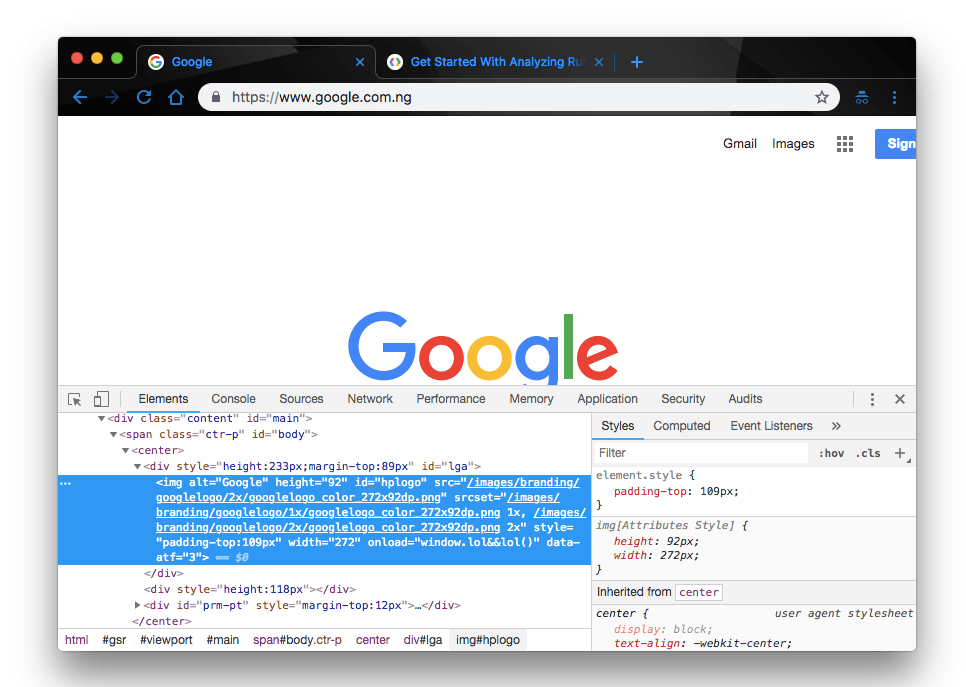
By default, Chrome DevTools opens to the Elements panel as can be seen from the image above. However, in this post we are interested in the Sources panel. Let’s go ahead and switch over to it as we’ll be discussing its components in this post:
Under the Sources panel, we have four distinct components:
- Pages
- Filesystem
- Overrides
- Snippets
As earlier said, we’ll discuss these components in detail to better understand their features and use cases, but first, let’s take a peek at the kinds of actions we can perform with them in the Sources panel. The Sources panel gives us the ability to perform a lot of operations on the browser, some of which are:
- Editing and running CSS and JS files on the fly
- Creating, saving and running code snippets
- Persisting changes across page reloads
- Enabling access to the browser Filesystem
- Debugging and so on
Limitations
As said earlier, the Sources panel has its limitations. They include:
- You cannot save changes made in the DOM Tree of the Elements panel. Hence, you will have to edit HTML in the Sources panel instead.
- If you edit CSS in the Styles pane, and the source of that CSS is an HTML file, DevTools won’t save the changes. Therefore, you will also have to edit the HTML file in the Sources panel.
Now let’s go into these operations in detail under their respective components to give you a clearer understanding. Let’s start with Overrides.
Overrides
Local Overrides let you make changes in DevTools, and keep those changes across page loads. Ordinarily, you would lose any changes made in DevTools when you reload the browser page. However, with Overrides, you can persist these changes and retain them across multiple page reloads. These work for most file types, with a couple of exceptions.
How it works:
- First, you need to specify a directory where DevTools will save the changes made
- When changes are made in DevTools, a modified copy is saved to your directory
- When the page is reloaded, DevTools gives you the local, modified file
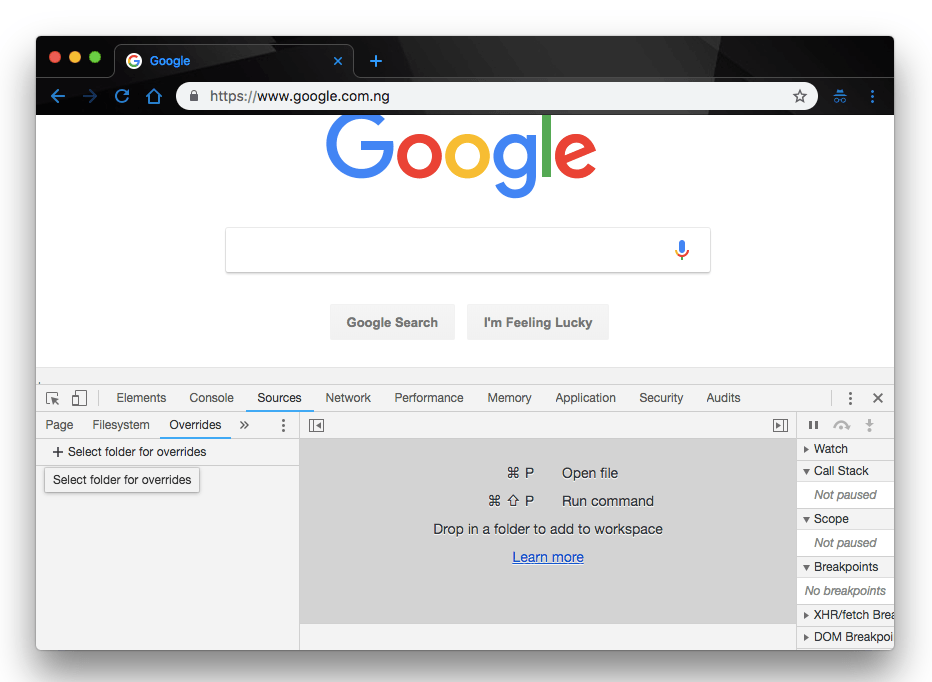
Set up overrides:
- Open the Sources panel
- Open the Overrides tab
- Click Setup Overrides
- Select which directory you want to save your changes to
- At the top of the viewport, click Allow to give DevTools read and write access to the directory
- Make your changes
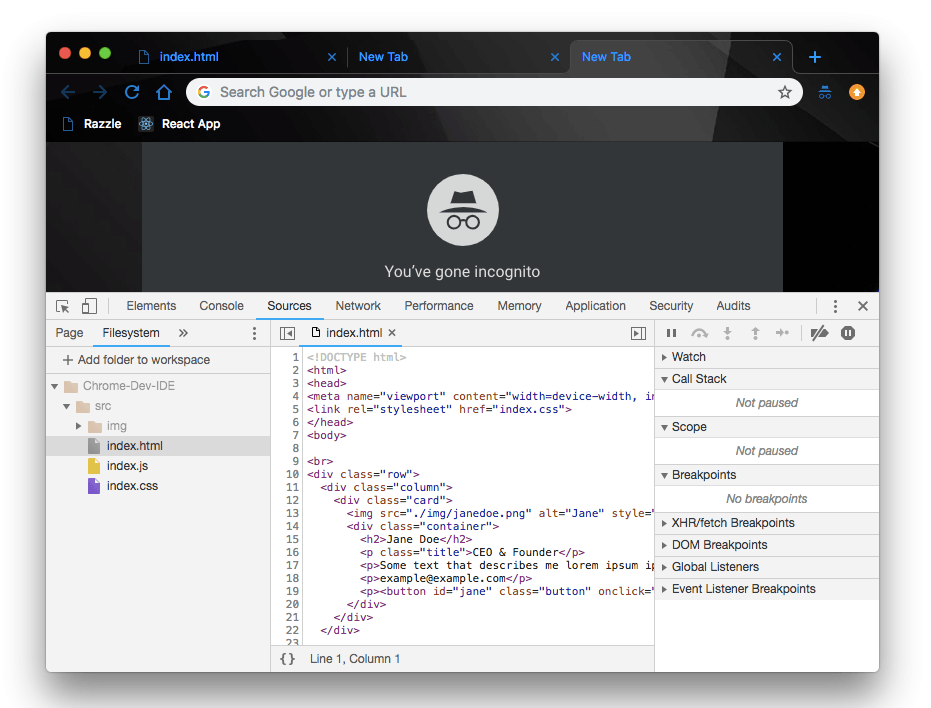
Filesystem
The Filesystem can be referred to as the methods and data structures that DevTools uses to keep track of the way files are organized on a disk. This is also referred to as the disk used to store the files or the type of the Filesystem. Filesystem allows you to add a local folder to your Workspace and edit it on the browser.
Filesystem gives Chrome the ability to serve as an IDE for developers, as it gives us the ability to effect changes to local files.
How it works:
To better understand how it works, let’s open a project folder in Filesystem and make changes to the project files therein.
- Open Google Chrome browser and open your chrome DevTools. (You can use the shortcut
Command + Options + Jon Mac orControl+Shift+Jon Windows to open the console)
Set up Filesystem
To get started, open the DevTools and switch over to the Sources tab:
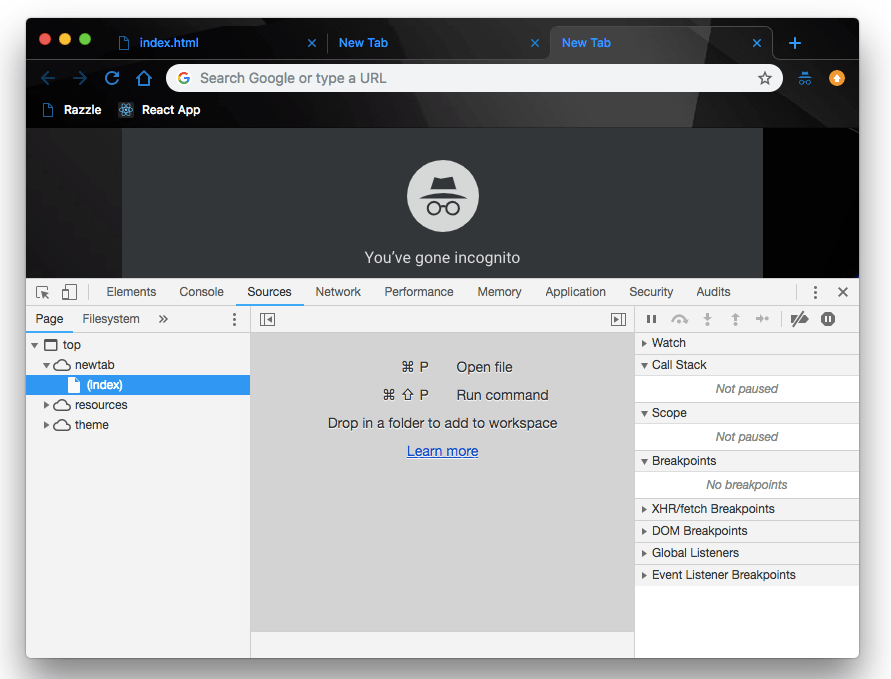
Like the instruction onscreen suggests, we can drag and drop our project folder on the visible workspace window. Once you drag the folder into the workspace, you will get a prompt:

Click allow and your project folder will be properly setup in the Filesystem tab below your Navigator. Now when you click the Filesystem tab, you should be able to see your project files:
Now that our project is correctly set up on Chrome, we can go ahead and make changes to our project files directly from Chrome. First, to keep things simple, let’s play around with the names of our team members.
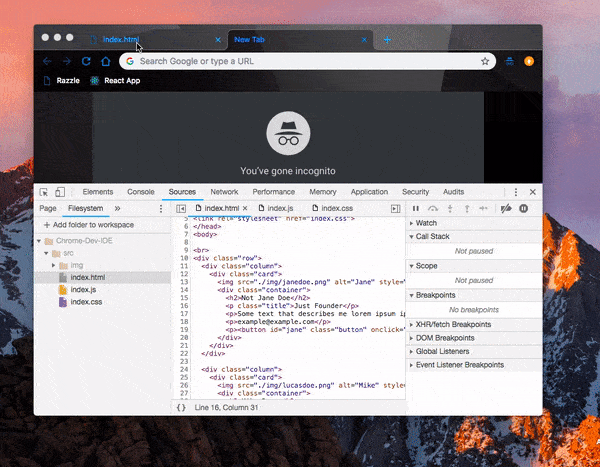
This way, we have been able to update our local project files directly on Chrome. However, we can only do this in the recent versions of Chrome, as it is allowed by default when you click that allow button that was prompted when you dragged your project folder into the Chrome workspace.
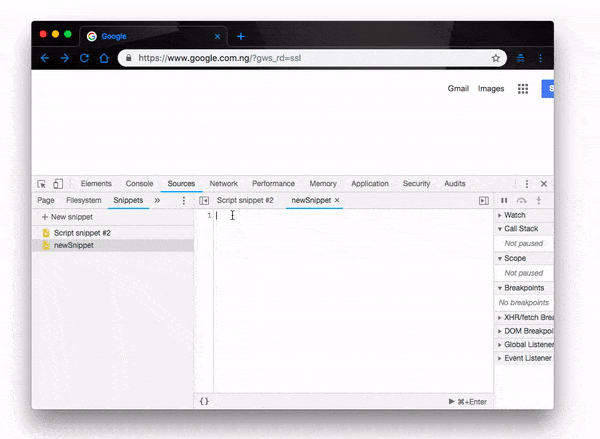
Snippets
These are scripts which you can run, author and execute within the Sources panel of Chrome DevTools. When a Snippet is run, it executes from the context of the current page.
How it works
To create a snippet, follow these simple steps:
- Open Chrome DevTools. You can do this by running one of the following commands:
-
Command + Control + Con macOs -
Control + Shift + Con Windows and Linux - Just right click anywhere on the browser and click Inspect
-
- Once, you’re in the DevTools environment:
- Open the Sources panel
- Click on the Snippets tab
- Right-click within the Navigator
- Select New to create and name a new snippet

Run the Snippet
When you have created a new snippet, enter your code in the provided editor, save the code and run the snippet by right clicking on the snippet and clicking run like so:
Page
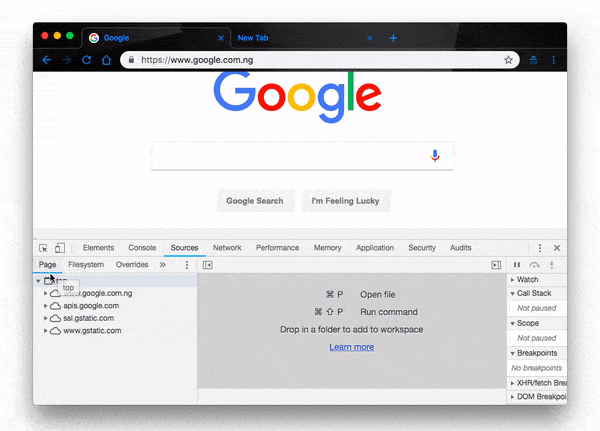
The page tab is used to view all the available resources on the current page. This is mostly helpful for developers to replicate a page structure locally as all the file/folder levels are explicitly exposed in the page tab.
Page structure
When you open a new page in the browser, the Page tab in the Sources panel will organize all the resources of that current page according to the contents of the sidebar:
-
toplevel - represents the main HTML document of the page, it contains all other resource folders. -
The second-level, such as
www.google.com, represents the page origin. - The third-level, fourth-level, as they go, represent directories and resources that were loaded from that origin.
How it works
The project folders contain respective project files containing all the resources that make up the current page.
When you open a project folder and click on a file, it opens up the file in the Editor pane where you can look through the file contents or preview images.
Conclusion
In this post we have individually explained all the components of the Sources panel and reviewed their features and possible use cases. There’s still a lot of information we didn’t cover on Chrome DevTools that promises to enhance your development and design experience, so you would do well to check out the official DevTool documentation for them.
For More Info on Building Great Web Apps
Want to learn more about creating great user interfaces? Check out Kendo UI—our complete UI component library, which allows you to quickly build high-quality, responsive apps. It includes all the components you’ll need, from grids and charts to schedulers and dials.
Christian Nwamba
Chris Nwamba is a Senior Developer Advocate at AWS focusing on AWS Amplify. He is also a teacher with years of experience building products and communities.