Improve Your Debugging Skills with Chrome DevTools

Summarize with AI:
In this post we cover best practices and tips for using Chrome DevTools, which will help you solve your web application development struggles more easily.
Have you ever had trouble with incorrectly executed JavaScript? Have you ever struggled with fine-tuning the CSS of the elements on your web page? Are you annoyed every time you test your web page on multiple different mobile devices?
If the answer to at least one of the questions is "yes," then this blog post is meant for you. Check out our best practices and tips which will help you to deal with these struggles and boost your performance.
Using the Chrome DevTools, you can easily modify the appearance and functionality of the Telerik UI for ASP.NET AJAX components, or other UI framework components like Kendo UI widgets, on the fly. Most of the tips and tricks are applicable to other browsers developer tools too, and will be presented with the help of the RadGrid in Telerik UI for ASP.NET AJAX.
On This Page
- Inspect the Generated HTML of a Control
- See the Applied Styles
- Get the Client-Side Reference of a Control
- Get IntelliSense for the Client-Side Object
- Debug JavaScript
- Simulate Mobile Device Rendering
- Inspect Network Requests
Update: If you're looking for even more advanced tips and tricks, be sure to check out the second post in this series.
Inspect the Generated HTML of a Control
When you are using prepared controls and components, sometimes you need to know the structure of the generated HTML to get familiar with its rendering so you can fine-tune it to blend in your project. This can be done by inspecting the HTML using the Elements panel of Chrome DevTools.
There are a few possible approaches to check the rendering of a control:
- Right-click an element and select the Inspect Element from the context menu. That will open Chrome DevTools and highlight the element that you clicked on.
- Click the Inspect Element button (Ctrl+Shift+C)
 on the top left corner of Chrome DevTools and hover over the control.
 - Right-click on an element logged in the console and choose "Reveal in Elements panel."
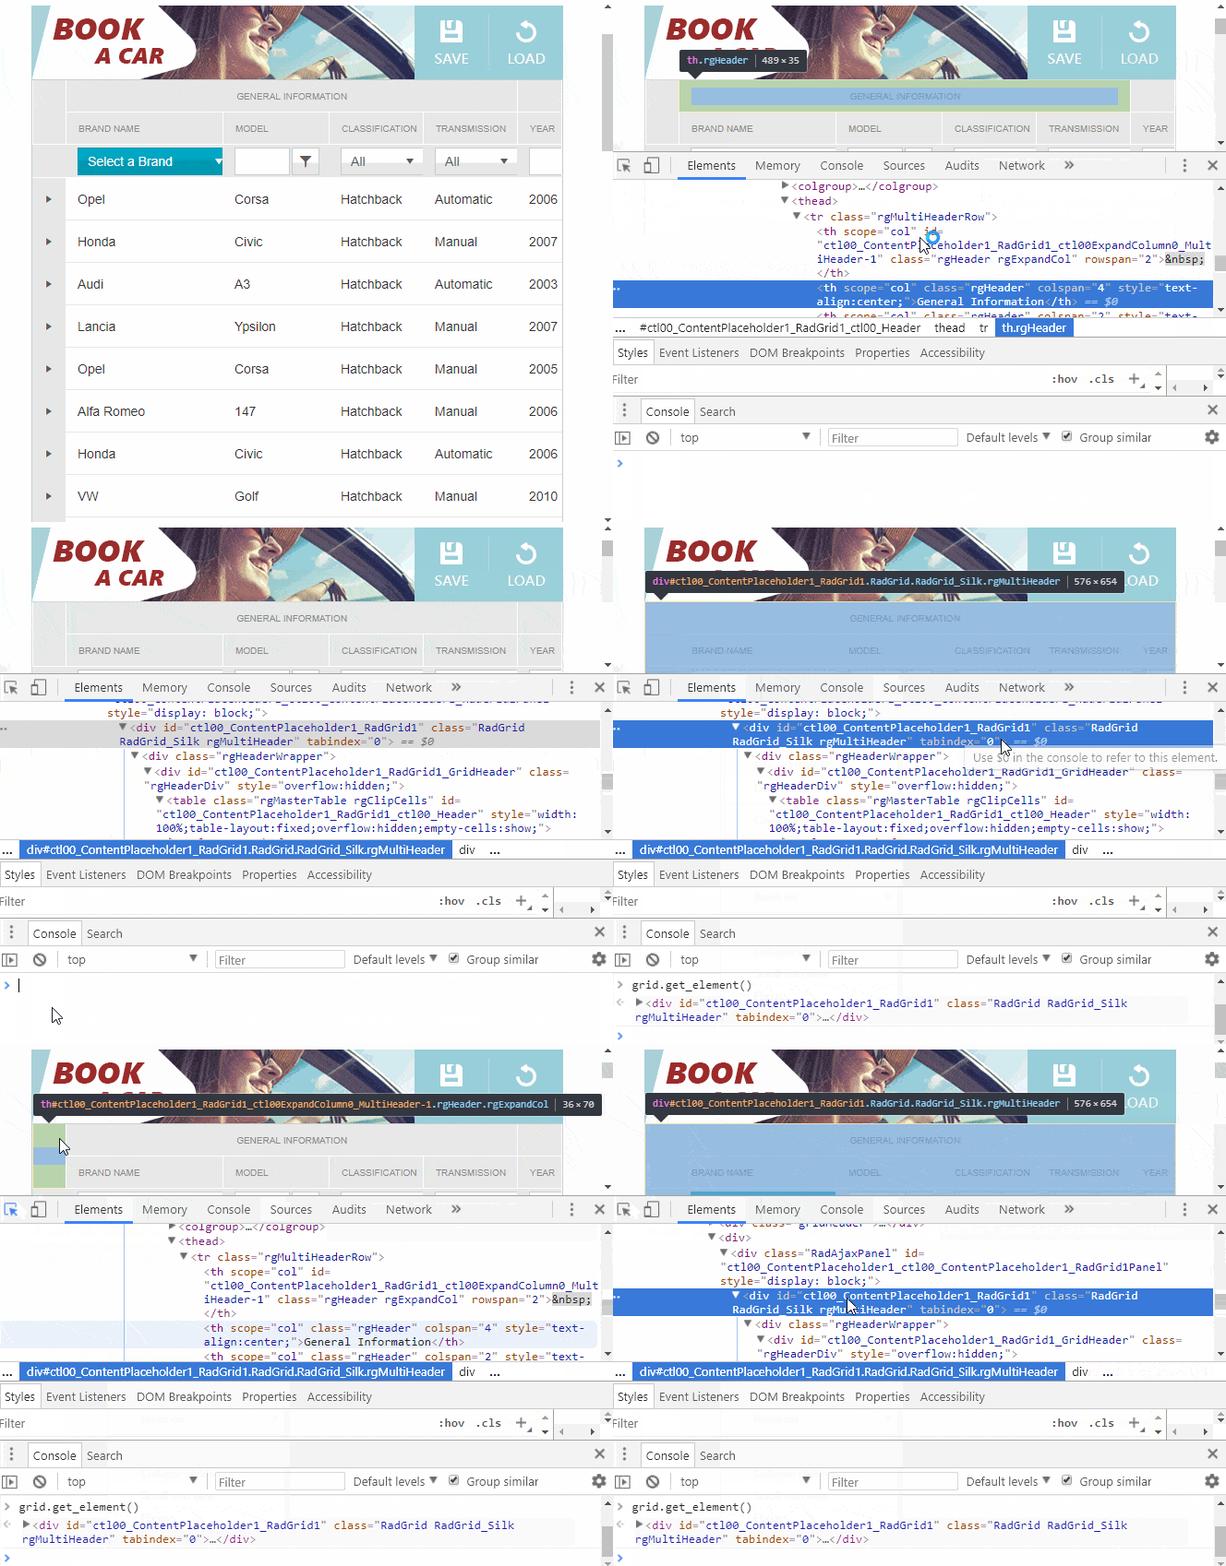
Figure 1. Inspect generated DOM elements
Pro Tips
- You can edit the HTML and the HTML attributes of an element on the fly by double-clicking an element's attribute in the Elements panel or right-clicking the element and choosing "Add attribute", "Edit attribute" or "Edit as HTML" option from the context menu.
- You can modify the DOM hierarchy by selecting an element in the Elements panel and then dragging it to the desired location
See the Applied Styles
When styling the page, sometimes you need to tweak the rules like padding, margin or color a little to get the perfect appearance. The side bar of the Elements panel has the Styles and Computed tabs, which allow you to dynamically change the applied styles to the selected element in the Elements panel, and even find the origin of the style rule. It also allows you to filter the styles, force different states (:hov) such as hovered, active, focused, add/remove classes easily (:cls). This is also useful in scenarios where the layout or appearance of the control is broken to find out which style is breaking the design.
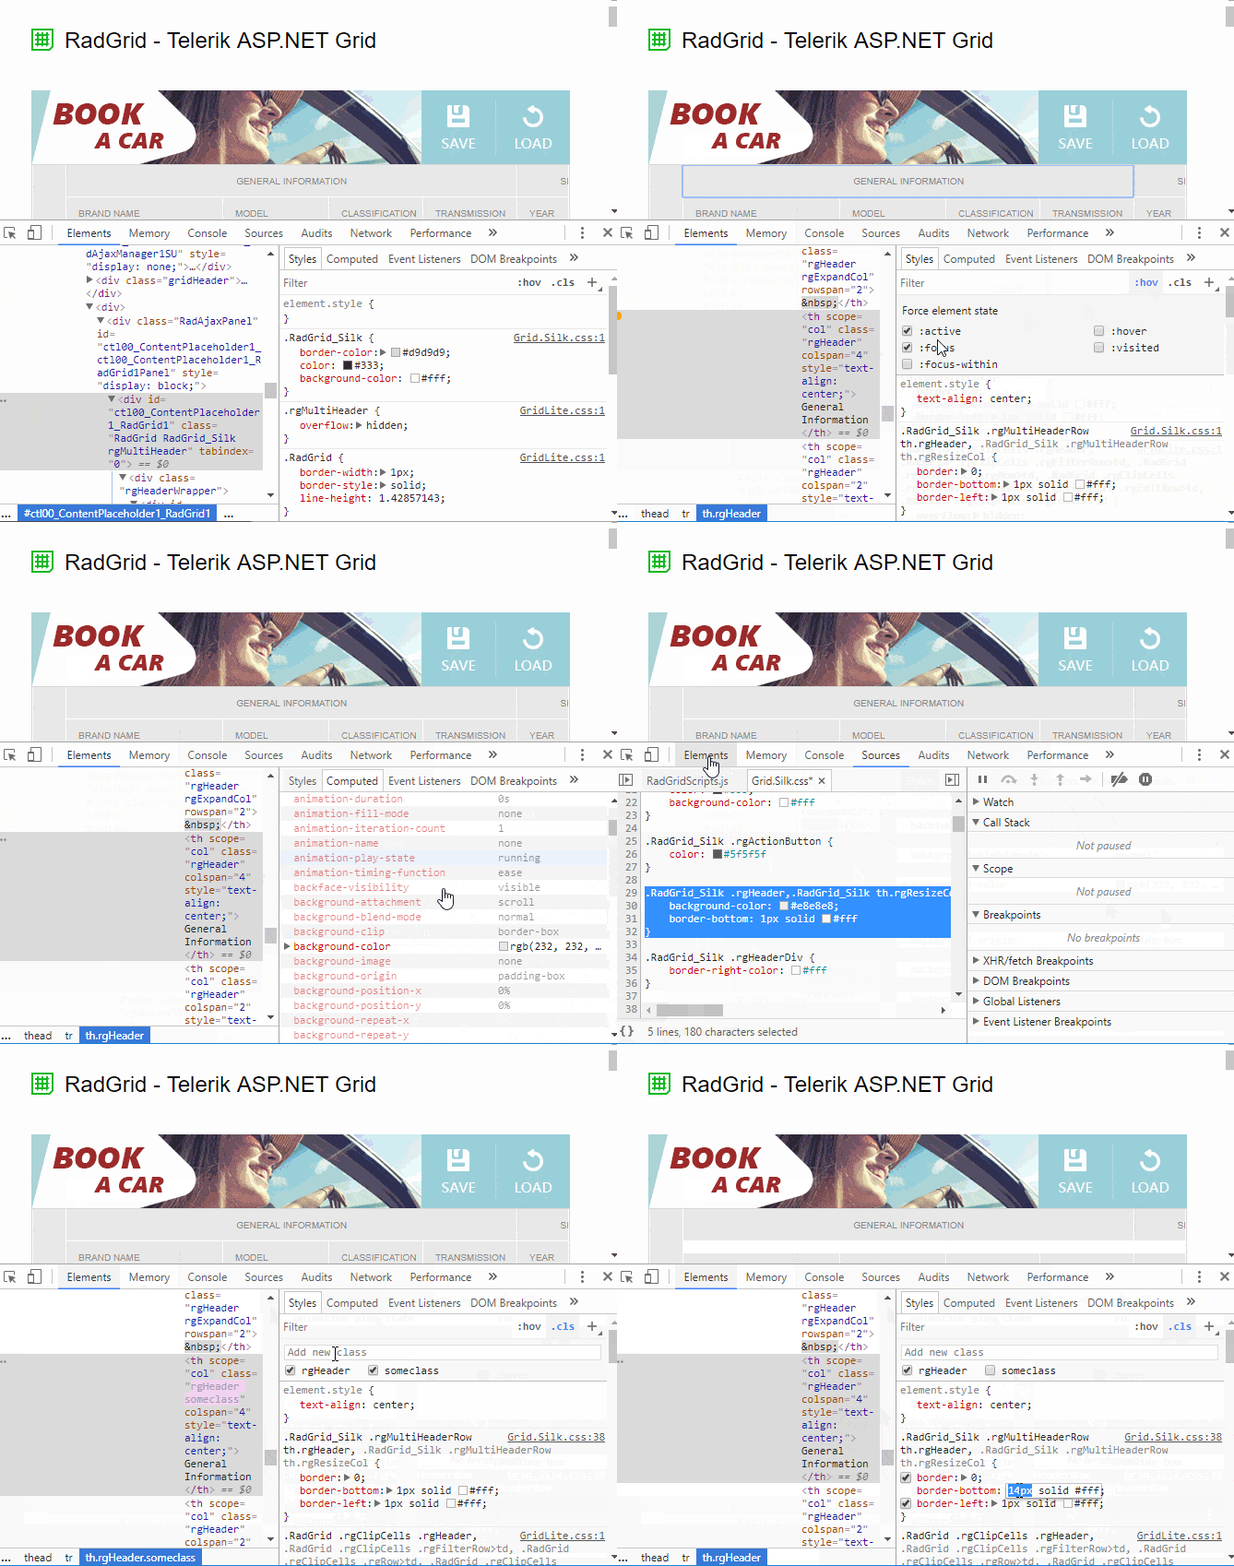
Figure 2. See the styles applied to the DOM elements
Pro Tips
- You can use the keyboard arrows to increase/decrease numeric values.
- You can use the color picker when setting color values to some properties.

The computed tab gives you visual representation of the size of the element along the borders, margins and paddings:
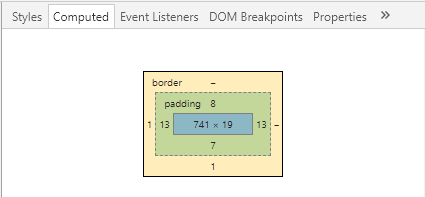
Get the Client-Side Reference of a Control
Getting a reference to the client-side object of a control is a powerful technique and can save you precious time, because it can reveal all currently available properties and methods on the fly.
Let's try it out by following the steps below:
- Inspect the rendered HTML of a control, using the skill we acquired earlier when we inspected the generated HTML of the RadGrid.
- Get the value of the ID attribute of the element which has a class equal to control name (i.e.
class="RadGrid"). - Use the obtained ID value as a parameter to the
$find()method. The result of the$find()method will give us a reference to the control's client object.
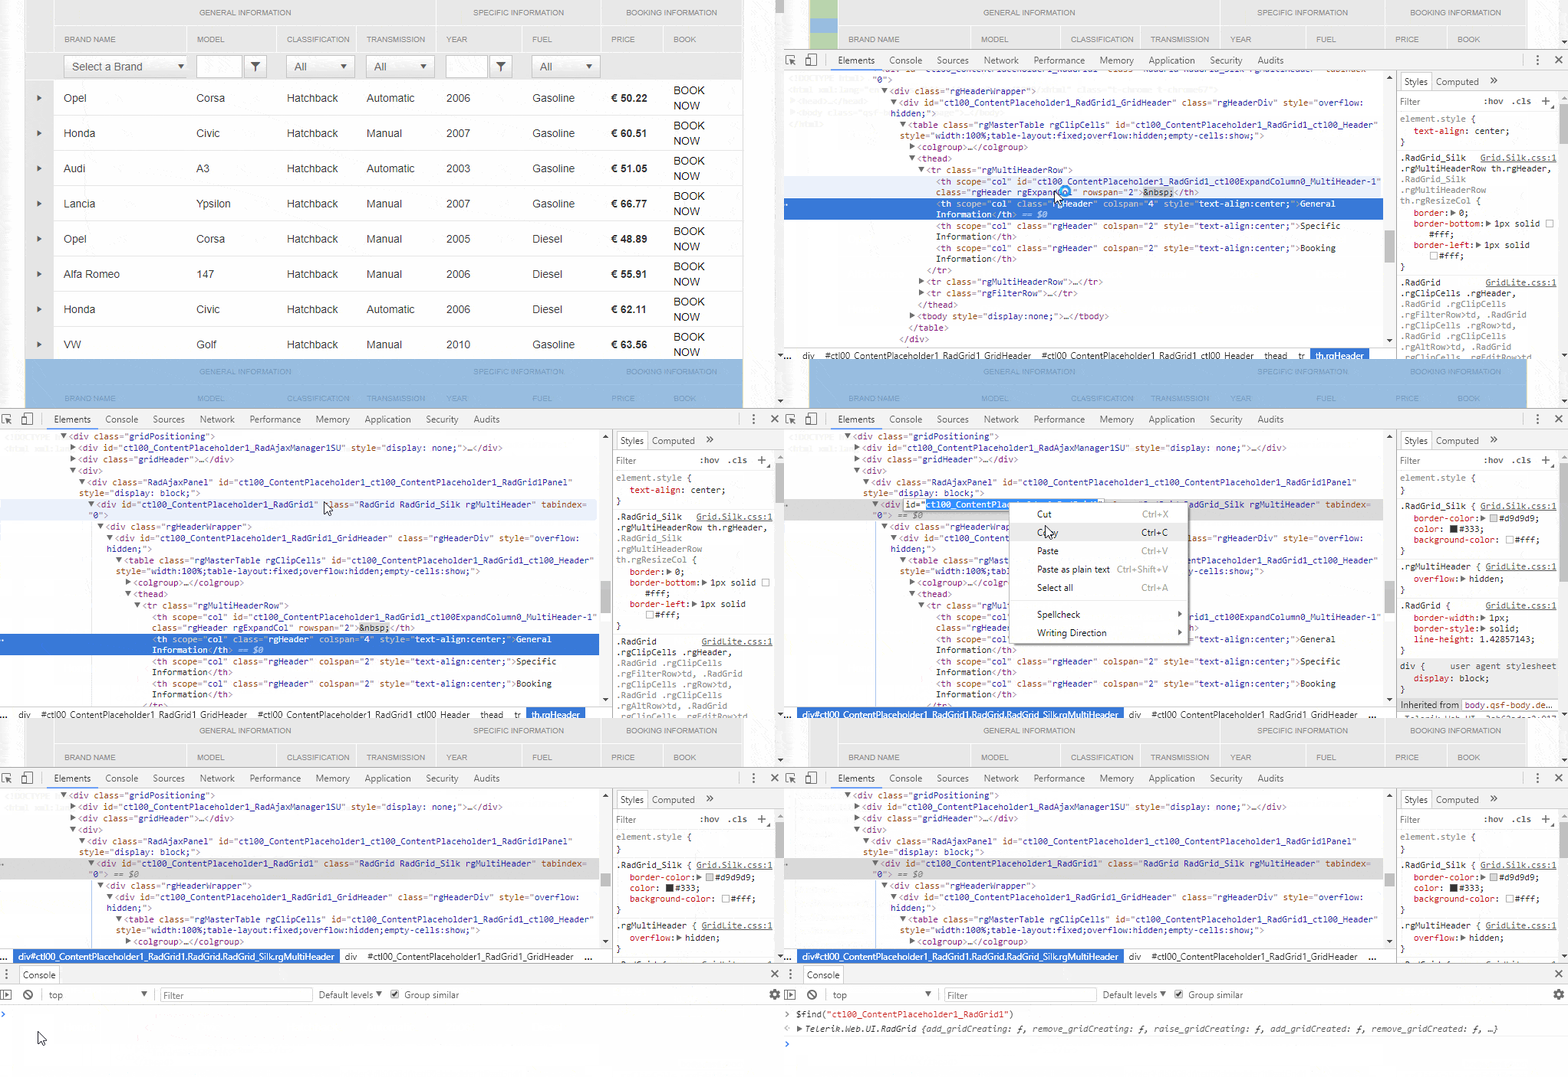
Figure 3. Get an object reference of a RadGrid client-side object
The article, Get Client-side Reference to a Control Object, demonstrates different approaches which we can use directly in the browser console.
Pro Tips
$telerik.$(".RadGrid")[0].controlreturns the client object reference of the first RadGrid on the page. The$telerik.$(".RadGrid")[0]part returns the element we were looking for in order to get its ID.
Get IntelliSense for the Client-Side Object
The result of the $find() method is a RadGrid and now when we have a reference to the control, we can see its API using the autocomplete suggestions. To see the "IntelliSense", you should simply assign the result to a variable.
Pro Tips
- ↑ and ↓ in the console shows the previous/next executed line.
- Ctrl+Space opens the suggestions menu.
console.table(objectReference,['index'])in the console lists all available properties and methods. In Google Chrome, you can skip theconsole.and simply use,table(objectReference,['index']).
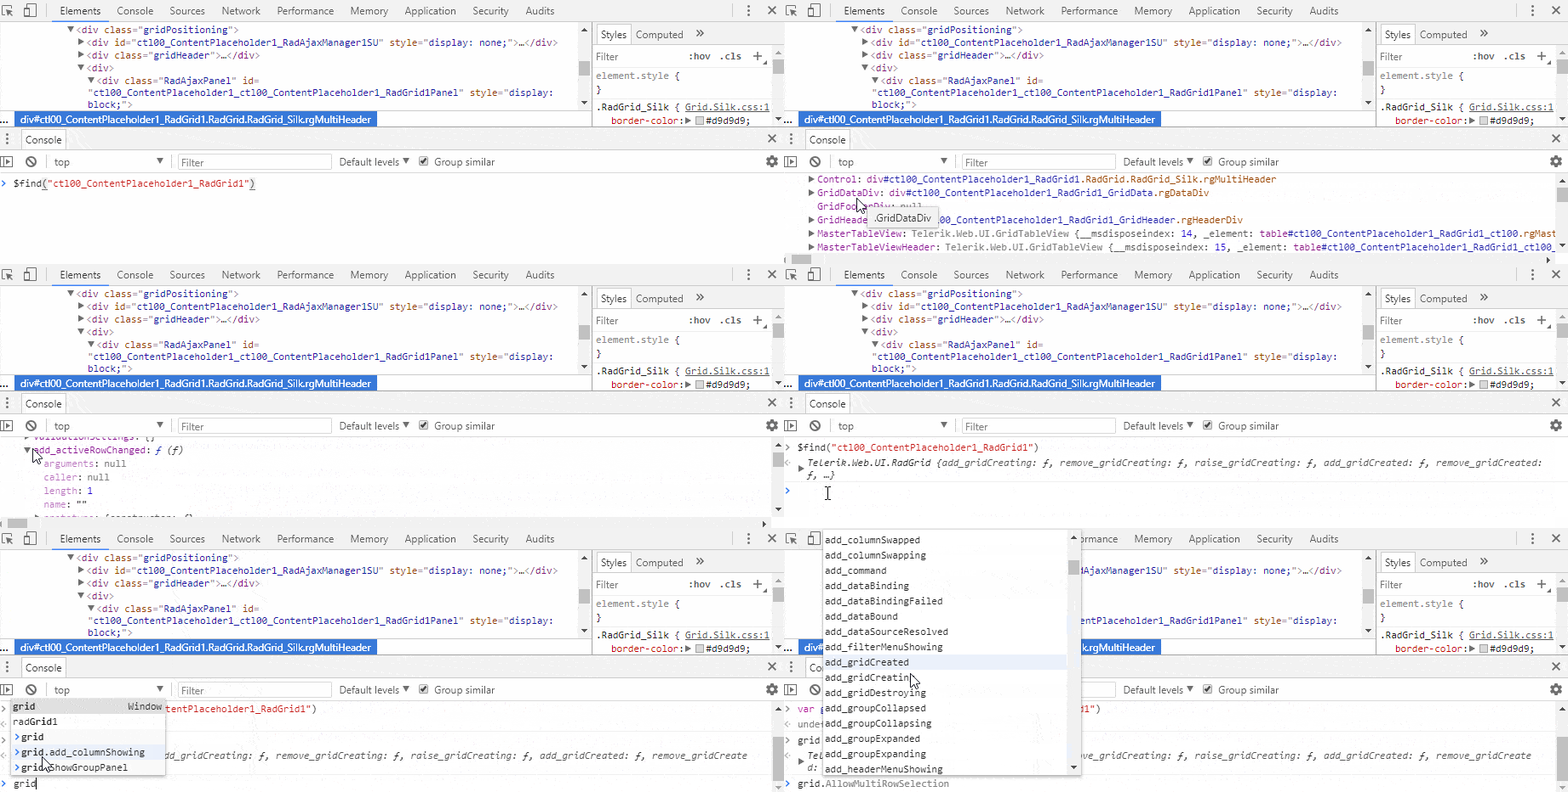
Figure 4. Show the API of the Grid client-side object and view auto-complete suggestions
Debug JavaScript
When your page, functionality or component does not behave as expected, these debugging skills can help you investigate and understand what is going wrong and fix it.
There are a few different approaches to activate a debugger in a JavaScript function:
- Add a
debugger;statement in the function's declaration. Unfortunately, it is not that easy with built-in functions of prepared components, because you don't always have access to the source code. - Call
debug(functionReference)in the console. This is equal to adding adebugger;statement on the first line of the function declaration. - Line-of-code breakpoints that Chrome DevTools offer. To add them, you can go to the code in the Sources panel and click the line number. The left click will add a breakpoint and the right-click allows you to set a conditional breakpoint (hit only if the given expression evaluates to true). The conditional breakpoints are very useful for debugging loops
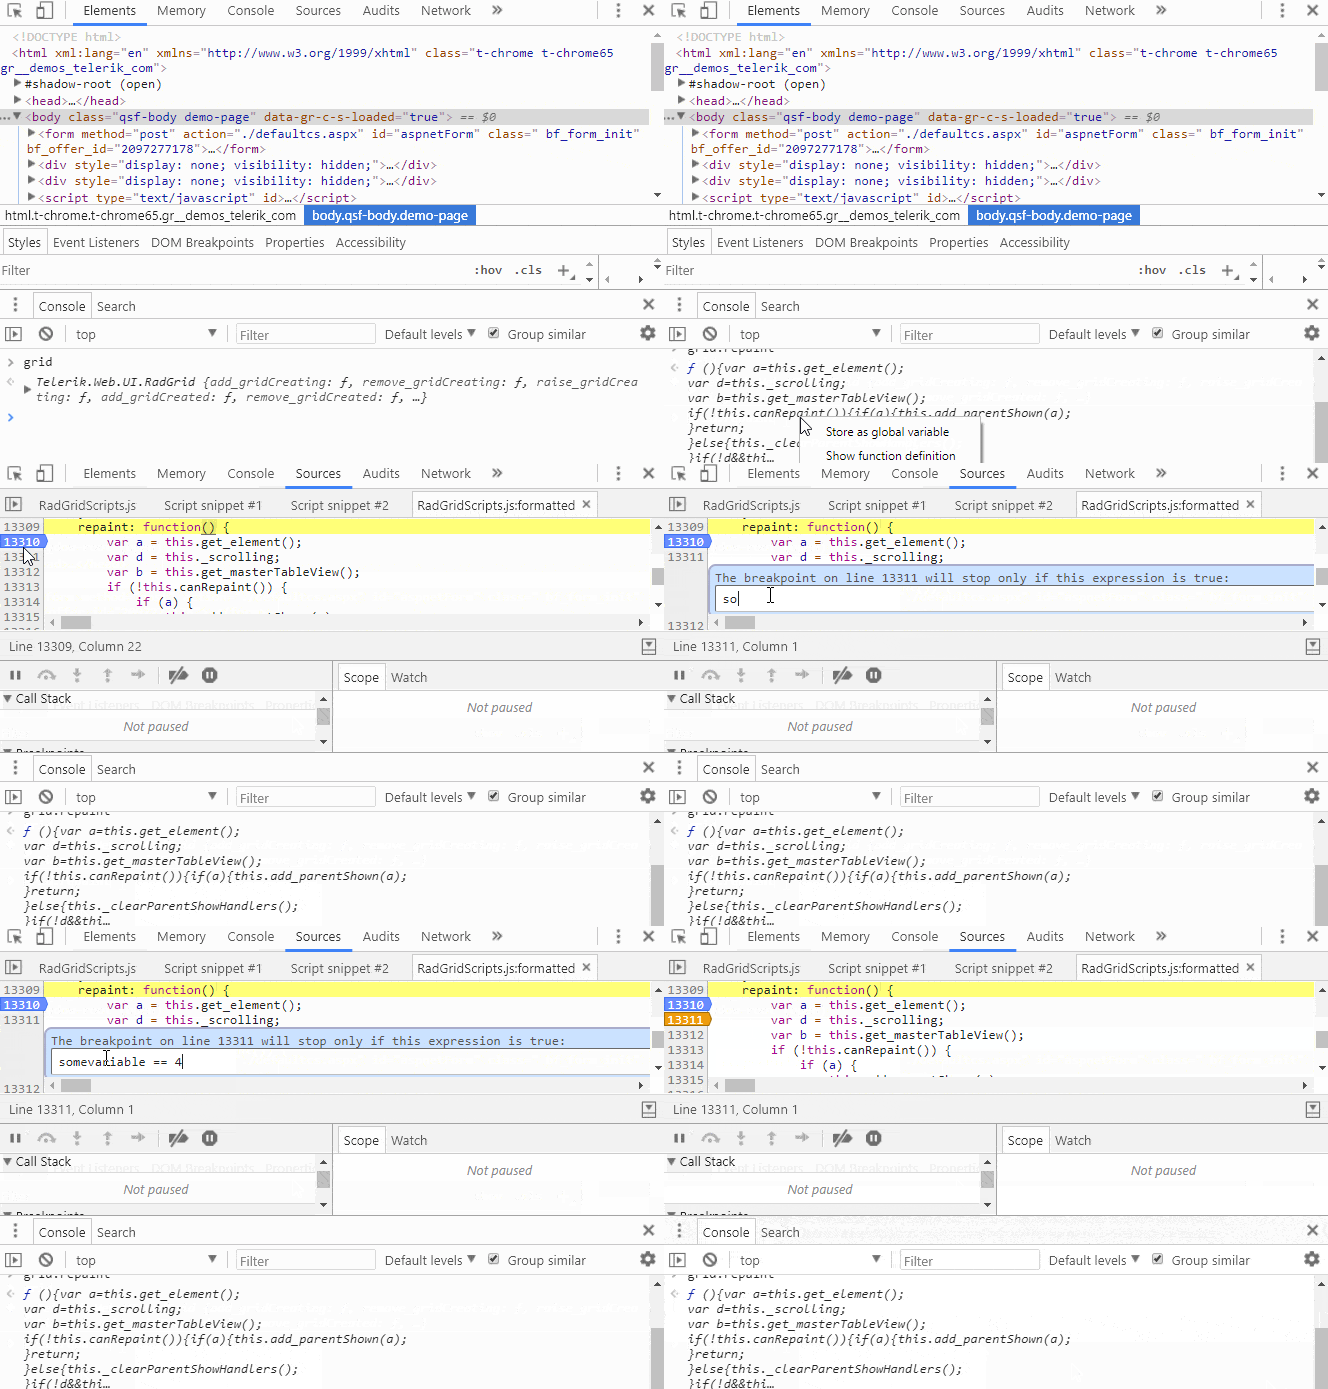
Figure 5. Adding Line of Code breakpoints
Pro Tips
- JavaScript errors are logged in the console. It is always a good practice to look for these errors since they can decrease the page's performance or even break the interaction and functionality of the application.
- To see the file containing a function in the Sources panel and highlight the line where it is declared, you can log the function in the console and left-click the option. The same result is achieved by right-clicking the logged function and choosing "Show function definition" from the context menu.
- Use the F8 (unpause), F10 (step over), F11 (step into) shortcuts when debugging.
- Right-click on a line of code and choose "Continue to here" to create the equivalent effect of putting in a breakpoint, unpausing debugging and then removing the breakpoint after it is hit.
- Right-click on an expression or selected text to show a context menu with the "Evaluate in console" and "Add selected text to watches" options.
- Press the {} button to prettify the code in the source file.
![]()
Simulate Mobile Device Rendering
Do you know the struggle of changing various devices to check how your page will be rendered on a mobile device? The Device Mode functionality of Chrome DevTools, referred to also as "Mobile Mode" in the blog post, allows you to test your site's responsive design across multiple screen sizes and resolutions, as well as to accurately simulate mobile device input for touch events, device orientation and geolocation. As a bonus, it also changes the User agent string as if the request is from a mobile browser.
The best part of using the Device Mode is that you can use Chrome DevTools, so you can apply all your debugging skills as if it is a desktop site. And you don't even need to plug a single device to your development machine.
To activate the Mobile Mode, you can press the Toggle Device Mode button  . Keep in mind that when toggling between the modes, you might need to refresh the page to activate it properly.
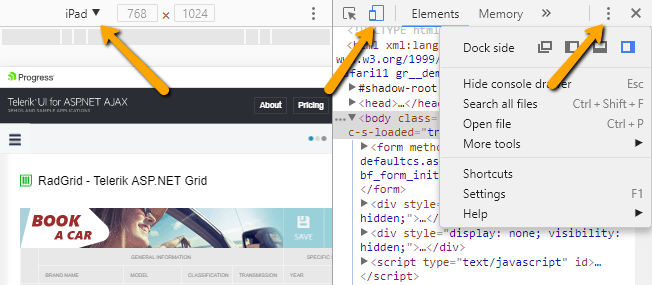
Figure 6. Browser appearance in Device Mode
Pro Tips
- You can change the Dock side of the developer tools to the left or right side when simulating a mobile device in Portrait mode.
- There is a predefined set of popular devices in the dropdown above the simulator which you can use to simulate various device sizes.
Inspect Network Requests
Sometimes you need to check the parameters of the request to the server, or see what the content and the format of the response is. You can do that in the Network panel:
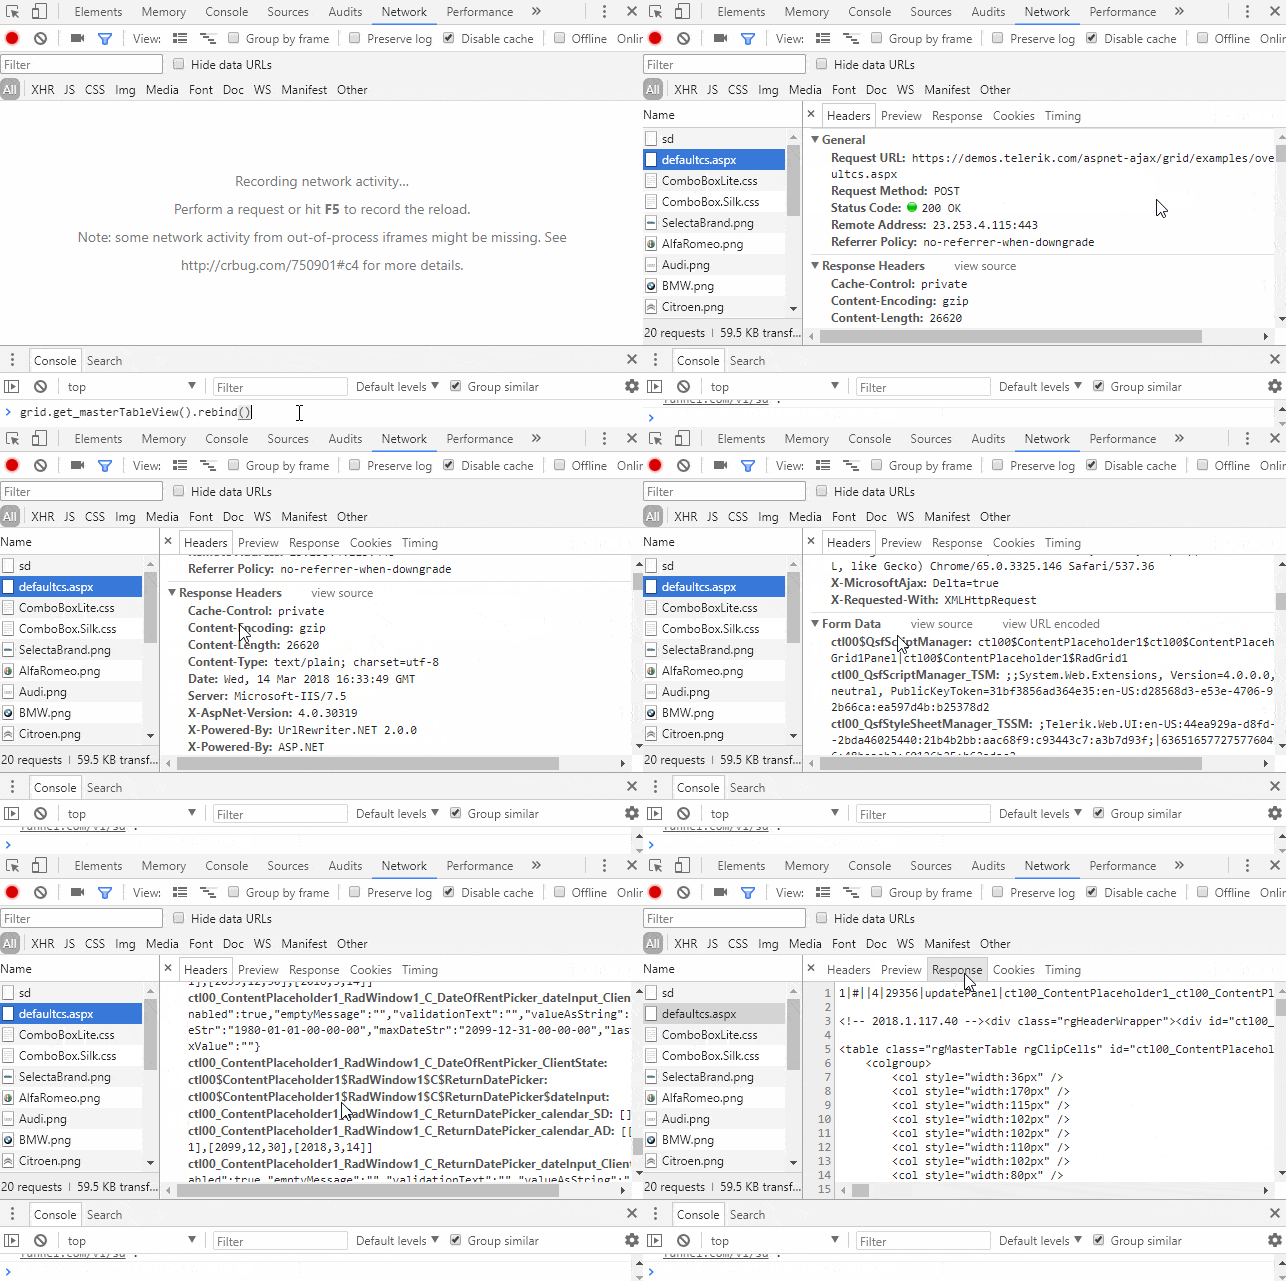 Figure 7. Inspect Network requests
Pro Tips
- Enable logging of the XHR requests in the console. That will make the XHR requests more easily visible in the console, and left-clicking the result will navigate you directly to that request in the Network panel. Note: Leave "Hide network" unchecked.
- Check the Disable the cache checkbox. This will prevent the caching of files and requests and can save you some time and troubles when a change made on the server is not applied on the client. Another option to clear the cache is refreshing the page with Ctrl+F5 instead of just F5.

You can imitate a slow connection, which is a very nice way to emulate a mobile connection, by changing the option in the "Online" dropdown in the network tab:

Wrap Up
Chrome DevTools is a powerful addition to the developer's bag of tricks. In this article, we examined different productivity and debugging techniques, and best practices which will allow you to better understand how your web apps and components work. We've covered how to troubleshoot, inspect and debug them, and how to modify their look and appearance on the fly directly in the browser.
However, that's only a small part of our dev arsenal. What other tools and tricks do you use? It would be great to hear you share your secrets from your own repertoire in the comments section below.
For more, keep reading our next blog post in this series for additional tips and tricks from our internal development practices.

Peter Milchev
Peter (@p_milchev) is a Tech Support Engineer working with the AJAX, MVC and Kendo UI components and developer tools. Apart from providing support services, he also enjoys helping the developer teams with bug fixes and improvements for the UI controls. In his free time, he likes practicing martial arts, playing football and snowboarding.
