
Improve Your Debugging Skills with Chrome DevTools (Part 2)

Summarize with AI:
In this post, we cover advanced techniques using Chrome DevTools, which will further improve the skills you have obtained in the first part of this series.
Have you mastered the way to inspect the generated HTML and applied CSS? Do you feel confident in debugging JavaScript in the browser? I hope yes, because in this post we cover some advanced techniques using the Chrome DevTools, which will further improve the skills we obtained in Part 1.
As we learn the new skills, we will experiment with some basic examples with the Kendo UI widgets and, at the end of this post, you will find a real-life example to practice your newly obtained skills with the help of the jQuery Grid.
In This Article
- Intelligent Code Completion and Auto-Complete
- Access Selected Elements and Executed Expressions Easily
- Inspect Auto-Hiding Tooltips and Elements
- Advanced Debugging with Chrome DevTools
- Execution Contexts in Chrome DevTools
- Example: Kendo UI jQuery Grid
Intelligent Code Completion and Auto-Complete
Intelligent code completion and auto-complete are popular features in IDEs that improve developer productivity. In Chrome 68, the DevTools team decided to incorporate similar features into the Console. Specifically, Eager Evaluation, Auto-Complete After Function Execution and Argument Hints.
Let's assume the following function to see how these features work:
function test(yourValue) {
  return {
    value: yourValue,
    multiplied: yourValue * 3
  };
}
Eager Evaluation
Here is what Chrome DevTools will display in the Console with the Eager Evaluation enabled:
This feature enables expression evaluation of code in the Console, provided the expression does not have side effects (i.e. execution does something other than returning a value). You can read more about side effects from the question, JavaScript closures and side effects in plain English? on Stack Overflow.
Tip: You have such an evaluation also when you open the Source tab while in debug mode and you hover or highlight an expression
Auto-Complete After Function Execution
This feature relies upon Eager Evaluation and the same limitation applies due to that—no auto-complete is available if the function has any side effects.
Tip: Save the result of the function in a variable (see Get IntelliSense for the Client-Side Object) and execute the function in the Console to verify the result
Then use the Console API and save the expression to a variable as var lastEvaluatedExpression = $_;.
Argument Hints
This feature provides a pop-up that displays the eligible arguments you can pass when you write the code to invoke a function in the Console or open/hover over its brackets.
Access Selected Elements and Executed Expressions Easily
In the previous section, I referenced a variable, $_ without explaining what it does. It isn't magic; it's part of the built-in command line API. Chrome DevTools will assign objects and expressions to a list of pre-defined variables. For example, the expression, 40+2 will evaluate to 42. For convenience, I may wish to access this result without having to remember a variable name or the expression that created it, or spending 7.5 million years calculating it. With Chrome DevTools, you can now simply use the $_ variable.
The command line API in Chrome DevTools saves some objects and expression results to predefined variables. Other useful shortcuts the Console provides are $0, $1, $2, $3, and $4. $0 references the last element selected in the Elements panel, $1 references the previous element, and so on. This can be very useful when you need to get a reference to the DOM element that represents a control or widget and you would like to quickly check its available members.
Let's try this out with the PanelBar demo for Kendo UI, where we'll access and toggle the first item:

Tip: Chrome DevTools can help you with the HTML and DOM changes your application does and give you a hint how you can optimize it (see Blazing Fast List Rendering in Angular)
Inspect Auto-Hiding Tooltips and Elements
Tooltips can be tricky to inspect because they disappear after a period of time. Inspecting other kinds of auto-hiding elements—like those that are displayed through a user interaction (i.e. mouse click and drag)—can be just as difficult. Historically, I've had to use some ugly code to reference and inspect them. Enter setTimeout() and the debugger.
The responsibility of setTimeout() is to execute a specific logic after a given period of time. Another feature is that it reorders the execution of the functions. This comes in handy when you need to execute a function after some quick animations (see Why is setTimeout(fn, 0) Sometimes Useful?).
Once we better understand what happens when we use setTimeout(), we can combine its power with the debugger statement so that we can activate the debug mode when the auto-hiding element is shown without worrying that it will disappear if we blink.
The animation below shows how we can inspect the tooltip by evaluating setTimeout(function(){debugger; }, 3000) in the Console:
This image (above) features the drawing API and jQuery Tooltip widget of Kendo UI.
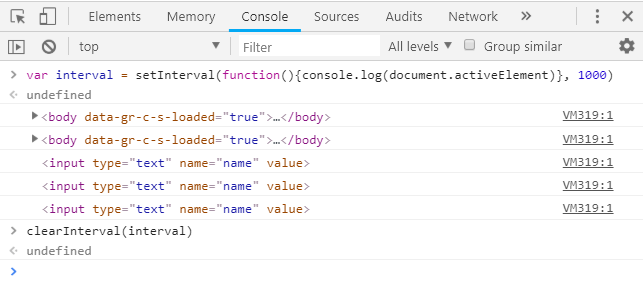
Tip: To log the currently-focused element once it is changed paste the following code in the console: window.focusedelement;
setInterval(function(){ if(window.focusedElement != document.activeElement){window.focusedElement = document.activeElement; console.log(document.activeElement)}})
To clear the interval, reload the page or use clearInterval():
Advanced Debugging with Chrome DevTools
Let's explore other approaches to break the page execution and check the current values of the variables.
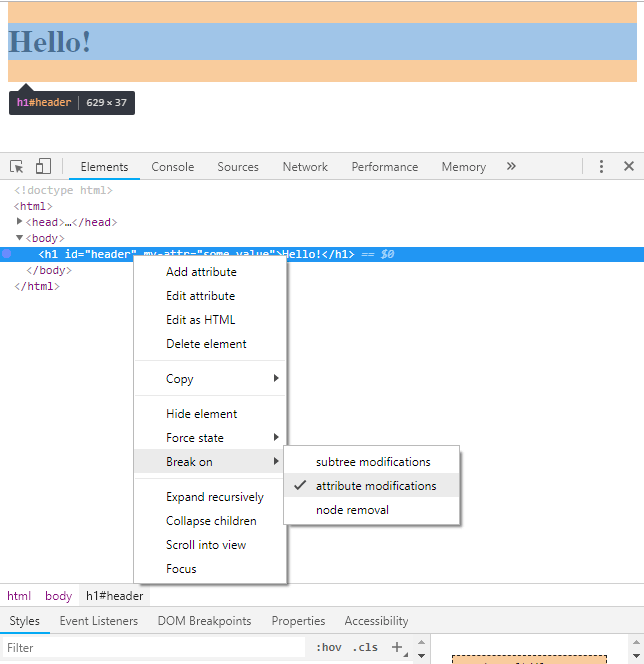
DOM Change Breakpoints
These break when the structure or attributes of the selected DOM element change, or it is removed via JavaScript. To toggle this feature: right-click on the element in the Elements panel, hover Break in the context menu and choose "subtree modifications", "attribute modifications" or "node removal".
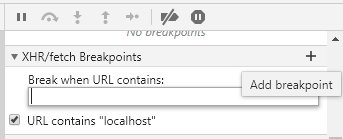
XHR/Fetch Breakpoints
These break when the request URL contains the string configured for the breakpoint. To toggle this feature: expand the XHR Breakpoints pane in the Sources panel, click the Add breakpoint button and enter the desired URL part.
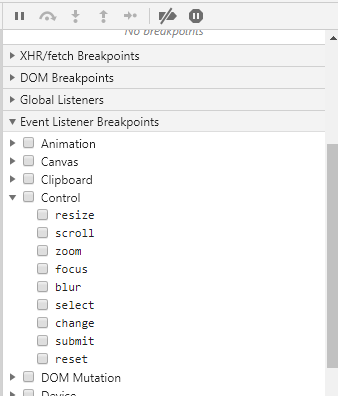
Event Listener Breakpoints
These break when the desired mouse, keyboard, device, animation, etc. event is fired. To toggle this feature: expand Event Listeners Breakpoints in the Sources tab and check the desired (category of) events.
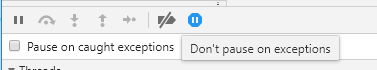
Exception Breakpoints
These break when a handled or unhandled exception is thrown. To toggle this feature: click the Pause on Exception button in the Sources tab; when these exceptions are enabled, an additional option to Pause on caught exceptions is available.
Once you get familiar with breakpoints, you might enable many and, at some point, it may turn out that you are skipping most of them. In this case, you can use one of the possibilities to continue the page execution uninterrupted:
- Click the Continue button to show a dropdown and choose the Continue without interruption button
- Close the Chrome DevTools quickly by pressing F12
The Sources tab has a few more panes that are worth mentioning:
- Watch expressions tab: lets you monitor the values of variables or evaluations of expressions over time
- Call Stack section: shows the execution path, in reverse chronological order, that brought the code to that breakpoint
- Scope pane: shows you what local and global variables are currently defined
Execution Contexts in Chrome DevTools
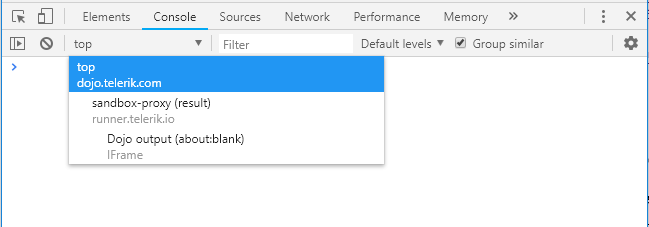
Have you ever received a ReferenceError (saying that the function is not defined) while trying to execute an already declared function in the browser console? You are not alone, it happens to everyone.
One reason you receive such an error could be that the page containing the script is loaded in an <iframe>, thus in a different execution context. In short, an execution context is like a scope and every page, <iframe> or browser extension has its own execution context. You can toggle between the different contexts through the dropdown in the Console:
Some points about execution contexts:
- Inspecting an element automatically switches the execution context to the page that contains the inspected element
- To get the logs from all context in the Console, uncheck the "Selected context only" in the Console settings
- On the right-hand side, you have a link to the file that executed the function responsible for the log
The contexts are clearly visible in the Kendo UI Dojo, which we will use to test the provided tips.
Example: Kendo UI jQuery Grid
You were waiting for this while reading, right? Here is the sample task that would involve most of our newly obtained skills.
Task: Use JavaScript to change the background of the floating element created when dragging a header in this Dojo example based on the Kendo UI jQuery Grid demo.
Try that yourself and if you need help, check the following hints:
- The context should be changed to the example itself: Execution Contexts in Chrome DevTools
- In the correct context, break the page after the element appears: Inspect Auto-Hiding Tooltips and Elements
- Inspect the floating element: Inspect the Generated HTML of a Control
- Access the element in the console: Access Selected Elements and Executed Expressions Easily
- Use the auto-complete functionality to find the correct style properties of the element: Intelligent Code Completion and Auto-Complete
By now, you should feel confident when working with Chrome DevTools—no CLI magic, auto-hiding elements or complex debugging scenarios can stand in your way. We've shed light on them all and defeated the dark side. Jokes aside, I hope this article was helpful and solved at least one difficult question you had—let me know. Do you know other tips and tricks? Please share (because you care) in the comments section below!

Peter Milchev
Peter (@p_milchev) is a Tech Support Engineer working with the AJAX, MVC and Kendo UI components and developer tools. Apart from providing support services, he also enjoys helping the developer teams with bug fixes and improvements for the UI controls. In his free time, he likes practicing martial arts, playing football and snowboarding.