
How to Create the Best Working Plan with MVC Gantt Chart

Summarize with AI:
Create the best working plan divided by tasks and timeframes with Telerik UI for ASP.NET MVC Gantt Chart.
In our daily routines, we are resolving different challenges. For the basic ones, we can easily decide how to act. However, from time to time, we do face more complex ones. What’s the best approach to handle those? Divide them into a couple of smaller tasks.
A big project implies difficult execution, but breaking it down into smaller, more digestible phases results in simplification. The Gantt Chart from Progress Telerik UI for ASP.NET MVC is the perfect tool for doing exactly that. It enables you to identify smaller parts of a project and plan their execution in timeframes. Furthermore, splitting the amount of time needed to finish the work and aligning it to the different phases ensures the due date is met without any delays.
The ASP.NET MVC Gantt control is part of Telerik UI for ASP.NET MVC, a professional-grade UI library with 110+ components for building modern and feature-rich web applications. The Gantt is a server-side wrapper for the Kendo UI for jQuery Gantt component and comes in the form of a HtmlHelper.
We Are Part of a Team
Think about a time when you were given a complex task. Let’s say that you had a software project to deliver, and the task was to implement code for it. What would have been better and more effective? To execute the project as a team.
Assigning parts of the whole implementation to different developers not only improves the work process but also promotes diversity and creative thinking. And calculating the needed time to execute the smaller tasks will provide the whole picture on how the process is happening.
Henry Ford said, “If everyone is moving forward together, then success takes care of itself.” But don’t take our word on that—check out the Telerik UI for ASP.NET MVC Gantt Chart demo, which represents exactly the project management capability of the component.
How to Achieve the Desired Results with the Gantt Component?
Based on the above-mentioned use case, we can conclude that the Telerik UI for ASP.NET MVC Gantt is commonly used in project management as it provides an easy and comprehensive way of showing tasks or events displayed against time. Leveraging the Gantt chart, users can distinguish at a glance:
- What the various activities are
- When each activity begins and ends
- For how long each activity is scheduled to last
- Where activities overlap with other activities, and by how much
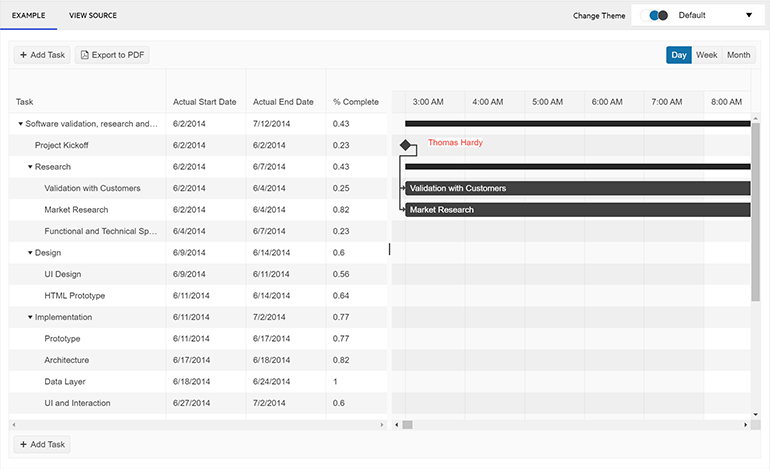
Here’s a snippet which we call the declaration of the Gantt component. It allows you to configure the layout of the Gantt chart and build a hierarchy of parent and children tasks, displayed in the left-hand side of the Telerik UI for ASP.NET MVC Gantt component.
@(Html.Kendo().Gantt<TaskViewModel, DependencyViewModel>()
  .Name("gantt")
  .Columns(columns =>
  {
    columns.Bound(c => c.Title).Title("Task").Editable(true).Sortable(true).Width(200);
    columns.Bound(c => c.Start).Title("Actual Start Date").Format("{0:M/d/yyyy}").Width(85);
    columns.Bound(c => c.End).Title("Actual End Date").Format("{0:M/d/yyyy}").Width(85);
    columns.Bound(c => c.PlannedStart).Title("Planned Start Date").Format("{0:M/d/yyyy}").Width(85);
    columns.Bound(c => c.PlannedEnd).Title("Planned End Date").Format("{0:M/d/yyyy}").Width(85);
    columns.Bound(c => c.TeamLead).Title("Team Lead").Format("{0:M/d/yyyy}").Width(65).TemplateId("teamlead-template");
  })
  .Views(views =>
  {
    views.DayView();
    views.WeekView(weekView => weekView.Selected(true));
    views.MonthView();
  })
  .ShowPlannedTasks(true)
  .Editable(true)
  .Resizable(true)
  .Height(590)
  .TaskTemplateId("task-template")
  .ListWidth("45%")
  .ShowWorkHours(false)
  .ShowWorkDays(false)
  .Snap(false)
  .DataSource(d => d
    .Model(m =>
    {
      m.Id(f => f.TaskID);
      m.ParentId(f => f.ParentID);
      m.OrderId(f => f.OrderId);
      m.Field(f => f.Expanded).DefaultValue(true);
    })
    .Read("Read_Tasks", "Home")
    .Update("Update_Tasks", "Home")
  )
  .DependenciesDataSource(d => d
    .Model(m =>
    {
      m.Id(f => f.DependencyID);
      m.PredecessorId(f => f.PredecessorID);
      m.SuccessorId(f => f.SuccessorID);
      m.Type(f => f.Type);
    })
    .Read("Read_Dependencies", "Home")
    .Create("Create_Dependency", "Home")
    .Destroy("Destroy_Dependency", "Home")
  )
)
Let’s highlight and pay a little bit more attention to this particular part of the snippet:
.Views(views =>
{
  views.DayView();
  views.WeekView(weekView => weekView.Selected(true));
  views.MonthView();
It will allow you to display the flow choosing a specific time view—day, week or month. This capability is available through the Gantt Chart integration with the Telerik UI for ASP.NET MVC ToolBar component.
Feel free to also apply custom task templates to ensure a better user experience. The Client API and the Server API provide many configuration options, along with dozens of methods and events.
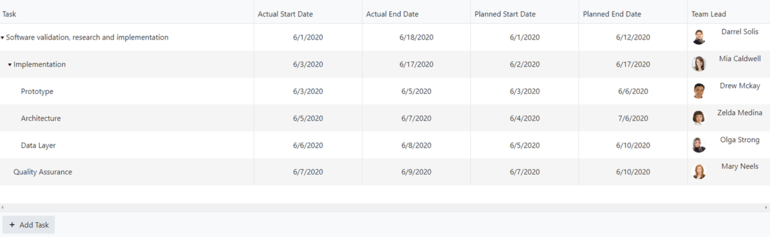
The snippet below shows the configuration of the team lead column within the project management chart as well as the task templates:
<script id="task-template" type="text/x-kendo-template">
    <div class="template" style="display: flex;">
        <span style="padding-right: 8px;">#= TeamLead #</span>
        <div class="progress" style="width:#= (100 * parseFloat(percentComplete)) #%">#= (100 * parseFloat(percentComplete)) #%</div>
    </div>
</script>

<script id="teamlead-template" type="text/x-kendo-template">
    <div class="template">
        <img class="resource-img" src="../content/#:ImageID#.jpg"/>
<span>#= TeamLead #</span>
    </div>
</script>
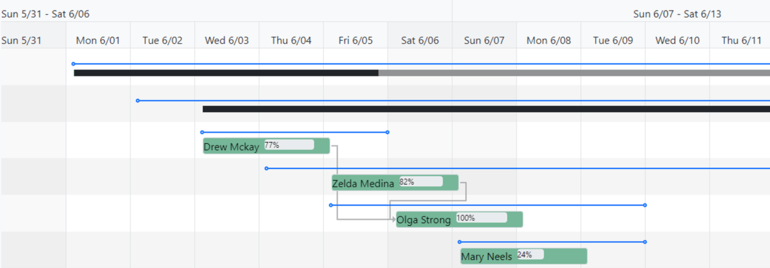
In the right-hand side of the Gantt component, you can visualize every chunk of the project management process with its own private settings as a start and end time. You can also represent the percentage that indicates the progress of the task completion.
Below you’ll find a snippet on how to create a TaskViewModel in the Controller:
new TaskViewModel
{
  TaskID = Guid.Parse("c57c36ff-0695-45af-8be5-15ad6547311d"),
  Title = "Software validation, research and implementation",
  ParentID = null,
  OrderId = 0,
  Start = new DateTime(2020, 6, 1, 3, 0, 0),
  End = new DateTime(2020, 6, 18, 3, 0, 0),
  PlannedStart = new DateTime(2020, 6, 1, 3, 0, 0),
  PlannedEnd = new DateTime(2020, 6, 12, 3, 0, 0),
  PercentComplete = 0.43M,
  Summary = true,
  Expanded = true,
  TeamLead = "Darrel Solis",
  ImageID = 1,
}
Test the Flexibility of the Gantt Component
There are many reasons why to apply custom tools to a UI component like the Gantt. The biggest is, of course, the customization enabling you to align the look and feel of the component to your personal or brand needs.
Adding custom tools to the Gannt component also allows you to control the presentation of the data (tasks, events, time duration, etc.) and the overall design of the charts based on your preferences or style guides, including dark or light modes, different button colors and many more.
There are numerous examples of custom tools added to a Gantt. Check out this example to see how to color a hovered item.
If you’re interested in learning more about the Gantt Chart’s custom scenarios and implementations, feel free to visit the following libraries:
Try out the Telerik UI for ASP.NET MVC Gantt Chart Today
Want to start taking advantage of the ASP.NET MVC Gantt, or any of the other 110+ ready-made components, like the Grid or the Scheduler? Start a free trial today and experience for yourself that building rich interactive applications for half the time is just a click away.
Try Telerik UI for ASP.NET MVC
Sharing Is Caring
Once you try the Gantt Chart component, don’t forget to share your experience and ideas in the comments sections below or by visiting the Telerik UI for ASP.NET MVC Feedback portal. Your input makes a difference.
For the Curious Ones: History of Gantt
The first Gantt chart was devised in the mid-1890s by Karol Adamiecki, a Polish engineer who ran a steelwork in southern Poland and became interested in management ideas and techniques.
15 years after Adamiecki, Henry Gantt, an American engineer and project management consultant, devised his own version of the chart and it was exactly this version that became widely known and popular in western countries.
Consequently, it was Henry Gantt whose name was to become associated with charts of this type.


Anton Mironov
Anton Mironov is a Technical Support Officer working on the Progress Telerik web developer tools. He is an expert in handling complicated requests, finding the best, most effective and functional solutions, guaranteeing utmost customer satisfaction. He also has a strong passion for exploring the capabilities of artificial intelligence (AI) and how it can be applied in solving real-world problems. He tries to be a fun father and a trustworthy friend to his family and colleagues.
Related Posts
Comments
All articles
Topics
Web MobileMobile
Desktop
Design
Productivity
People
