Getting Started with the Web Report Designer in .NET

Summarize with AI:
In the second post of this series, we review the new Web Report Designer and how to use it in ASP.NET. See the first post here.
Series Outline
Telerik Reporting is a powerful reporting engine built on .NET with lots of great benefits. One of these benefits is the Report Designers. From developers to report designers and stakeholders, Telerik Reporting is the tooling of choice for creating and designing beautiful reports. As a result, I have created this series to illustrate this.
This series covers a little of the past, a little of the present, and, most importantly, future opportunities. The later posts will be more technical, so you can skip ahead using the links below or read along at your leisure.
-
Web and Desktop Report Designers for Everyone – Telerik Reporting.
-
Getting Started with the Web Report Designer in .NET. (This post)
- Getting Started with the Desktop Designers in .NET
Introduction
Well-designed reports are just like any other piece of media. There is an abstract art to creating them and reading them. Think about it, reports answer questions, communicate objectives and evoke good and bad feelings.
I mean, it is not a Picasso or a Rembrandt. However, the person or people that thought through the complexities of the data and organized it in such a way to communicate good and bad information worked through a similar process as those well-renowned artists.
Designing reports is an integral step in delivering reports to stakeholders. One could argue that the designer capabilities are the most important aspects of a reporting framework. This idea holds true for Telerik Reporting as well.
Report Designers expect a reporting framework to be easy-to-use and understand. They expect that it is powerful enough to present their ideas as intended. From data inputs to end-user activity, a reporting solution needs to be capable of working within the design intent.
Although, to properly design a report in Telerik Reporting an understanding of the Report Lifecycle is critical. This understanding will empower the designer by providing a framework to work within. Let me briefly review the Report Lifecycle.
Understanding the Report Lifecycle
The Report Lifecycle in Telerik Reporting is composed of three steps. These are defining the report, processing the report and then rendering the report. The steps are sequential and build each other one after the other. To make changes in either step requires starting the lifecycle again. Let me provide an overview of the steps below.

Fig. 1 - The Report Lifecycle
- Defining the Report is the declarative definitions that are created with one of Telerik Reporting's designer tools.
- Processing the Report Definition performs grouping, sorting and filtering calculations. It evaluates the expressions, binds the data sources and triggers binding events.
- Rendering the Processed Report takes the processed report and passes it to one of the many available rendering extensions.
An important consideration at the rendering stage is that each renderer has its own capabilities. For example, paging happens during the rendering stage because it is the only place we can know if paging is needed. To elaborate, a PDF render requires paged format and CSV or XLSX renders do not.
Ultimately, designing a report is the first step in the process. Each of the Telerik Report Designers fit into the First Stage of the Lifecycle. Understanding this Lifecycle provides a solid foundation for designing Reports in Telerik Reporting.
Designing Reports
Because the Web Report Designer is a web application there are some slight differences when using it compared to the Desktop Designers. However, the designer elements and methodologies are very similar. Additionally, the most used components are available but because the Web Designer is in active development some are still missing.
Methodologies Used
The conceptual elements of Telerik Report Designers tools enable simple and visual design. To achieve this report designers can use the drag-and-drop, contextual feedback, wizards, and What-You-See-Is-What-You-Get concepts.
Drag and Drop is a common concept in design that is used in many designer tools. It enables the designer to select the tool or design element, drag it onto the design surface and edit the tool. This is ubiquitous with other concepts like snap to grid as well.
For contextual feedback, the UI will update upon selection of a specific element in the designer. For example, a TextBox has different properties than a DataSource and the properties window will update to accommodate these differences.
To ease of creating complex reports, the designer tools include wizards. The most complex report items like the Graph, the various Data Sources, and Tables/Crosstabs can be created much more simply using the wizards. Wizards are commonly used for complex tasks.
The above concepts compliment the designer's workflow by displaying what the component exactly how it will look like in the report. This is known as What-You-See-Is-What-You-Get. In Telerik Reporting, it provides a live preview of image-based items like the Graph, Map, Barcode and PictureBox. It is very common with complex designers.
The Web Report Designer UI Elements
The Web Report Designer elements are nearly identical to the desktop designer except for some being named differently. These include the Design Surface, Report Components, Report Explorer, and the Properties Area.
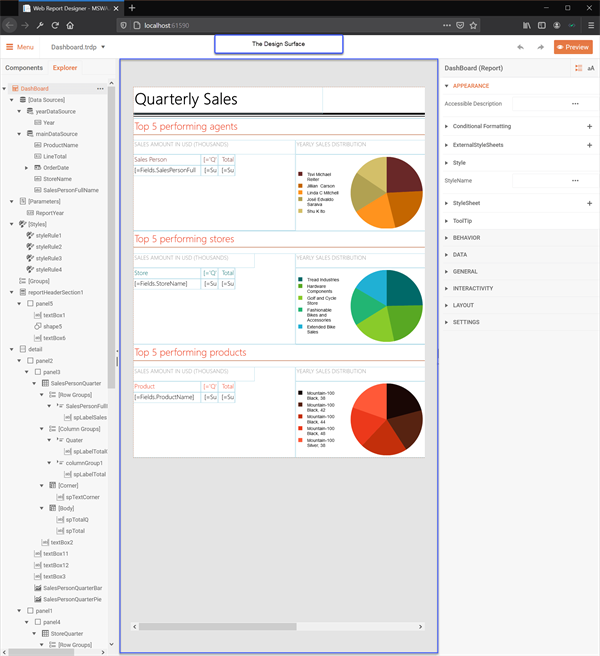
Design Surface UI
The central element in any designer is the design surface. This is where the components are placed and the What-You-See-Is-What-You-Get appears. This is highlighted in the below screenshot.
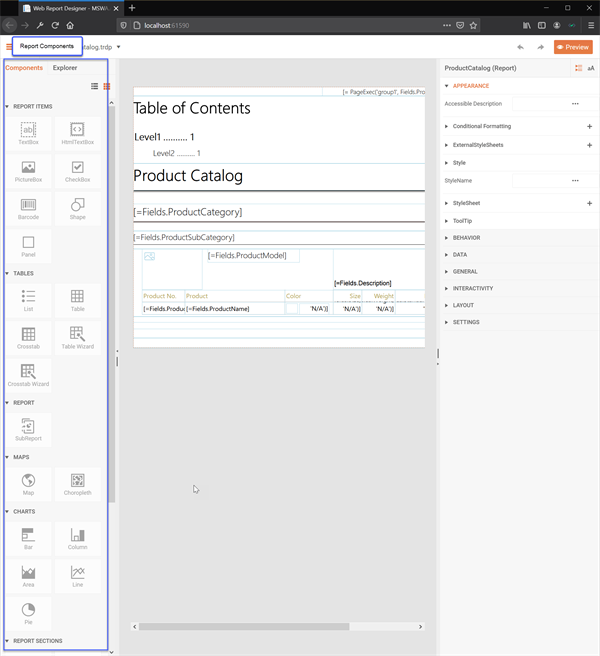
Report Components UI
Reporting Components are found in the Components Tab to the left of the design surface as shown in the next illustration. This is where a designer selects an item to add to the report. It can be viewed as a List or a Grid.
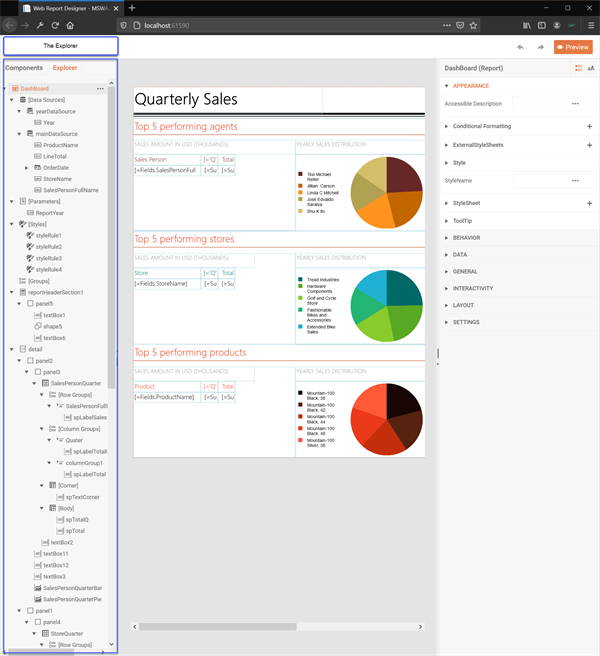
Explorer UI
The Explorer lists everything that has been added to the Report Design Surface. This is synonymous to the Report Explorer in the other designers. However unlike like the other designers, here the Explorer combines the Report Explorer and Data Explorer to avoid showing too many windows.
Fig. 4 - The Explorer
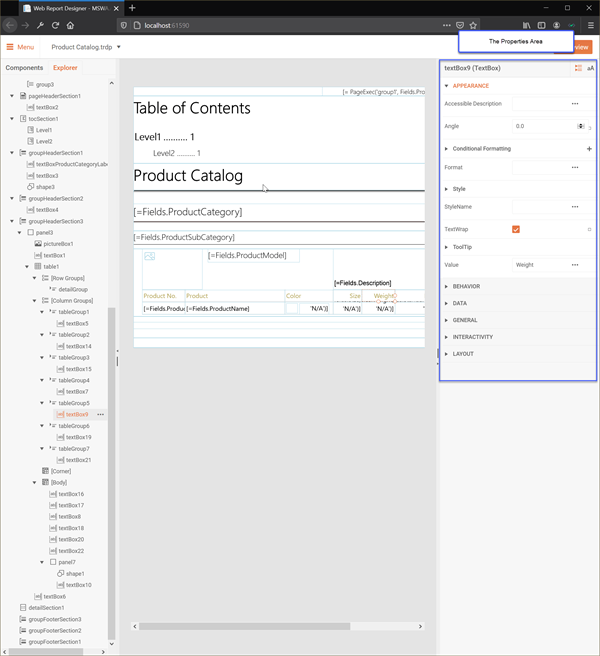
Properties Area UI
The Properties Area is the element that provides the most contextual feedback. It will update as items are selected in the Report. This is because of the many property variations in the Report Components. The following screenshot illustrates the properties area with a TextBox selected.
Fig. 5 - The Properties Area
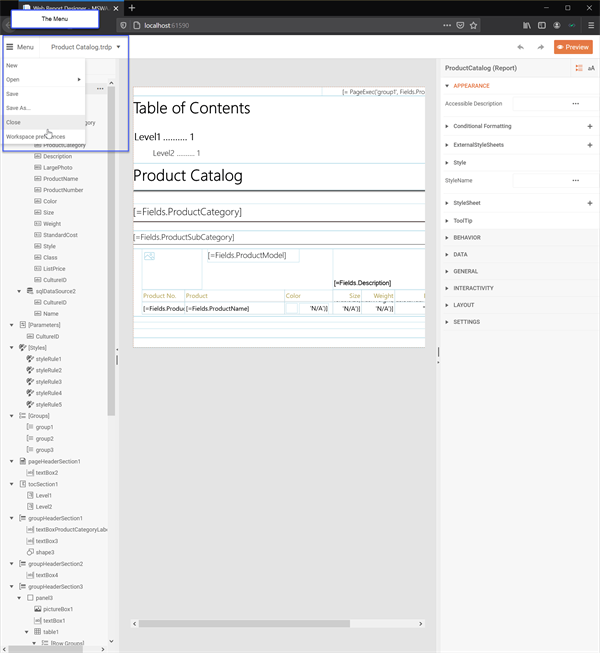
File Menu UI
Like most software, there needs to be a way to manage files. The File Menu is used to create and save definition files. Additionally, workspace preferences can be set. This is like the File Menu in the Standalone Report Designer.
Web Report Designer Components
It is widely-known that desktop applications provide a different user-experience than a web application. The same goes for the Web Report Designer. Those familiar with our desktop designers will notice some subtleties between the designers.
The Web Report Designer includes the most widely used components. These include the Report Items, Data Items, Report Components (SubReport), Maps, as well as Graphs and Data Sources. Unfortunately, there are so many only a working sample with demos can sufficiently illustrate this.
Our public demo includes a wide range of demos that illustrate the many features and components of the Web Report Designer. Below is side-by-side matrix comparing the features in the Desktop designers and the Web Report Designer.
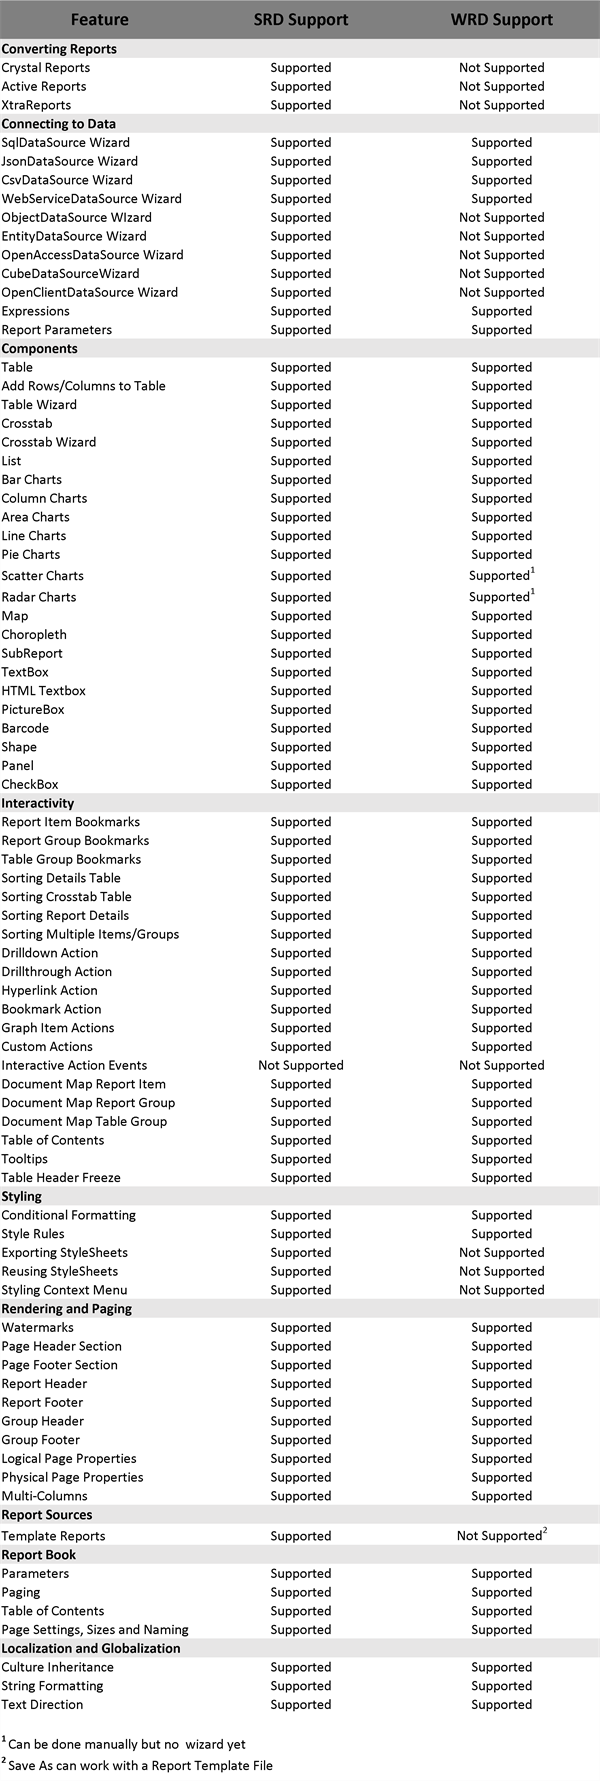
Fig. 7 - Standalone Report Designer Feature Parity Matrix
Now that the methodologies, UI elements and available features are known, it is important to know how to implement the Web Report Designer into an application. We will review that next.
Web Report Designer Architecture
The Web Report Designer is a pure HTML5/CSS3/JS jQuery widget. It uses a dedicated REST Service as a backend. As of this writing, it works with the ASP.NET Core and WebApi 2 flavors. In this section, we will review the requirements and implementation for both.
To follow along, a free sample is available for this blog post on GitHub. It includes our public demos which are used to illustrate setting up the Web Report Designer in an application.Requirements
- The Web Report Designer can be used with either .NET Framework 4.5.1+ or .NET Core 2.1+
- It requires the following assembly references:
- Telerik.Reporting
- Telerik.WebReportDesigner.Services
- The required web frameworks are as follows:
- jQuery 3.3.1+
- Kendo UI 2020.1.114+
- The browser must support JavaScript/EcmaScript 6. These are Google Chrome 77.0+, Mozilla FireFox 69.0+ and Microsoft Edge 79+.
- A subset of the jQuery 1.12.1 library and base themes and styles will be delivered using through the service.
Optional
- The Telerik NuGet Feed configured in Visual Studio.
- Either Visual Studio Code or Visual Studio 2017+ can be used.
Architecture
The Web Designer widget works in a client-server architecture. As usual, the widget is the client, and the REST Service is the server. Those that have used our HTML5-based report viewers will be familiar with this architecture.
In the following sections we will review the client implementations and then the server implementations. Before that I will provide some important prerequisites when I create a sample.
Generally, I create an empty ASP.NET Core or ASP.NET MVC Application with some small changes to the steps in our documentation. Let me go over them below.
- For every sample, I use the Telerik NuGet Feed because it is easier to manage dependencies. I add the required assemblies by simply searching for them in Visual Studio or using the dotnet cli.
- I use composition provided by the framework.
- Both Core and MVC include @RenderSections
- For the Reporting Scripts and Styles these are added to the Report Viewer page in the scripts and styles sections.
- Both Core and MVC include @RenderSections
- I also use CDN wherever possible. I am not debugging 3rd-party frameworks.
- For example, jQuery, Bootstrap and Kendo is delivered via CDN.
ASP.NET Core Client
The process for setting up the designer in an ASP.NET Core application is described in our How-To article. Below is a basic example of what that would look like.
The Layout Page
@{

    ViewData["AppName"] = "MSWA.AspNetCore.Web";

}


<!DOCTYPE html>

<html lang="en">

<head>

    <meta charset="utf-8" />

    <meta name="viewport" content="width=device-width, initial-scale=1, maximum-scale=1" />

    <meta http-equiv="X-UA-Compatible" content="IE=edge" />

    <title>@ViewData["Title"] - @ViewData["AppName"]</title>

    <link rel="stylesheet" href="https://maxcdn.bootstrapcdn.com/bootstrap/4.0.0/css/bootstrap.min.css"

        integrity="sha384-Gn5384xqQ1aoWXA+058RXPxPg6fy4IWvTNh0E263XmFcJlSAwiGgFAW/dAiS6JXm"

        crossorigin="anonymous">

    <link rel="stylesheet" href="~/css/site.css" />


    @RenderSection("styles", required: false)


    <script src="https://code.jquery.com/jquery-3.3.1.min.js"

        integrity="sha256-FgpCb/KJQlLNfOu91ta32o/NMZxltwRo8QtmkMRdAu8="

        crossorigin="anonymous"></script>

    <script src="https://cdnjs.cloudflare.com/ajax/libs/popper.js/1.12.9/umd/popper.min.js"

        integrity="sha384-ApNbgh9B+Y1QKtv3Rn7W3mgPxhU9K/ScQsAP7hUibX39j7fakFPskvXusvfa0b4Q"

        crossorigin="anonymous"></script>

    <script src="https://maxcdn.bootstrapcdn.com/bootstrap/4.0.0/js/bootstrap.min.js"

        integrity="sha384-JZR6Spejh4U02d8jOt6vLEHfe/JQGiRRSQQxSfFWpi1MquVdAyjUar5+76PVCmYl"

        crossorigin="anonymous"></script>

    <script src="https://kendo.cdn.telerik.com/2020.1.114/js/kendo.all.min.js"></script>

    <script src="~/js/site.js" asp-append-version="true"></script>


    @RenderSection("scripts", required: false)

</head>

<body>

    <div class="container">

        <main role="main">

            @RenderBody()

        </main>

    </div>

</body>

</html>
The Report Designer Page
@page

@{
    ViewData["Title"] = "Web Report Designer";
}

@section styles {
    <link href="https://fonts.googleapis.com/css?family=Roboto:400,500&display=swap" rel="stylesheet">
}

@section scripts {

    <script src="api/reportdesigner/resources/js/telerikReportViewer"></script>
    <script src="api/reportdesigner/designerresources/js/webReportDesigner"></script>

    <script type="text/javascript">
        $(document).ready(function () {
            $("#webReportDesigner").telerik_WebReportDesigner({
                persistSession: false,
                toolboxArea: {
                    layout: "list"
                },
                serviceUrl: "api/reportdesigner/",
                report: "Product Catalog.trdp"
            }).data("telerik_WebDesigner");
        });
    </script>

}

<div id="webReportDesigner">
    loading...
</div>
ASP.NET MVC Client
It is important to note that above ASP.NET Core report designer client could also use a plain HTML/CSS/JS page which is illustrated in the documentation article. However, the previous code snippets can also be used in the ASP.NET MVC implementation.
For full details on using ASP.NET MVC, see How to setup the WebReportDesigner in ASP.NET MVC application which also shows a slightly different approach than the code snippets below.
The Layout View
@{
    ViewBag.AppName = "AspNetMvc.Web";
}

<!DOCTYPE html>
<html>
<head>
    <meta charset="utf-8" />
    <meta name="viewport" content="width=device-width, initial-scale=1.0">
    <title>@ViewBag.Title - @ViewBag.AppName</title>
    @Scripts.Render("~/bundles/modernizr")
    <link rel="stylesheet" href="//maxcdn.bootstrapcdn.com/bootstrap/4.0.0/css/bootstrap.min.css"
        integrity="sha384-Gn5384xqQ1aoWXA+058RXPxPg6fy4IWvTNh0E263XmFcJlSAwiGgFAW/dAiS6JXm"
        crossorigin="anonymous">
    <link rel="stylesheet" href="~/Content/Site.css" />
    @RenderSection("styles", required: false)

    <script src="//code.jquery.com/jquery-3.3.1.min.js"
        integrity="sha256-FgpCb/KJQlLNfOu91ta32o/NMZxltwRo8QtmkMRdAu8="
        crossorigin="anonymous"></script>
    <script src="//cdnjs.cloudflare.com/ajax/libs/popper.js/1.12.9/umd/popper.min.js"
        integrity="sha384-ApNbgh9B+Y1QKtv3Rn7W3mgPxhU9K/ScQsAP7hUibX39j7fakFPskvXusvfa0b4Q"
        crossorigin="anonymous"></script>
    <script src="//maxcdn.bootstrapcdn.com/bootstrap/4.0.0/js/bootstrap.min.js"
        integrity="sha384-JZR6Spejh4U02d8jOt6vLEHfe/JQGiRRSQQxSfFWpi1MquVdAyjUar5+76PVCmYl"
        crossorigin="anonymous"></script>
    <script src="//kendo.cdn.telerik.com/2020.1.114/js/kendo.all.min.js"></script>
    @RenderSection("scripts", required: false)
</head>
<body>
    <div class="container body-content">
        @RenderBody()
    </div>
</body>
</html>
The Report Designer View
@{
    ViewBag.Title = "Web Report Designer";
}

@section styles {
    <link href="//fonts.googleapis.com/css?family=Roboto:400,500&display=swap" rel="stylesheet">
}

@section scripts {
    <script src="~/api/reportdesigner/resources/js/telerikReportViewer"></script>
    <script src="~/api/reportdesigner/designerresources/js/webReportDesigner"></script>

    <script type="text/javascript">
        $(document).ready(function () {
            $("#webReportDesigner").telerik_WebReportDesigner({
                persistSession: false,
                toolboxArea: {
                    layout: "list"
                },
                serviceUrl: "api/reportdesigner/",
                report: "Product Catalog.trdp"
            }).data("telerik_WebDesigner");
        });
    </script>

}

<div id="webReportDesigner">
    loading...
</div>
The Web Report Designer REST Service
Similarly to our Report Viewers, the Web Report Designer uses a REST Backend. In fact, the ReportDesignerControllerBase API inherits from the ReportControllerBase API that is used in the Reporting REST Service implementation.
The major difference between the ASP.NET Core and the ASP.NET MVC implementations are the framework capabilities. Mainly, ASP.NET Core includes Dependency Injection and MVC does not. Other than that, the configuration will be nearly identical.
ASP.NET Core Web Report Designer Service
ASP.NET Core uses a Startup class to configure its applications. The Web Report Designer in ASP.NET Core is also configured here as well. The configuration will include a section for the ReportingService and the WebReportDesignerService as shown in the following code snippet.
public class Startup
{
    public Startup(IConfiguration configuration)
    {
        Configuration = configuration;
    }

    public IConfiguration Configuration { get; }

    public void ConfigureServices(IServiceCollection services)
    {
        // Add CORS (This is open for illustrative purposes)
        services.AddCors(opts =>
        {
            opts.AddDefaultPolicy(p =>
            {
                p.AllowAnyOrigin();
                p.AllowAnyMethod();
                p.AllowAnyHeader();
            });
        });

        // Add WebAPI for ASP.NET Core
        services.AddControllers();

        // Add Razor Pages
        services.AddRazorPages()
            .AddNewtonsoftJson();

        // Add the IIS Synchronous IO
        services.Configure<IISServerOptions>(options =>
        {
            options.AllowSynchronousIO = true;
        });

        // Configure dependencies for ReportServiceConfiguration.
        services.TryAddSingleton<IReportServiceConfiguration>(sp =>
            new ReportServiceConfiguration
            {
                ReportingEngineConfiguration = sp.GetRequiredService<IConfiguration>(),
                HostAppId = "DotNetCoreApp",
                Storage = new FileStorage(),
                ReportSourceResolver = new TypeReportSourceResolver()
                .AddFallbackResolver(new UriReportSourceResolver(
                    Path.Combine(sp.GetService<IWebHostEnvironment>().ContentRootPath, "Reports")))
            });

        // Configure dependencies for ReportDesignerServiceConfiguration.
        services.TryAddSingleton<IReportDesignerServiceConfiguration>(sp => new ReportDesignerServiceConfiguration {
            DefinitionStorage = new FileDefinitionStorage(Path.Combine(sp.GetService<IWebHostEnvironment>().ContentRootPath, "Reports")),
            SettingsStorage = new FileSettingsStorage(Path.Combine(Environment.GetFolderPath(Environment.SpecialFolder.ApplicationData), "Telerik Reporting")),
            ResourceStorage = new ResourceStorage(Path.Combine(sp.GetService<IWebHostEnvironment>().ContentRootPath, "Reports", "Resources")),
        });
    }

    public void Configure(IApplicationBuilder app, IWebHostEnvironment env)
    {
        if (env.IsDevelopment())
        {
            app.UseDeveloperExceptionPage();
        }

        // Uses CORS
        app.UseCors();

        // Uses Static Files
        app.UseStaticFiles();

        // Uses Routing
        app.UseRouting();

        // Maps Web API and Razor Pages
        app.UseEndpoints(endpoints =>
        {
            endpoints.MapControllers();
            endpoints.MapRazorPages();
        });
    }
}
ASP.NET Core's Dependency Injection makes the controller implementation simple as shown in the below code snippet.
[Route("api/[controller]")]
public class ReportDesignerController : ReportDesignerControllerBase
{
    public ReportDesignerController(IReportDesignerServiceConfiguration reportDesignerServiceConfiguration,
        IReportServiceConfiguration reportServiceConfiguration)
        : base(reportDesignerServiceConfiguration, reportServiceConfiguration)
    { }
}
ASP.NET MVC Web Report Designer Service
ASP.NET MVC configuration will need to be in the constructor of the controller. This is also exactly like the MVC Report Viewer implementations as well. Furthermore, it will also include both the ReportService and ReportDesignerService configurations.
public class ReportDesignerController : ReportDesignerControllerBase
{
    static readonly ReportServiceConfiguration ConfigurationInstance;
    static readonly ReportDesignerServiceConfiguration DesignerConfigurationInstance;

    static ReportDesignerController()
    {
        //This is the folder that contains the report definitions
        //In this case this is the Reports folder
        string reportsPath = Path.Combine(HttpContext.Current.Server.MapPath("~/"), "Reports");

        //Setup the ReportServiceConfiguration
        ConfigurationInstance = new ReportServiceConfiguration
        {
            HostAppId = "AspNetMvcApp",
            Storage = new FileStorage(),
            ReportSourceResolver = CreateResolver(reportsPath),
            //ReportSharingTimeout = 1000,
            //ClientSessionTimeout = 20,
        };

        DesignerConfigurationInstance = new ReportDesignerServiceConfiguration
        {
            DefinitionStorage = new FileDefinitionStorage(reportsPath),
            SettingsStorage = new FileSettingsStorage(Path.Combine(Environment.GetFolderPath(Environment.SpecialFolder.ApplicationData), "Telerik Reporting"))
        };
    }

    public ReportDesignerController()
    {
        //Initialize the service configuration
        ReportServiceConfiguration = ConfigurationInstance;
        ReportDesignerServiceConfiguration = DesignerConfigurationInstance;
    }

    static IReportSourceResolver CreateResolver(string reportsPath)
    {
        return new UriReportSourceResolver(reportsPath)
            .AddFallbackResolver(new TypeReportSourceResolver());
    }
}
That covers the specifics of setting up the Web Report Designer Client and the Web Report Designer Service in either an ASP.NET Core or ASP.NET MVC application. Additionally, it provides additional information for requirements and recommended steps. However, there are some additional complexities that should be addressed as well.
Complexities with the Web Report Designer
The Web Report Designer delivers powerful report design capabilities at near feature parity to our desktop designers. However, since this is delivered over the web some features will be more complex. These include handling databases and report file management.
Handling Databases
Connection strings for databases are made available through the SqlDataSource Wizard using the application configuration file through the ISettingsStorage interface. The end-user can save connection strings to the local Web Report Designer settings file using the default FileSettingsStorage implementation.
Report File Management
Out-of-the-box the Web Report Designer uses the FileDefinitionStorage implementation which enables managing files using the file system. A bonus is that all the Storage API methods are virtual and can be overridden and modified. These virtual methods enable implementing Custom Report Definition Storage.
Conclusion
This concludes part two of the Report Designer series. We reviewed some important design concepts for all of our designers, feature parity between the desktop designer and the web designer along with the Web Report Designer Architecture across both ASP.NET Core and MVC. Lastly, we reviewed important complexities of the Web Report designer.
I hope that you enjoyed a more detailed review of the Web Report Designer. I intended for this post to be more technical in nature. In the next post, I will include more technical information for the desktop designers and walk through building a report. I imagine there will be some overlap.
Want to Try Telerik Reporting?
Telerik Reporting is a complete, easy-to-use, and powerful .NET embedded reporting tool for web and desktop applications that support: ASP.NET Core, Blazor, ASP.NET MVC, ASP.NET AJAX, HTML5/JS, Angular, React,Vue, WPF, WinForms. Also available as a part of our Telerik DevCraft Complete bundle, Reporting allows you to create, style, view, and export rich, interactive, and reusable reports to attractively present analytical and any business data. Add reports to any business application through report viewer controls. Export the ready reports in more than 15 formats. Download a FREE trial today.

Eric Rohler
Eric was a Technical Support Engineer at Progress.

