
Adding Kendo UI Charts to Our To-Do App

Summarize with AI:
A quick overview to help you add Kendo UI charts to the to-do app we created last time. Check out the full video series for more.
Hello and welcome back to Angular and Kendo UI Unite! If you are new to this series, I highly suggest you start with the first post here, or check out the video series these posts are based on! In today's video, I thought it would be super fun to add a chart to our to-do app that shows the busiest time of day. Let's jump in.
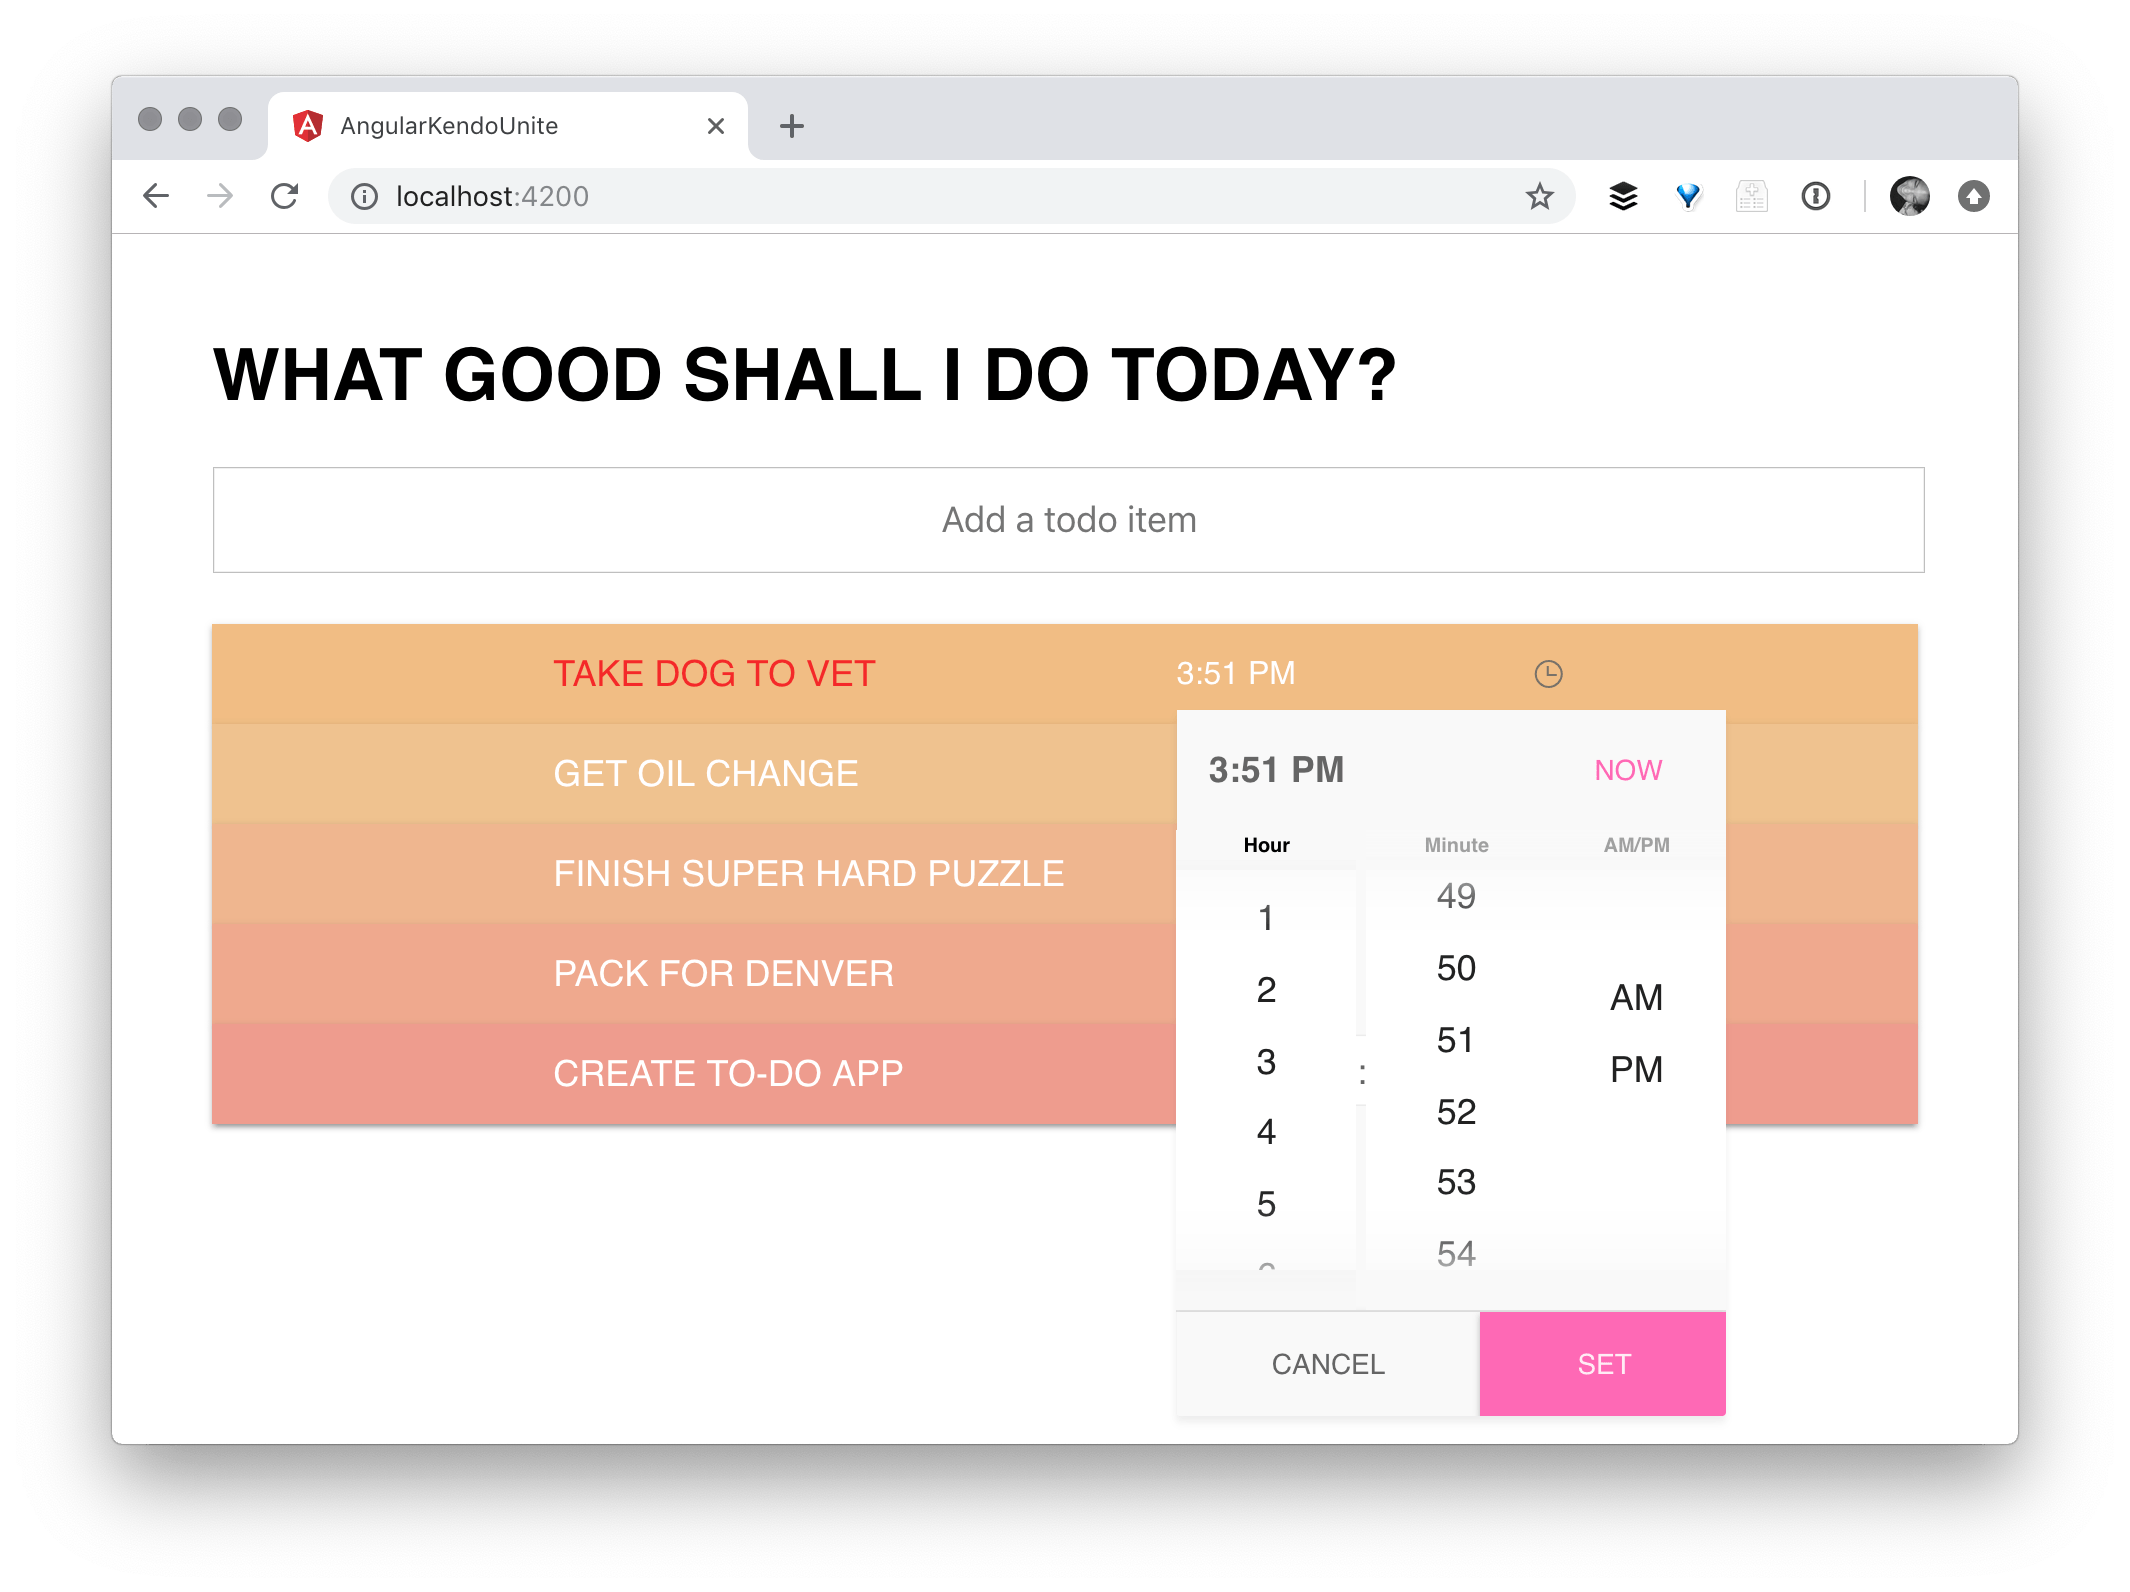
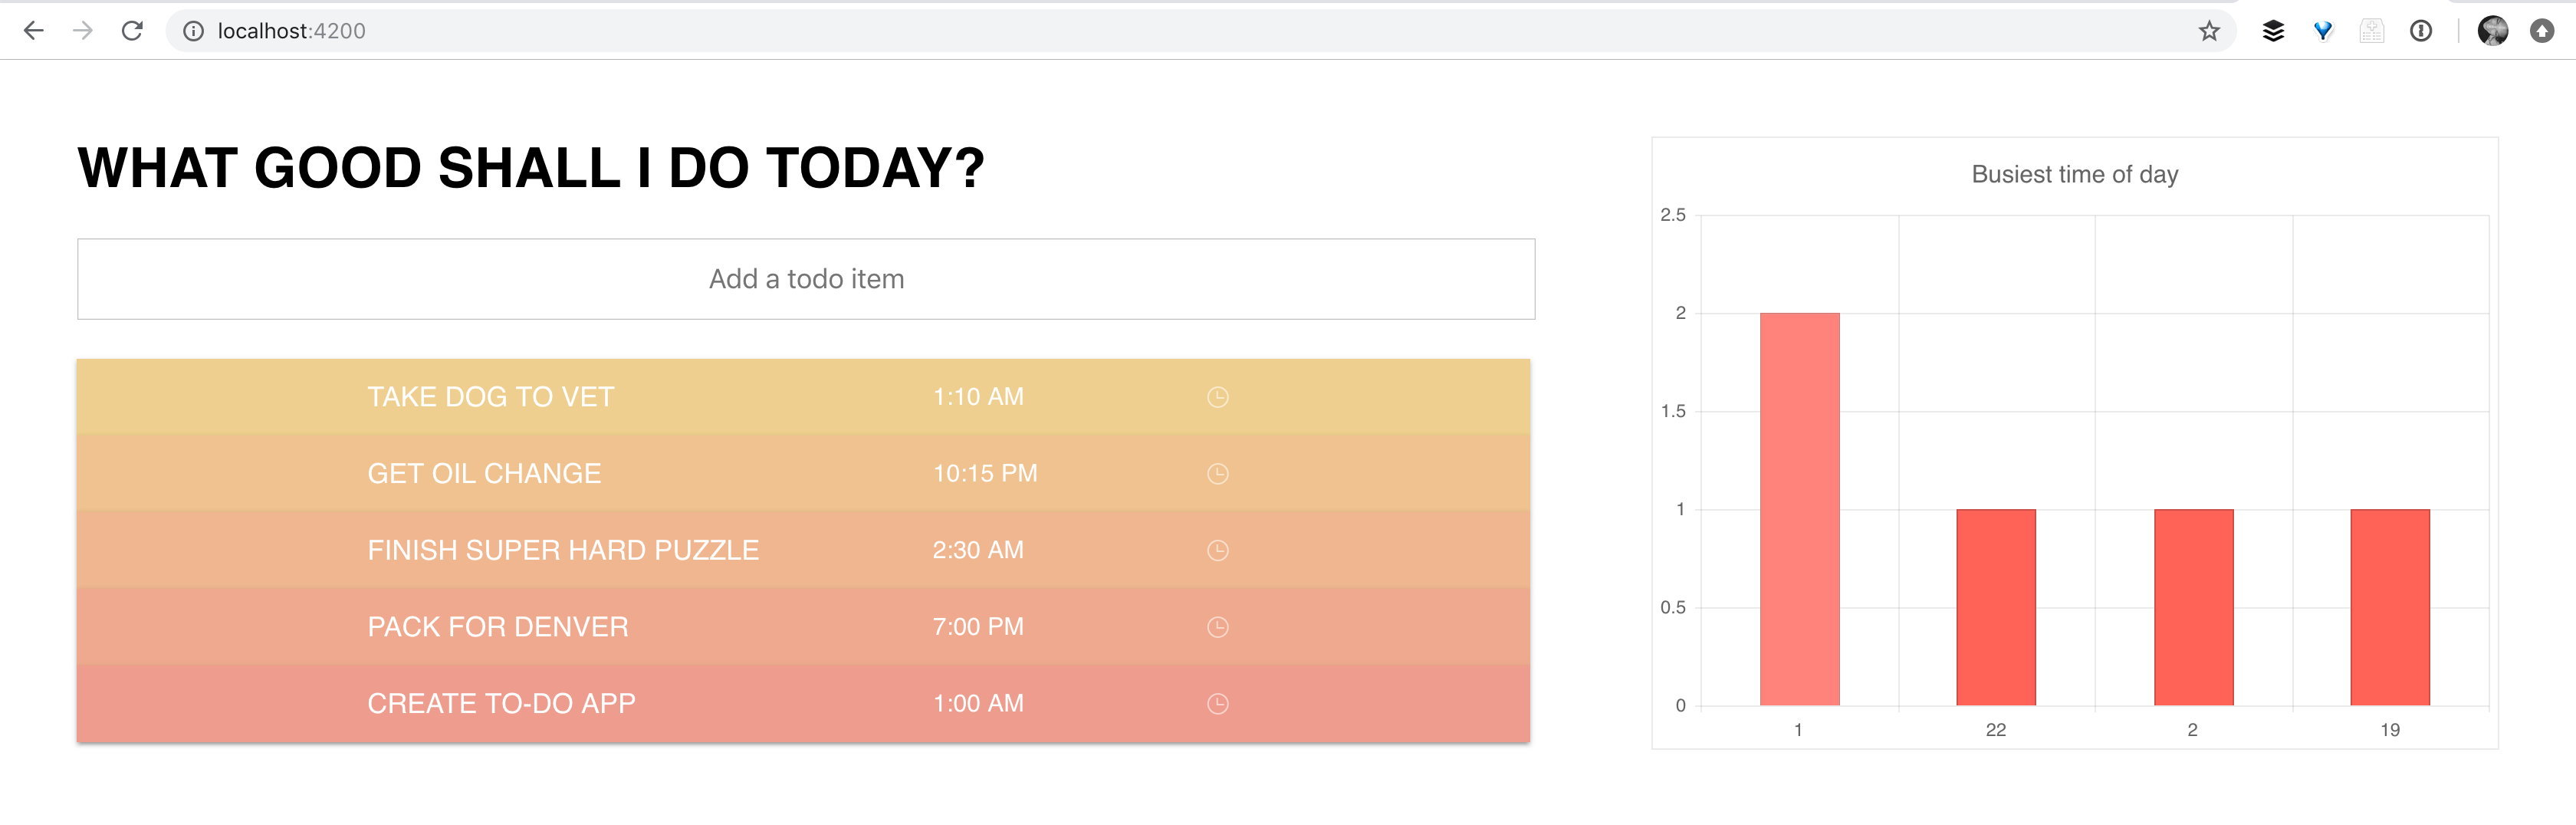
Here's our app as we left it. We have our awesome to-do list using Kendo UI inputs and buttons, and we're using custom Angular animations on load in, add an item and remove an item to make the app look super snazzy. We also added a time picker during the last episode that allows us to go ahead and set a due time for each of the to-do items.
Follow along with the code found here.
We're going to use the to-do data from our app to populate a chart showing which hours in our day are the busiest. To do that, we need to use a Kendo UI Chart.
Kendo UI has many different charts with lots of awesome options. I highly suggest you check out our docs and see all of the very cool examples we have there.
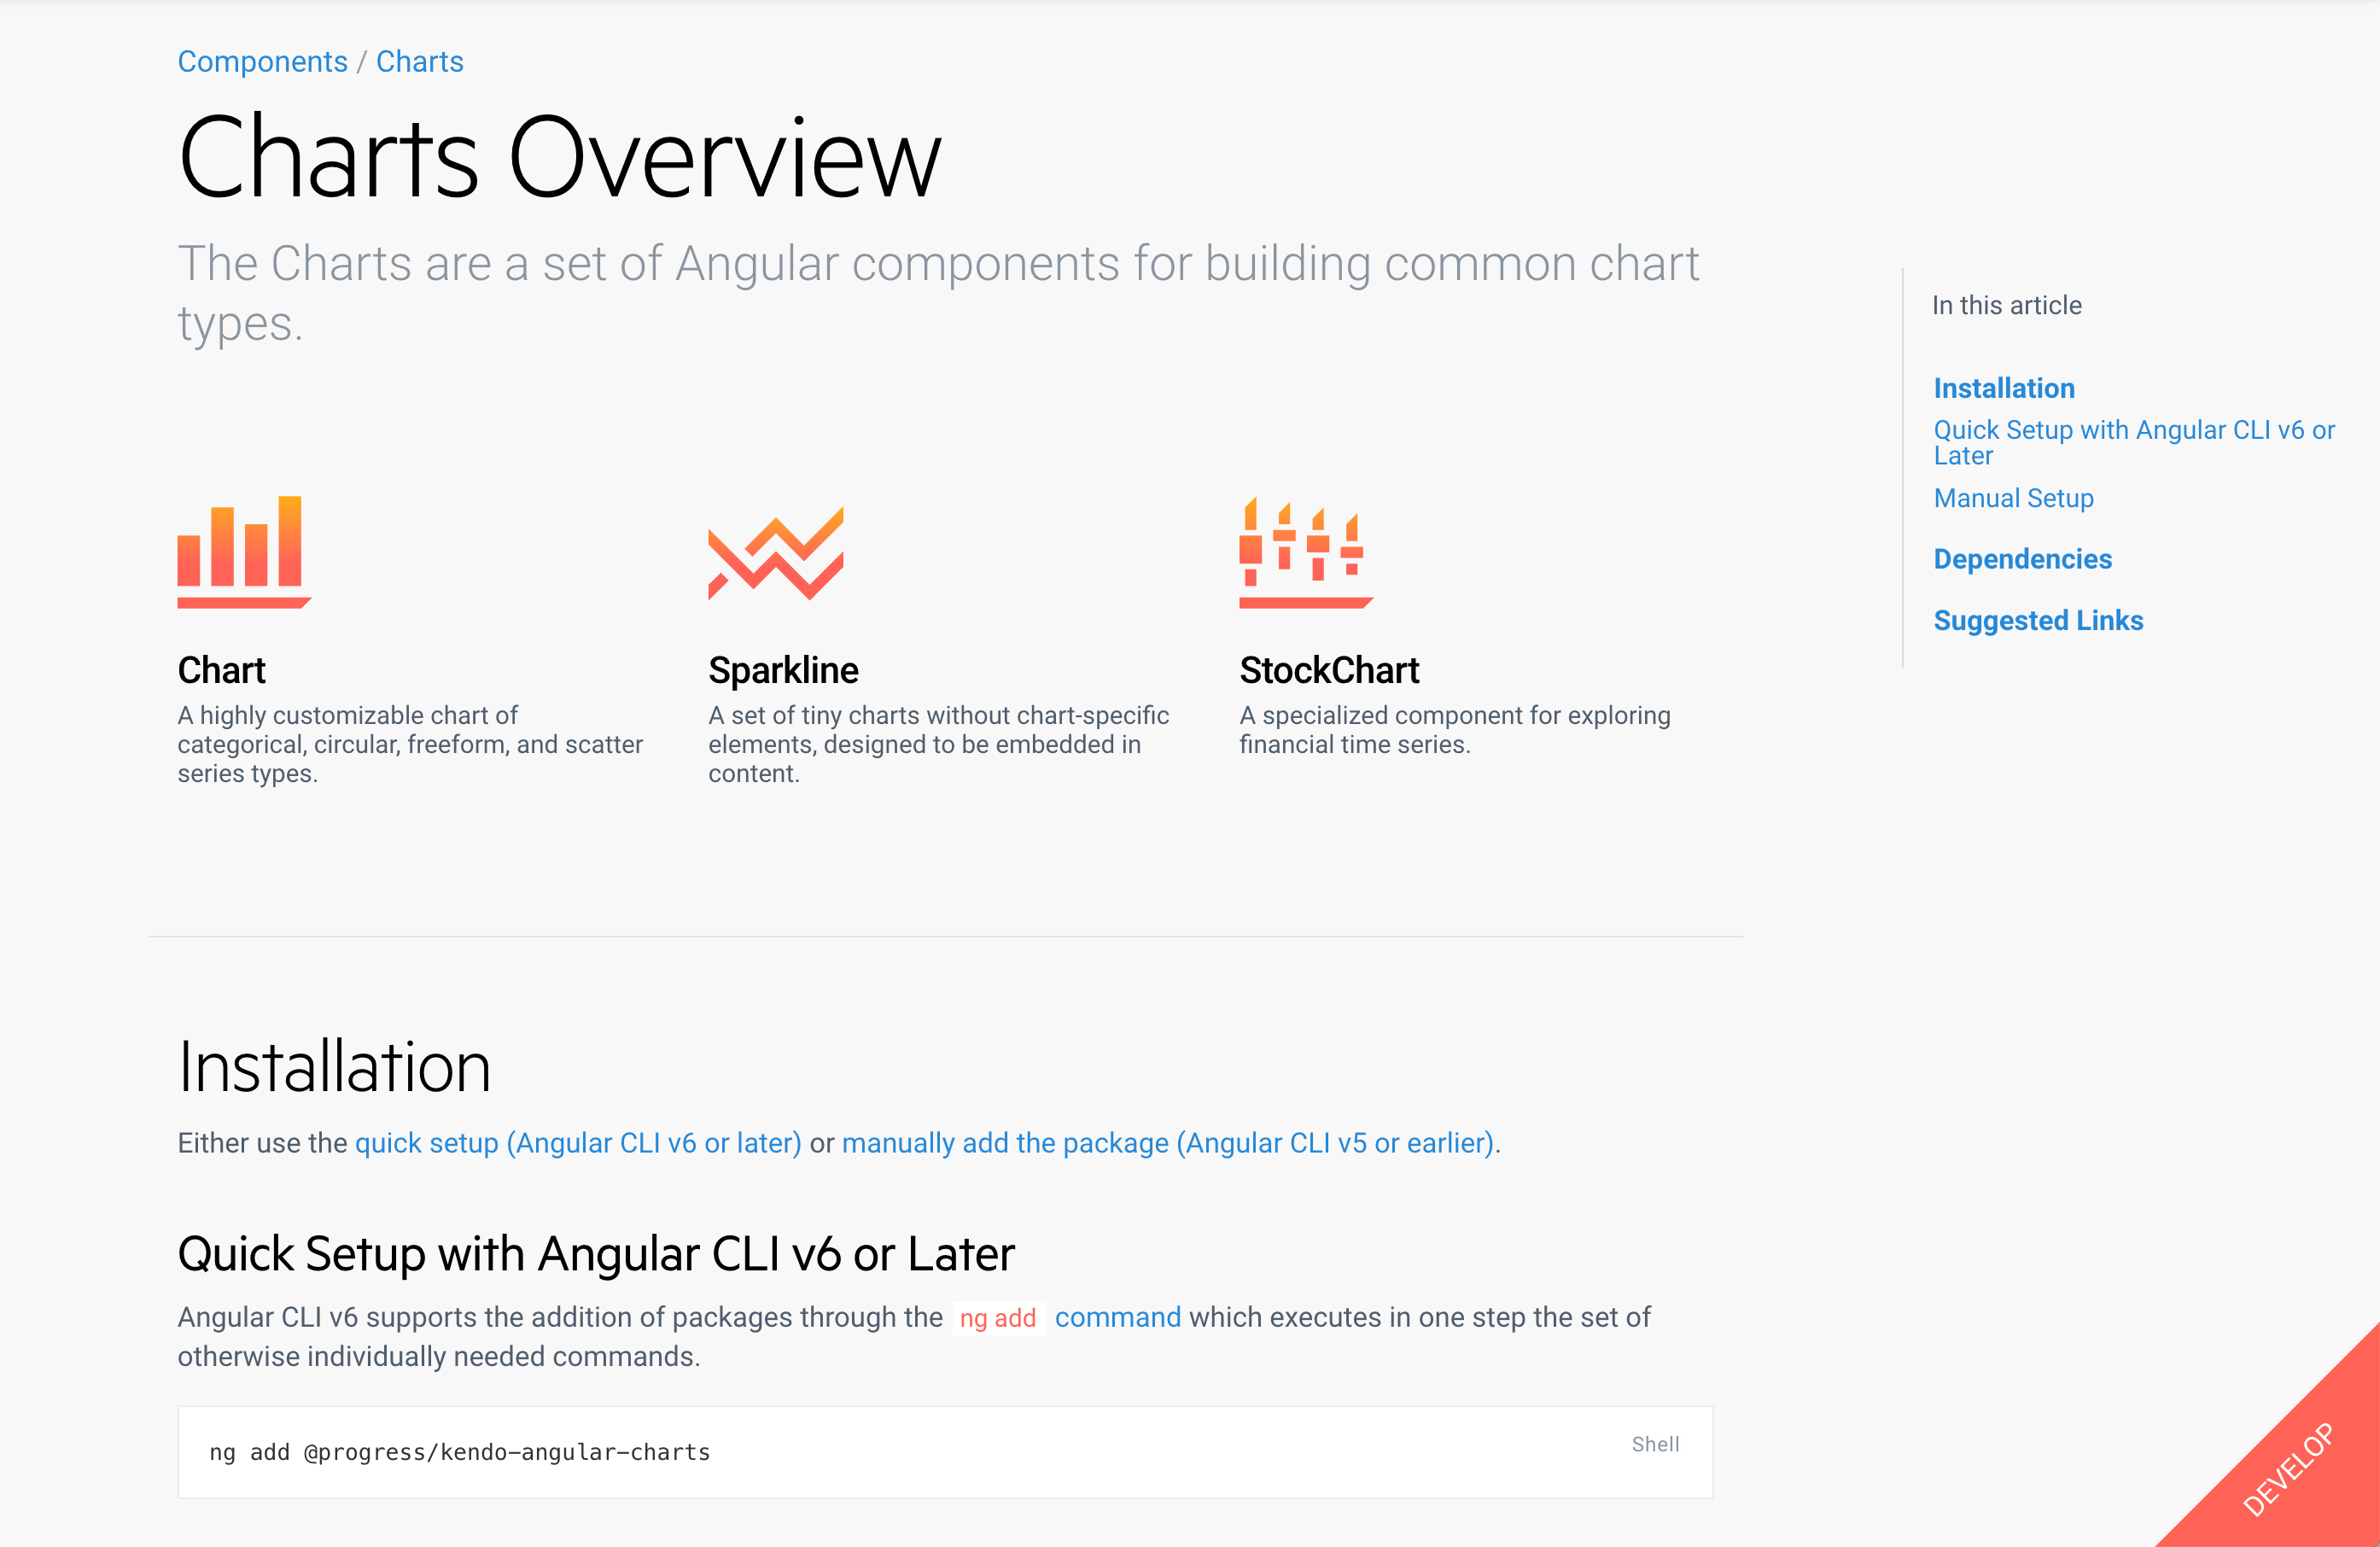
But, to get started with ours, in our application, we just need to do the installation, and thanks to the Angular CLI version six, we can just use this NG add command: ng add@progress/Kendo-Angular-charts.
If we go back over to our todo.component.ts, I'll show you a couple of things that have changed since last we met. I went ahead and created an interface with item due and hour.
interface Todo {
  item: string;
  due:  Date;
  hour: number;
}
Now, item and due were already there from the time picker episode, but if we go to our to-do's, open it up and check it out, you'll see that I've also added an hour key. This uses a new date that's identical to due, but it's also using a custom pipe that I created.
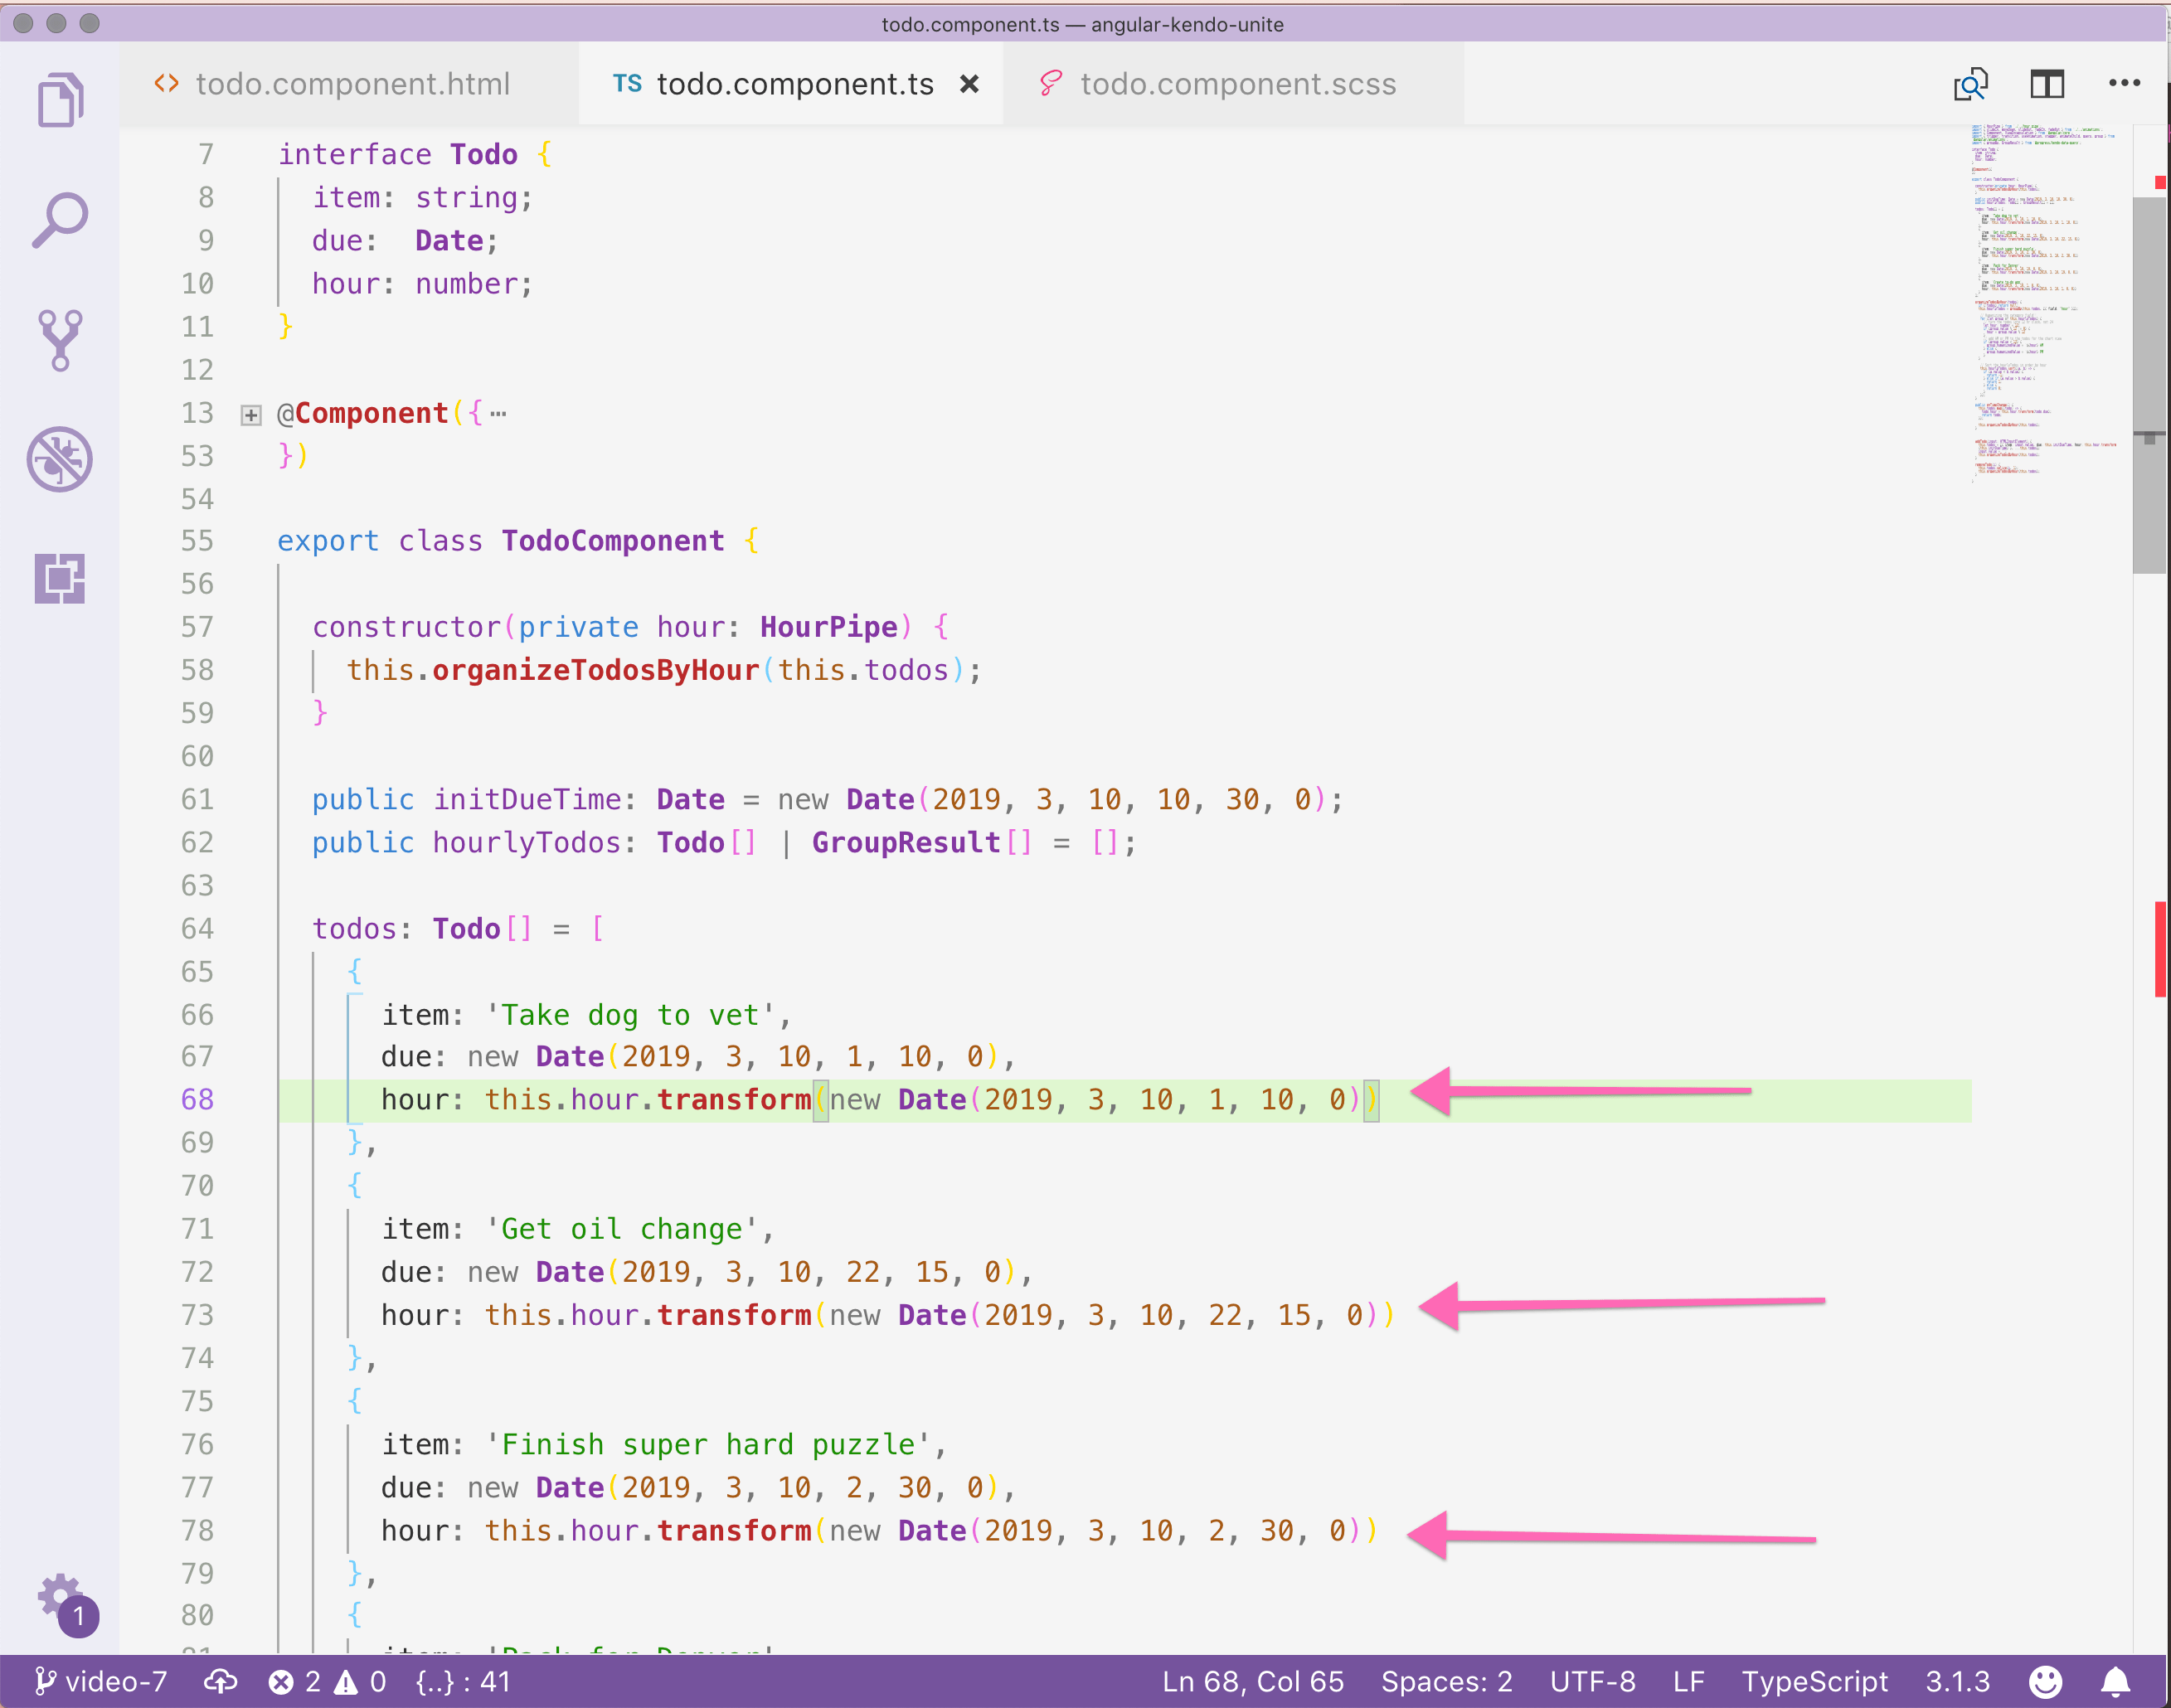
So, for those of you who didn't know, Angular enables you to use a pipe in a template, or you can actually use it with a .transform method inside of your component itself. Let me show off the custom pipe I created real quick.
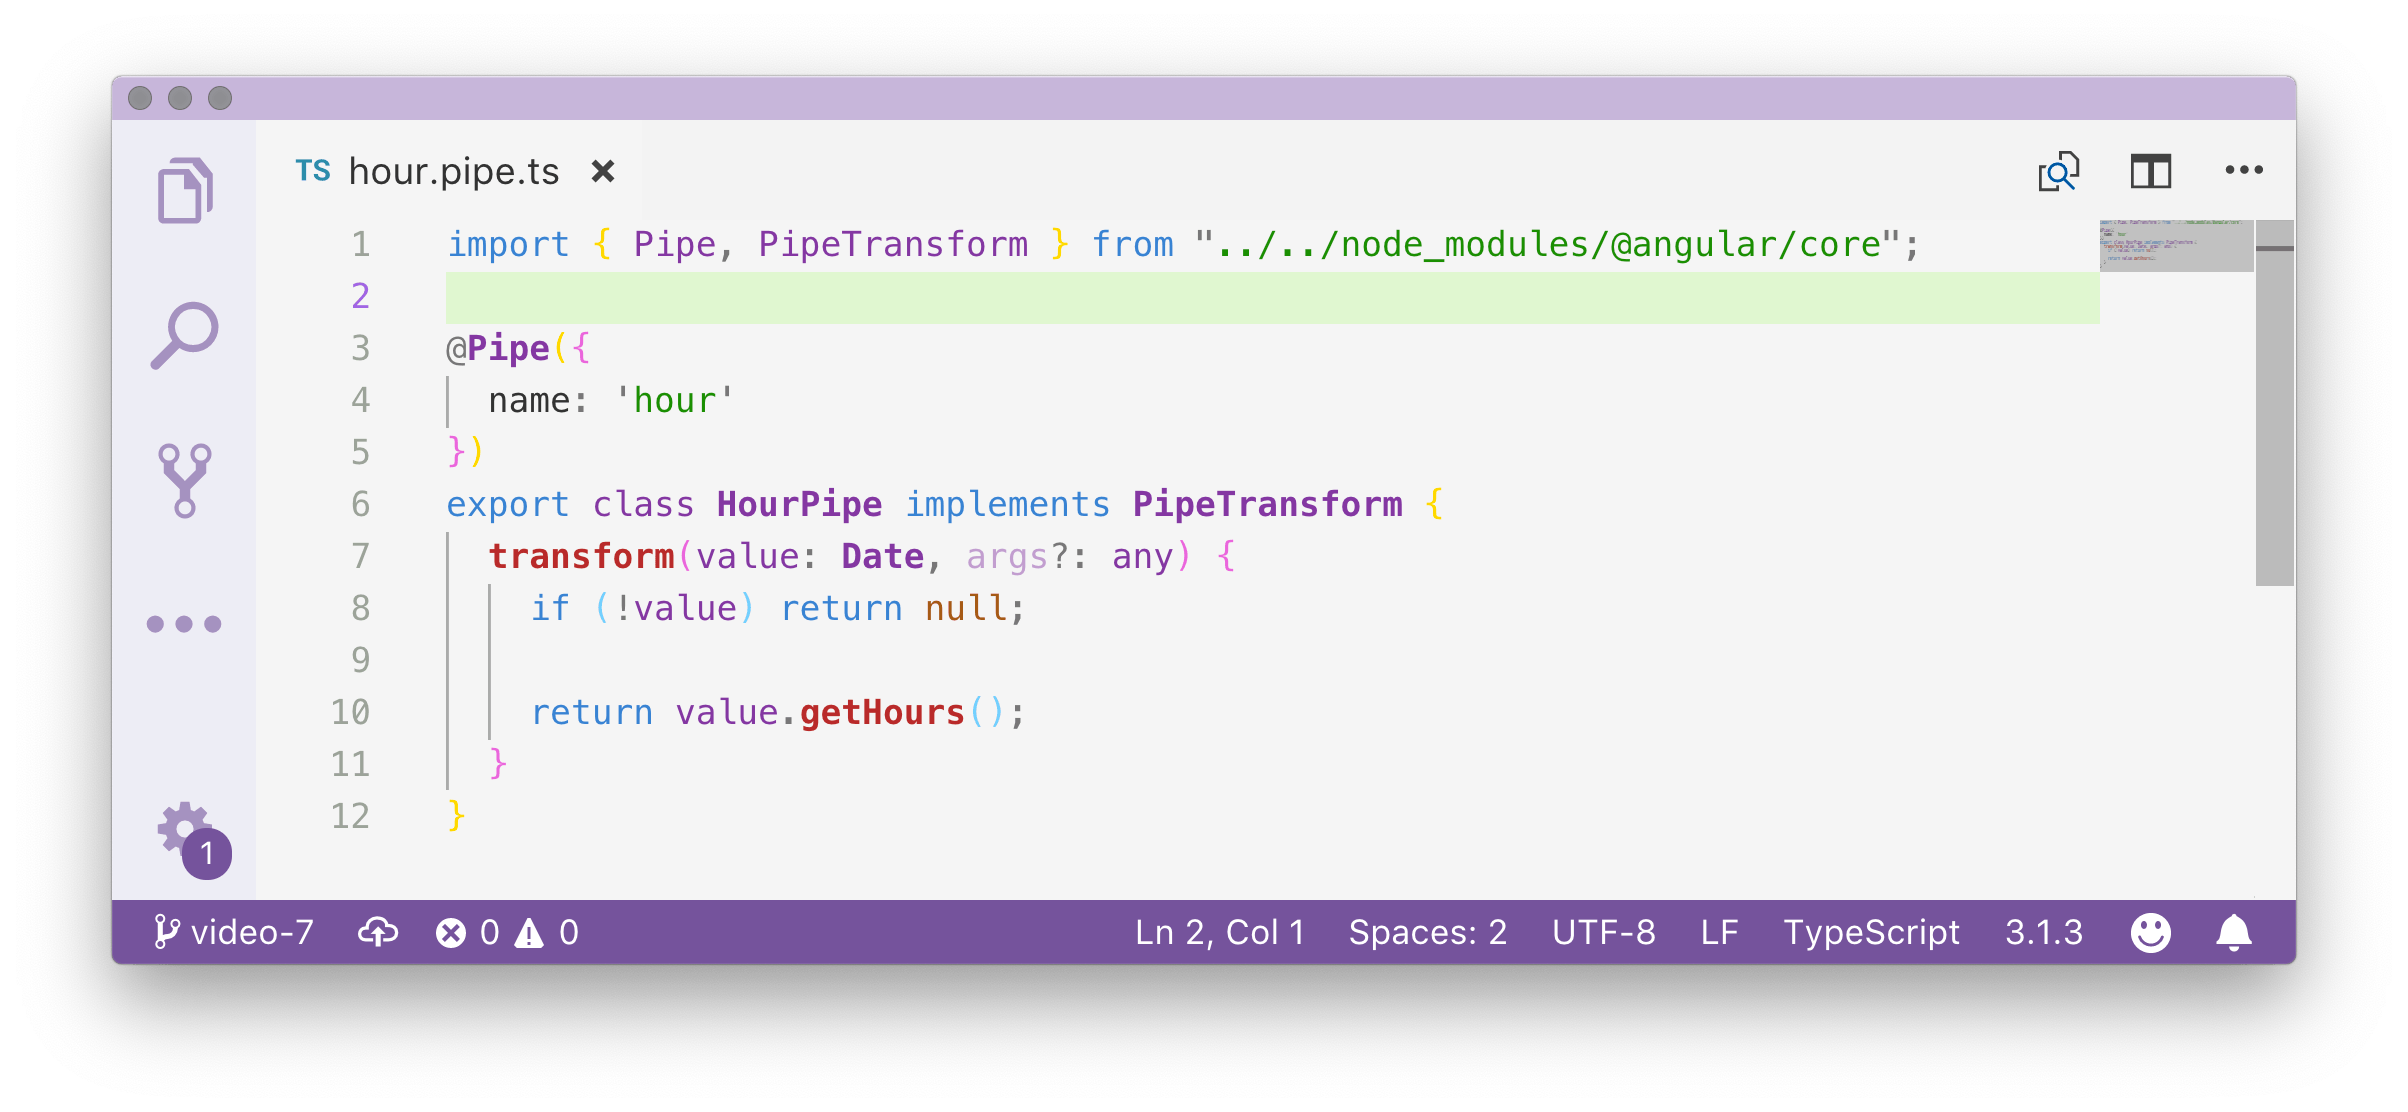
Super simple. Literally, all it's doing is taking the value, which is a date value, and it's getting the hour off of that value. So if the due time is 2:30 a.m., it will change this to 2. If the due time is 10:15 p.m., it will give us the value 22.
The next step is actually organizing our to-do's by the hour. What do I mean? Well, we can't use our to-do's data as it is. We actually need to group it by the hour. So, for instance, if 1:00 a.m. has multiple items, we need to group those together and put them in a group. That way we can make a chart and clearly convey to users, "hey, look 1:00 a.m. is super busy."
So, Kendo UI actually has a group by method, and I'm going to open up our docs to show that off here.
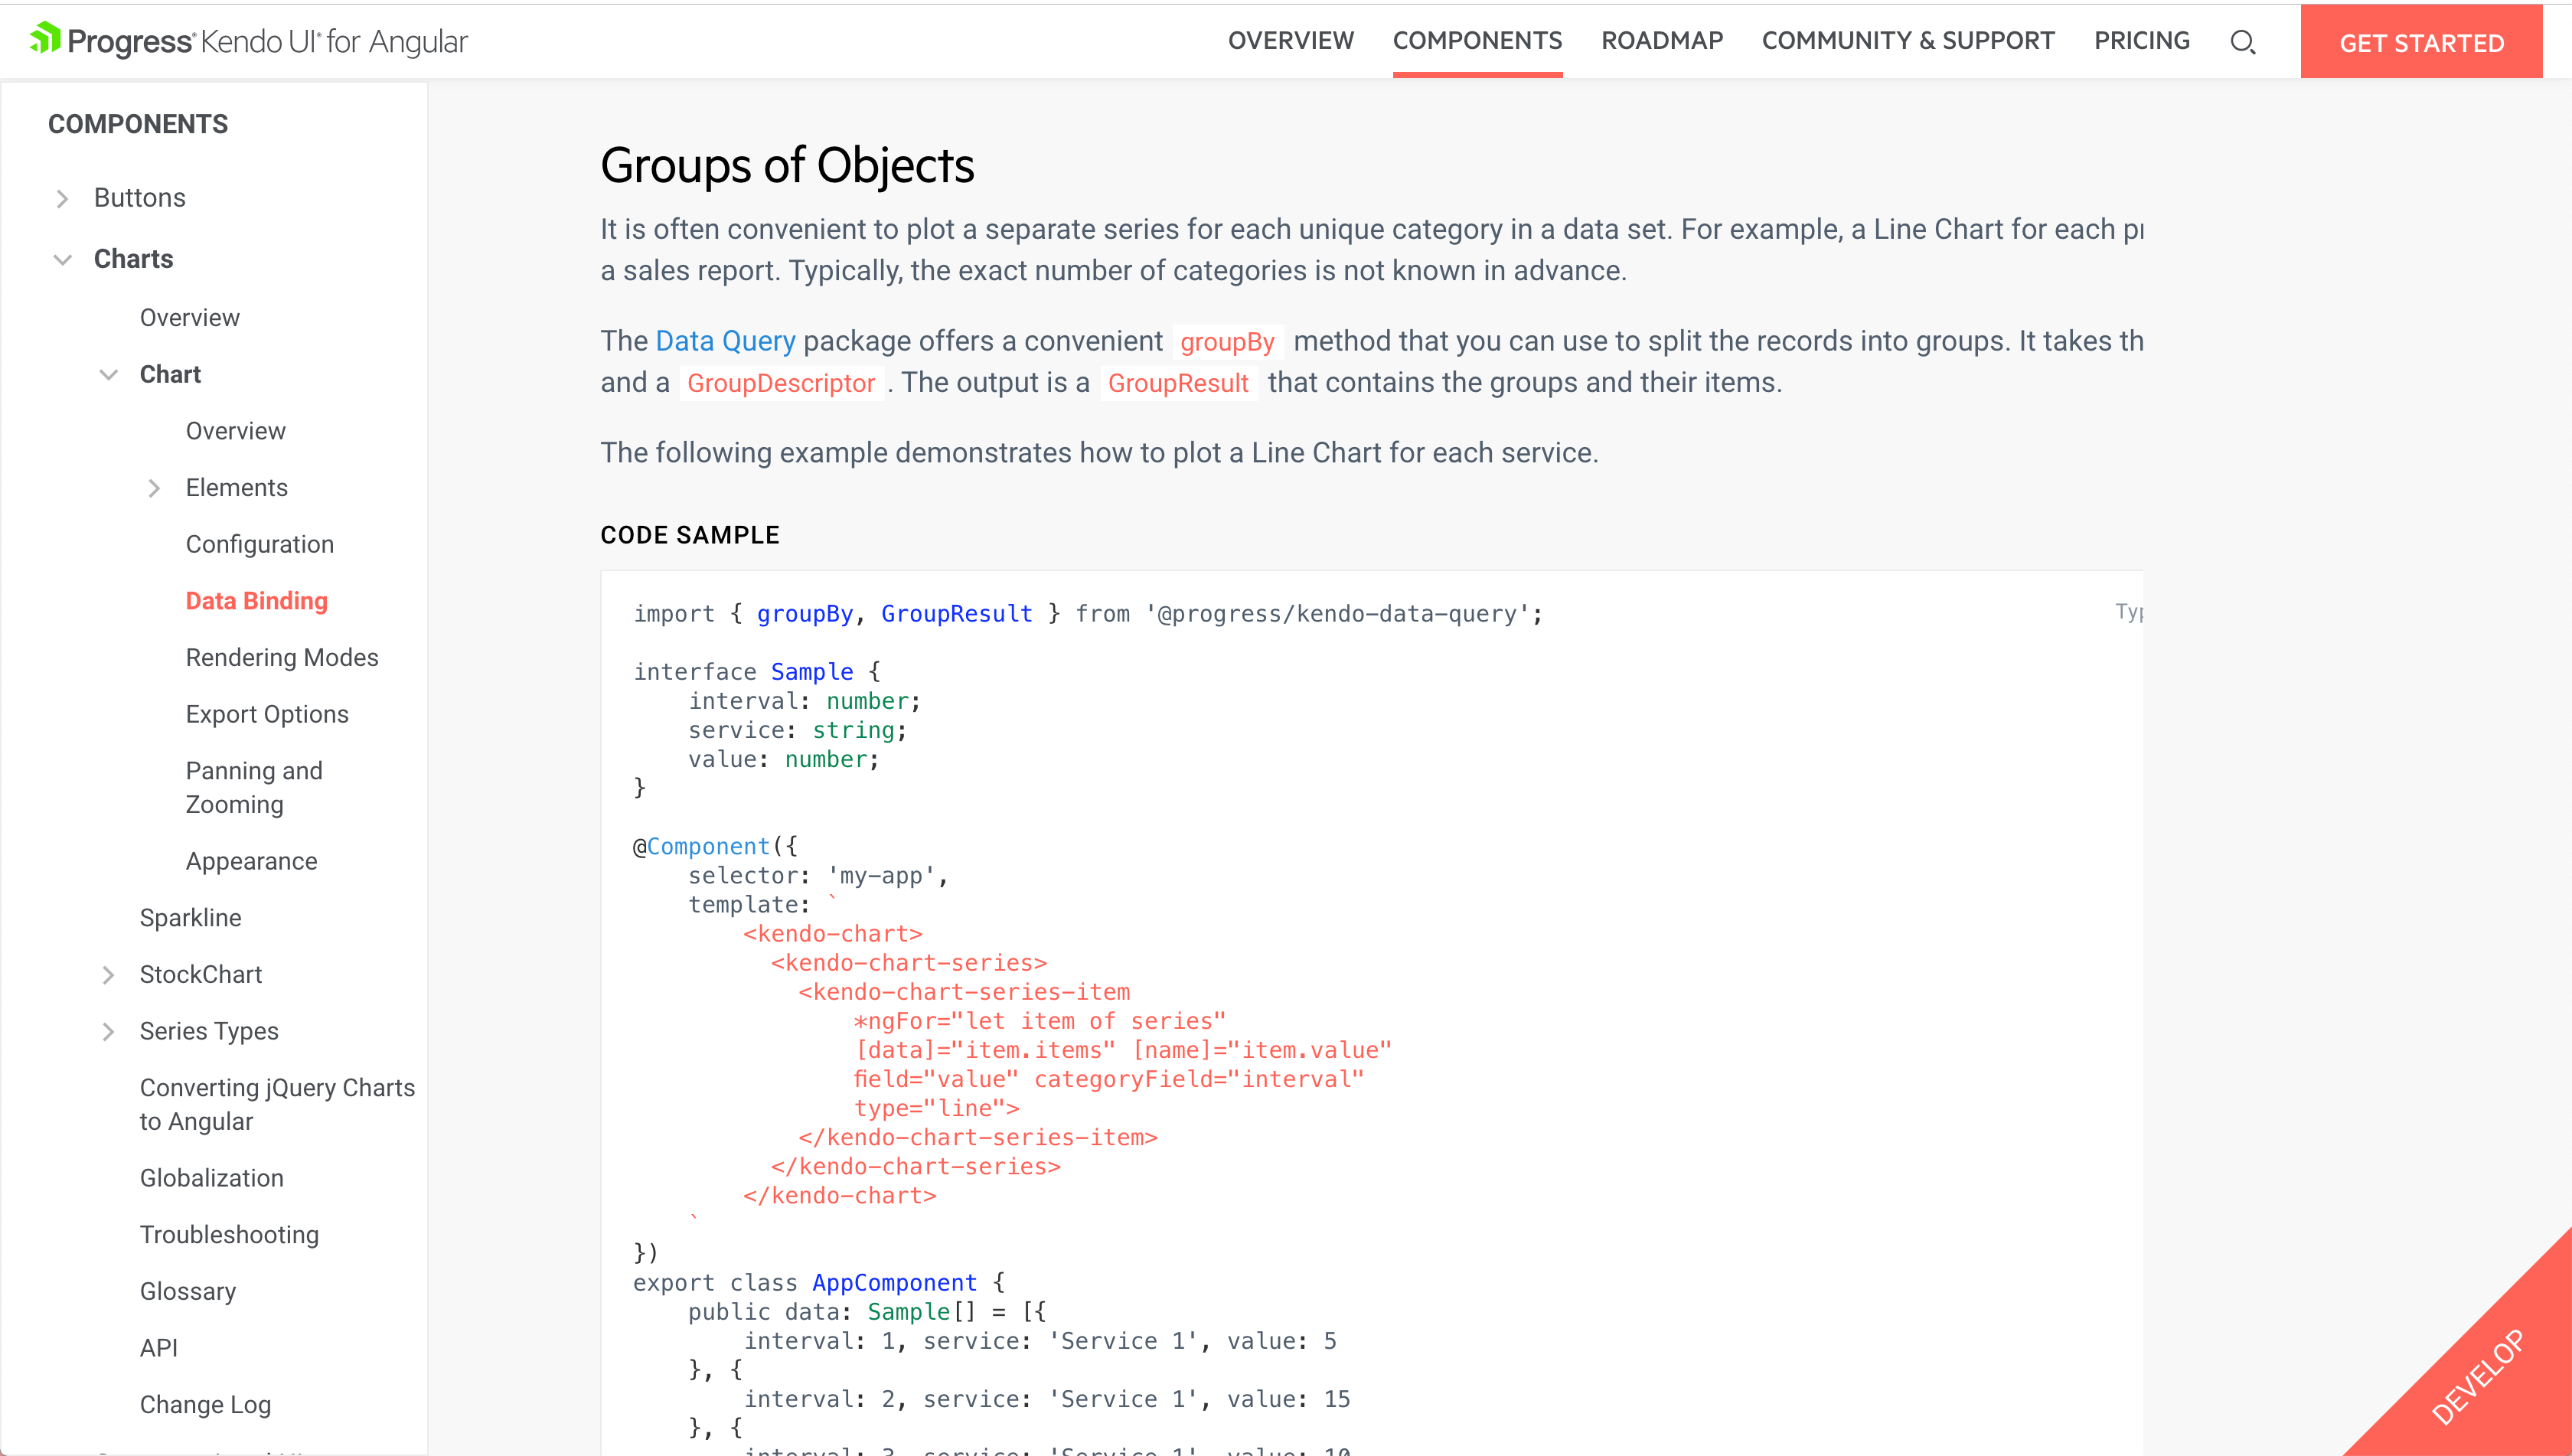
In order to use our chart's group by method, we’ll need to npm install and import the data query package!
Install Kendo Data Query
npm install --save @progress/kendo-data-query
npm install --save @progress/kendo-data-queryImport Kendo Data Query
import { groupBy, GroupResult } from '@progress/kendo-data-query';At the top of our todo.component.ts, I'm importing groupBy and GroupResult from Kendo Data Query. What this is going to allow us to do is pretty much exactly what the function is called: organize to-do's by hour.
If there are no todos, go ahead and return null. Otherwise, we're going to take this.hourlyTodos and we're setting it to group by.
  organizeTodosByHour(todos) {
    if (!todos) return null;
    this.hourlyTodos = groupBy(this.todos, [{ field: "hour" }]);
    console.log(JSON.stringify(this.hourlyTodos, null, 2));
  }
I’m console logging with JSON.stringify, so that we can see what exactly our method is doing to our to-do's array. How is it reorganizing it? If we head back over to the console, we can see the logs:
[
  {
    "aggregates": {},
    "field": "hour",
    "items": [
      {
        "item": "Take dog to vet",
        "due": "2019-04-10T06:10:00.000Z",
        "hour": 1
      },
      {
        "item": "Create to-do app",
        "due": "2019-04-10T06:00:00.000Z",
        "hour": 1
      }
    ],
    "value": 1
  },
  {
    "aggregates": {},
    "field": "hour",
    "items": [
      {
        "item": "Get oil change",
        "due": "2019-04-11T03:15:00.000Z",
        "hour": 22
      }
    ],
    "value": 22
  },
  {
    "aggregates": {},
    "field": "hour",
    "items": [
      {
        "item": "Finish super hard puzzle",
        "due": "2019-04-10T07:30:00.000Z",
        "hour": 2
      }
    ],
    "value": 2
  },
  {
    "aggregates": {},
    "field": "hour",
    "items": [
      {
        "item": "Pack for Denver",
        "due": "2019-04-11T00:00:00.000Z",
        "hour": 19
      }
    ],
    "value": 19
  }
]
So, now we can see what exactly this group by method has done to our data. We see that it has actually done what we had hoped for and chunked up our items by hour. You can see that we have two 1's that it has put together. And then, below that, we have three different individual times. But, that's exactly what we wanted and exactly what we need for our chart.
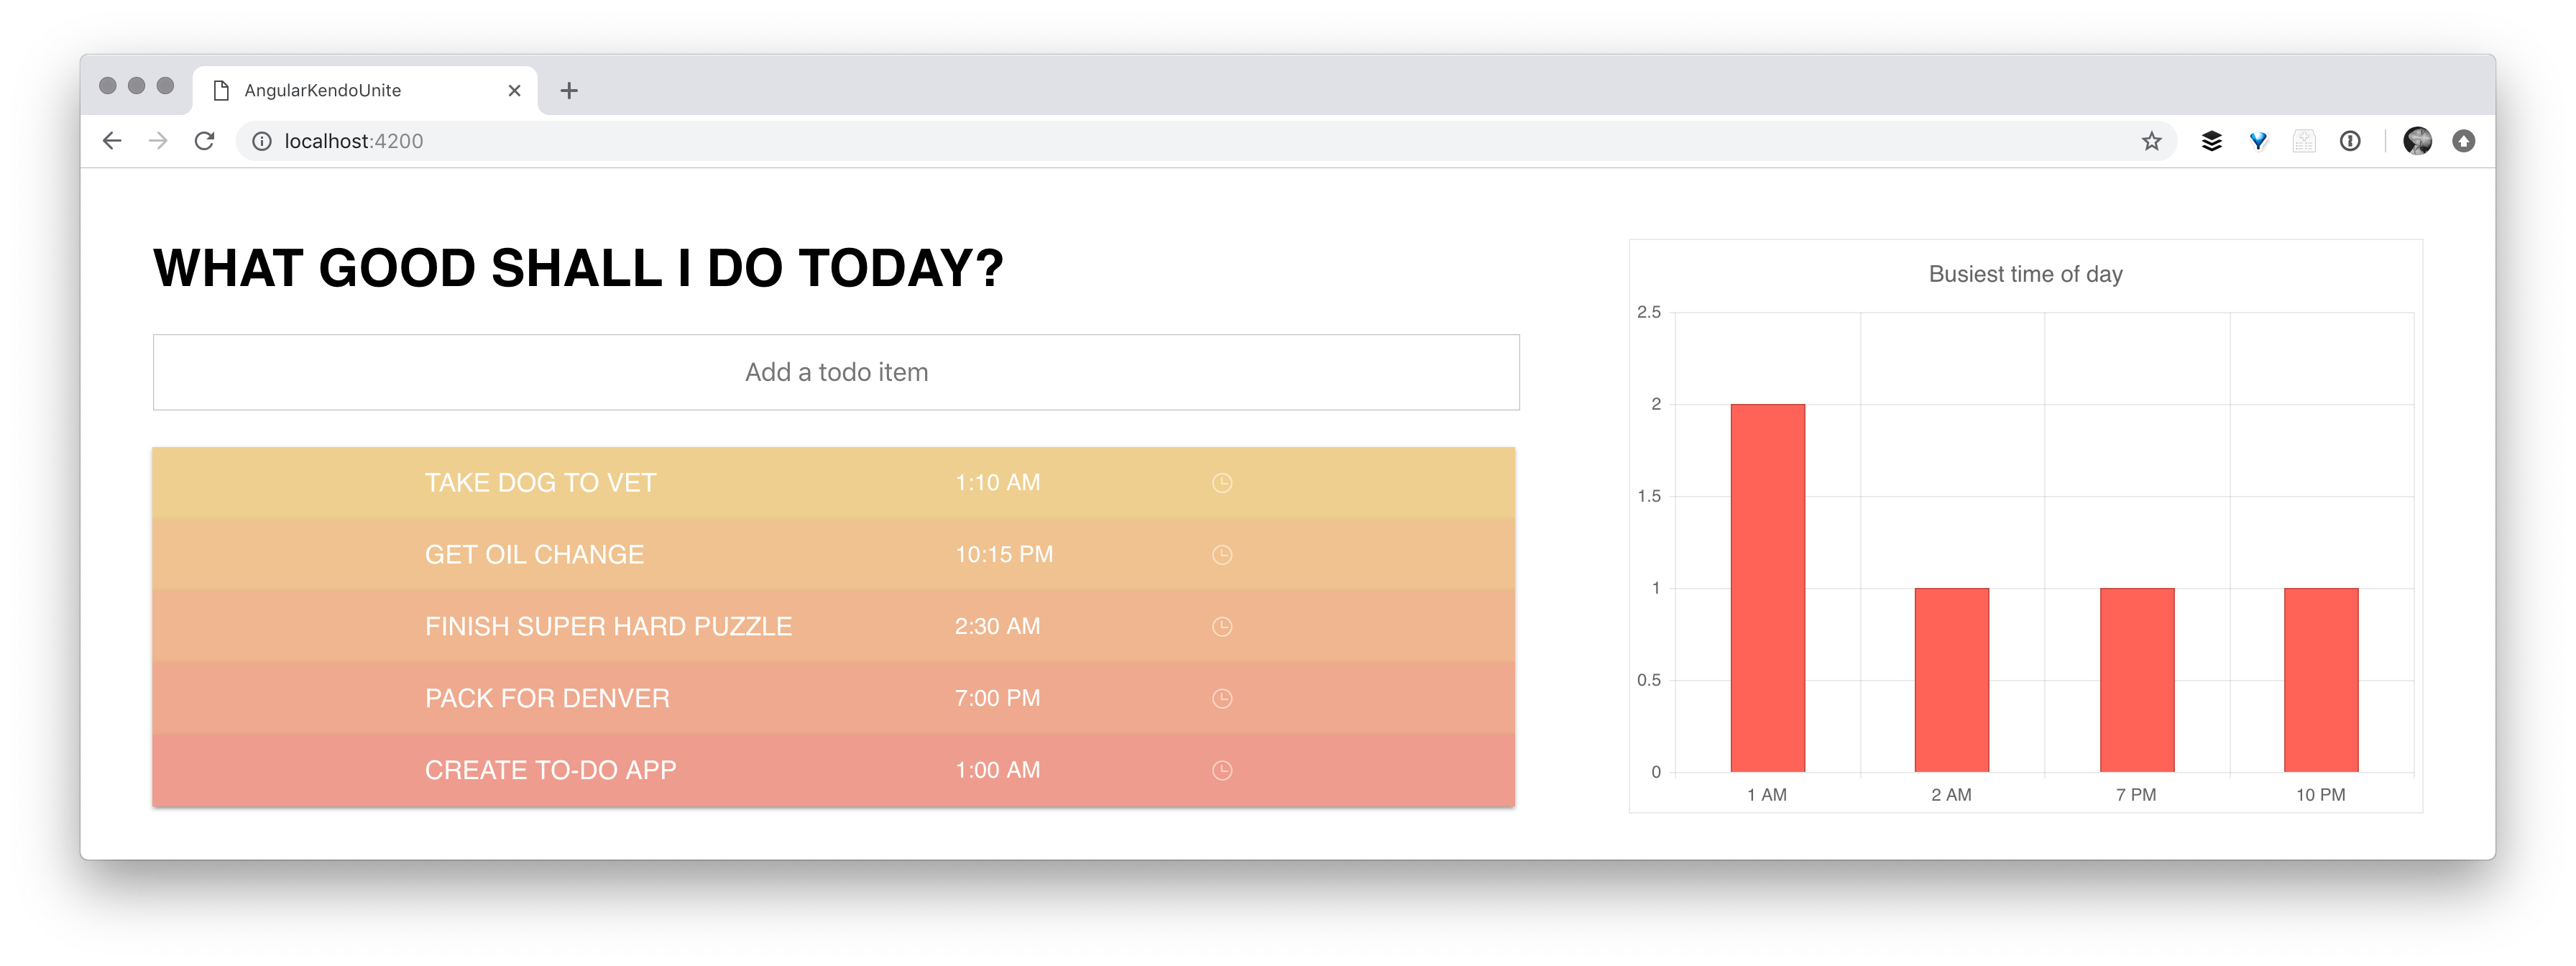
Now, I'm sure we're all anxious to get something—ANYTHING on the screen because we've been talking about charts. We've been manipulating our data, but you're like, "Alyssa, just let me see the chart!" So, I give unto thee, the chart! Here in our todo.component.html, we need to add the markup for our chart:
// todo.component.html

<kendo-chart>
  <kendo-chart-title text="Busiest time of day"></kendo-chart-title>
</kendo-chart>
Inside of our Kendo UI chart, we're going to have a Kendo chart title—the busiest time of day—because that's what we're charting here. And then, we have two inner items here to talk about.
// todo.component.html

<kendo-chart>
  <kendo-chart-title text="Busiest time of day"></kendo-chart-title>
  <kendo-chart-series>
    <kendo-chart-series-item
      [data]="hourlyTodos"
      [name]="field"
      field="items.length"
      categoryField="humanizedValue"
      type="column">
    </kendo-chart-series-item>
  </kendo-chart-series>
</kendo-chart>
The first one is Kendo Chart Series. You can think of this as like your outer chart wrapper. And then, next, you have the actual individual items in the chart. So, the data is the hourly to-do's. The name is field. We’ve also set field to items.length. This is because we want the hours that have more to-do times attached to them to be longer. We’d like the category field to be set to value, which is the hour (what we grouped each of these by).
And then lastly, type of column, which is this could be type of bubble, type of bar, which like column, but coming from the sides. Lots of, I mean, lots of different charts that we could do, but right now, we're sticking with our column. If we go ahead and save that and let it refresh—yay! Here we have our chart and you can see that 1:00 a.m. is in fact busier than another part of my day.
Wonderful, working perfectly. However, I don't know about you, but I think we could clean it up just a little bit. When you add, remove or change to-do items (like edit their time), the chart doesn't change. Now, if we ponder this, it actually should make a lot of sense why the chart doesn't change.
this.hourlyTodos is being created and set equal to the todos array, organized by hour.
organizeTodosByHour(todos) {
  if (!todos) return null;
  this.hourlyTodos = groupBy(this.todos, [{ field: "hour" }]);
}
What we need to do is call organizeTodosByHour() on add and remove, as well, if we want to go ahead and see our data in the chart updating.
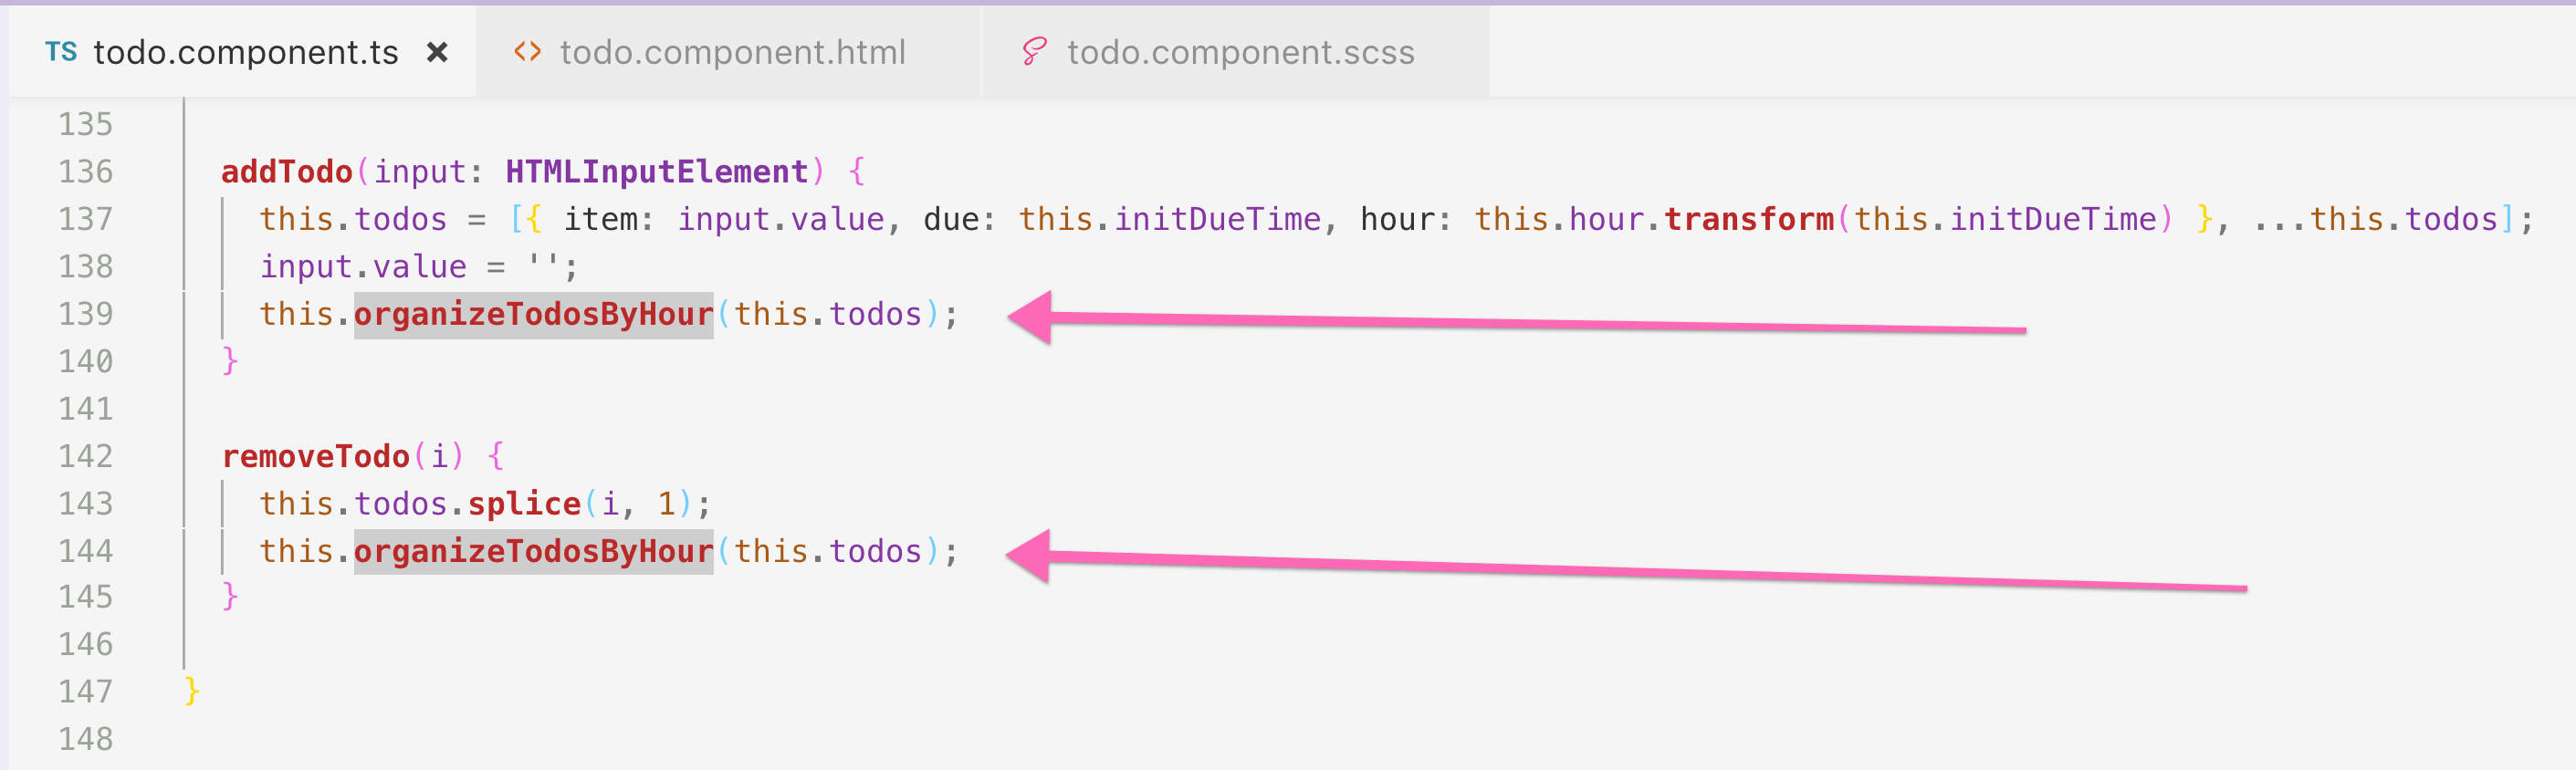
So if we go back and remove something, you can see that it is removed from the chart. If we add something new, you can see that as well is. However, our time picker is not changing.
The way that we grab the event off of the time picker is actually going to be super easy. Inside of Kendo time picker, we're going to bind value change and we're going to set that equal to a method of our choosing. I named ours onTimeChange()
// todo.component.html

<kendo-timepicker [(value)]="todo.due" (valueChange)="onTimeChange()"></kendo-timepicker>
// todo.component.ts
public onTimeChange() {
this.todos.map((todo) => {
todo.hour = this.hour.transform(todo.due);
return todo;
});
this.organizeTodosByHour(this.todos);
}In the onTimeChange() method, we're mapping through our to-do's. For each to-do, we're creating an hour property and we're setting that equal to todo.due, which is the same due date but we're running it through our custom hour pipe. We haven't yet created a backend so that we can update, remove and add. So, every time the time changes, we needed to manually recreate this hour property here on our to-do's after using the hour pipe to transform the hour. We're also calling our organized to-do's by hour, which we were doing on add and remove. This is so that our hourly to-do's are updated, which is what is required for our chart to change.
Now when we update the time of our to-do’s, our chart will update as well! There are two more touchups I’d like to do to our chart, so hang in there with me—you're almost a chart master yourself.
First of all, I'm not very good at military time. When I look at our chart and see 15 for the time of day, my brain kind of blurs and I have to pause to do the math. I think it would be for the best if we showed our chart it in a 12-hour clock instead of the 24-hour clock. So inside of our organizeTodosByHour() method, I’m going to add a bit of logic that will change our times to a 12-hour clock. I'm actually using modulo here to say, if the value, modulo 12 is not zero, then you're going to go ahead and set the value equal to that value. Modulo, if you don't remember, is taking the remainder from division.
organizeTodosByHour(todos) {
if (!todos) return null;
this.hourlyTodos = groupBy(this.todos, [{ field: "hour" }]);
// Humanizing the category field!!
for (let group of this.hourlyTodos) {
// turn the todos into 12 hr clock, not 24
let hour: number = 12;
if (group.value % 12 != 0) {
hour = group.value % 12
}
// add AM or PM to the todos for the chart view
if (group.value < 12) {
group.humanizedValue = `${hour} AM`
} else {
group.humanizedValue = `${hour} PM`
}
}
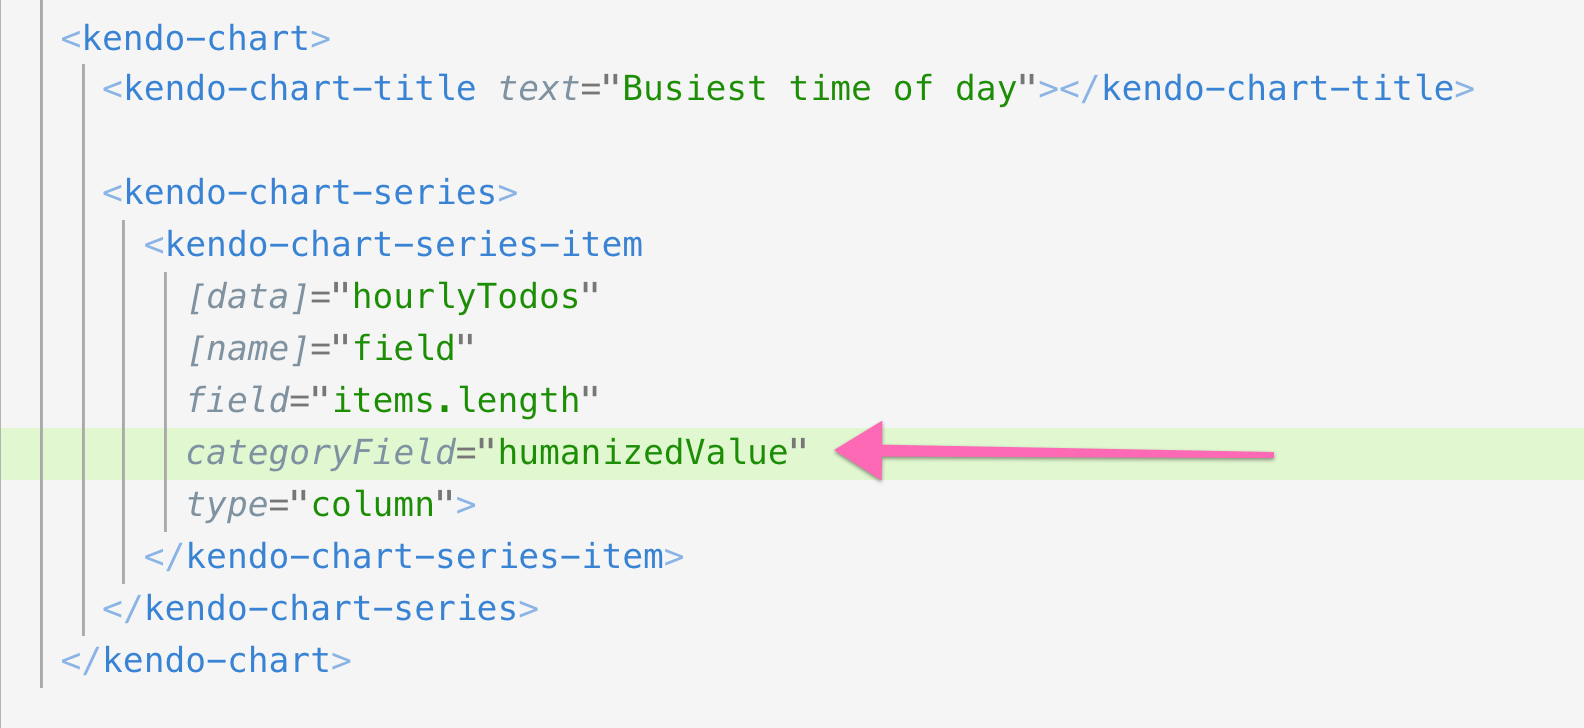
}We also added AM or PM to our to-dos . Super simple, right? If it's greater than 12 or less than 12, set AM or PM. In order to use our new humanizedValue, we used it inside our Kendo UI Chart fo categoryField instead of value:
Secondly, I think if we sorted our times in order of earliest in the day to later in the day, it might make more sense as we read the chart.
  organizeTodosByHour(todos) {
    if (!todos) return null;
    this.hourlyTodos = groupBy(this.todos, [{ field: "hour" }]);

     // turn the todos into 12 hr clock, not 24
     for (let group of this.hourlyTodos) {
       let hour: number = 12;
       if (group.value % 12 != 0) {
         hour = group.value % 12
       }

       // add AM or PM to the todos for the chart view
       if (group.value < 12) {
         group.humanizedValue = `${hour} AM`
       } else {
         group.humanizedValue = `${hour} PM`
       }
    }

     // sort the hourlyTodos in order by hour
     this.hourlyTodos.sort((a, b) => {
       if (a.value < b.value) {
         return -1;
       } else if (a.value > b.value) {
         return 1;
       } else {
         return 0;
       }
     });
  }
So here, you can see we’re using the .sort() method to reorganize our times. If we now check out our chart, we can see the times are all 12-hour clock times, with a.m. or p.m., and organized in order!
I have just had a blast making this series. I hope you have too, learning a bit about Angular and Kendo UI. Check out the video series or check out GitHub for all of the codes that we've been working on. I wish you all the happiest of coding in the future. Thanks for following along!

Alyssa Nicoll
Alyssa is an Angular Developer Advocate & GDE. Her two degrees (Web Design & Development and Psychology) feed her speaking career. She has spoken at over 30 conferences internationally, specializing in motivational soft talks, enjoys gaming on Xbox and scuba diving in her spare time. Her DM is always open, come talk sometime.