New to Telerik Reporting? Start a free 30-day trial
Creating Error Bar Style Graphs
Environment
| Product | Reporting |
Description
I am trying to create an error bar style graph in Telerik Report Designer using markers with a vertical bar in the middle and horizontal bars at the top and bottom:
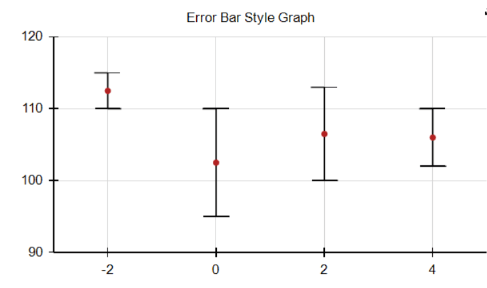
When using an OHLC chart with MarkerStyle = CandleStick, I cannot remove the left and right vertical lines, and with MarkerStyle = Bar, the horizontal bars extend only one way each.
This knowledge base article also answers the following questions:
- How to customize OHLC charts for specific marker styles in Telerik Report Designer?
- How to customize LineSeries in Telerik Report Designer?
Solution
To create an error bar style graph, customize the OHLC chart:
- Add additional
LineSeriesto the existing OHLC Bars. - Use three separate
LineSeriesfor the High, Low, and Middle/Average values. - Set the
DataPointMarkerproperty toMinusfor High/Low andCirclefor Middle. - Ensure only the data markers are displayed by setting
DataPointStyle.VisibletoTrueandLineStyle.VisibletoFalse. Example: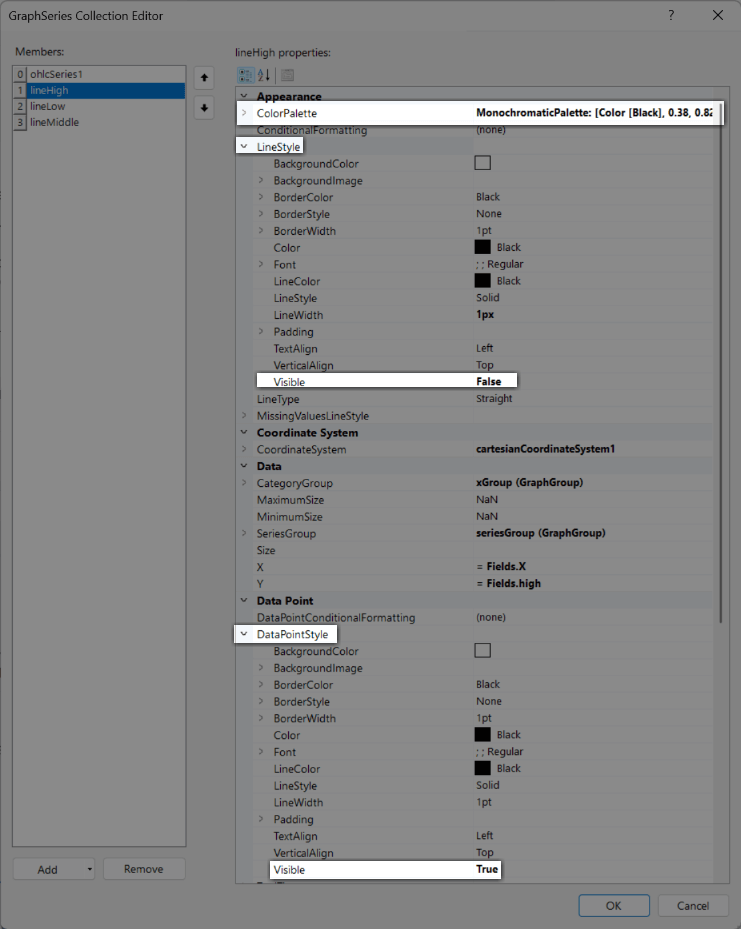
- Optionally, set the
ColorPalettefor all Series toMonochromatic > Blackor any other desired palette to ensure all data points are the same color.
Download Sample
Test the ErrorBarStyleGraphReport.trdx sample report from our samples repository.