Configure Web Report Designer and Create a Basic Report
This is a step-by-step tutorial that shows how to integrate the Web Report Designer in .NET 8 ASP.NET Core application in Visual Studio 2022.
-
First, you will create a Web Application and add the Telerik Web Report Designer through its Visual Studio Item Template.
-
Next, you'll create and style a new report.
-
Then, you will add a remote DataSource and connect it to a new Graph in the report.
-
At the end, you will have a web application with embedded Telerik Web Report Designer with the default
SampleReport.trdpand the newly createdProductSales.trdpreports in its storage that you may preview and edit.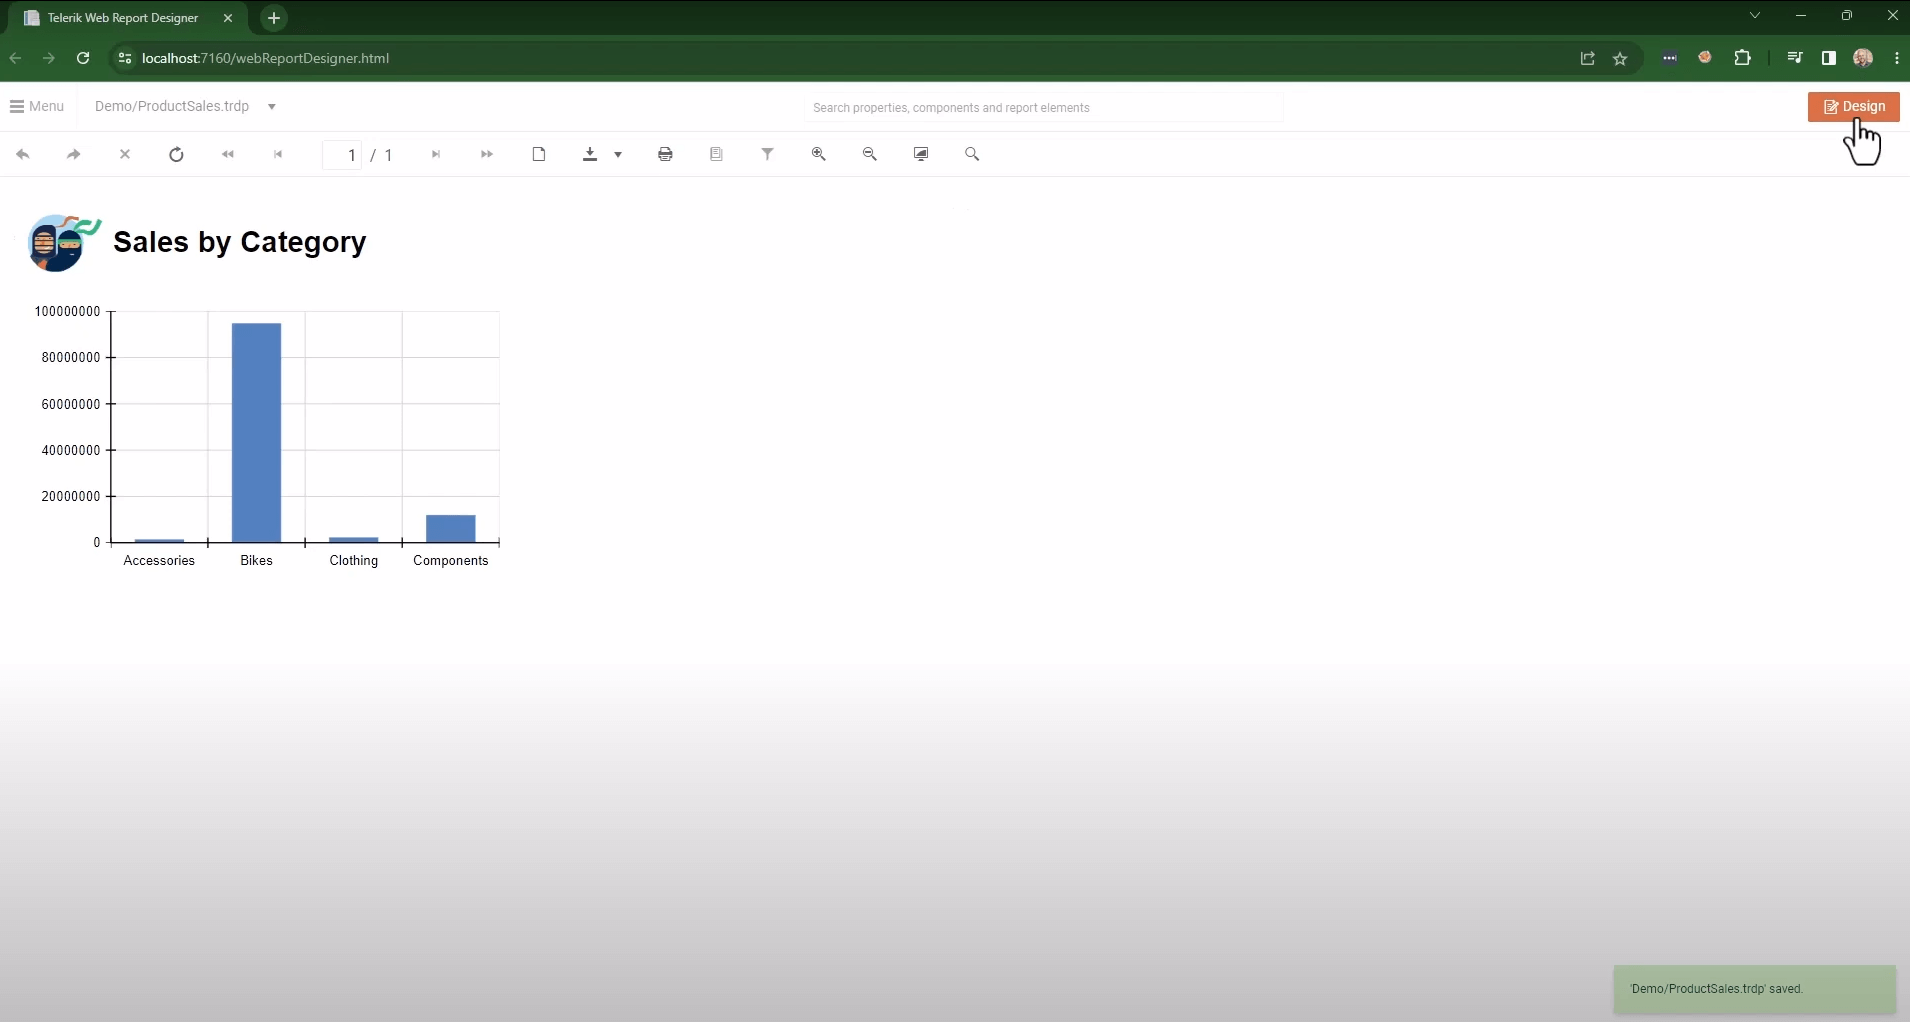
The entire process is described in the YouTube video tutorial Getting Started with the Web Report Designer: Part 1.
Setting up the Web Report Designer in .NET 8
Let's create an ASP.NET Core application in Visual Studio and embed the Telerik Web Report Designer in it:
-
Open Visual Studio 2022 and create a new project through the project template
ASP.NET Core Web App. Name the project, for example,Telerik.WRD.GettingStartedand select.NET 8.0as a Target Framework. -
Add the Web Designer to the project:
-
Right-click on the project and select
Add>New Item....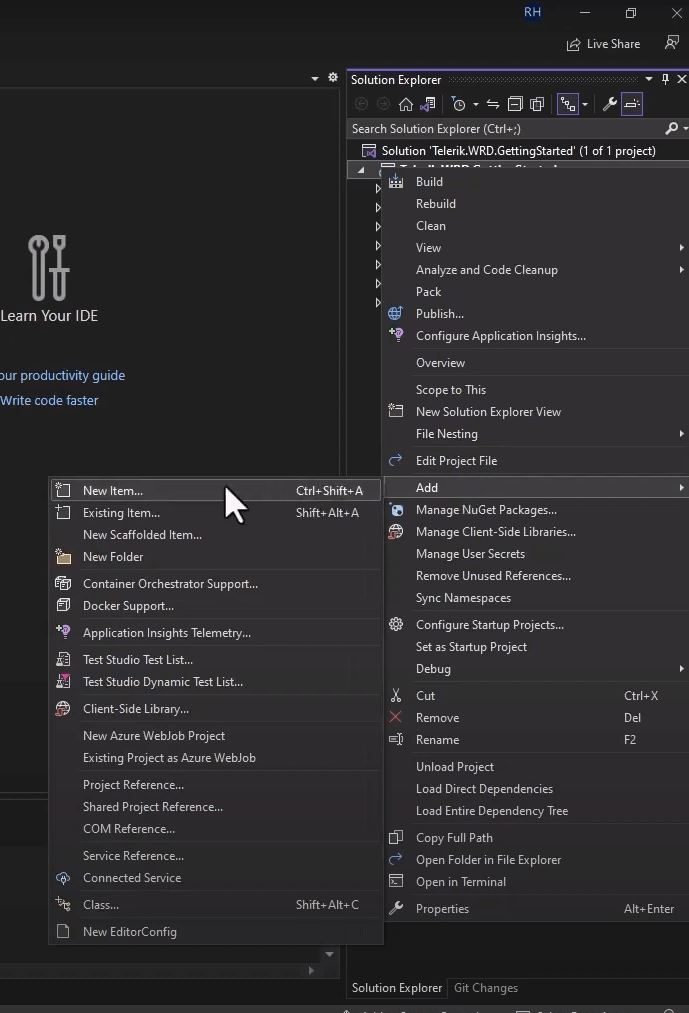
-
You may search for
Telerik Reportingto list the available Reporting item templates. AddTelerik Web Report Designer HTML5 Page 2026 Q3. The version may vary, depending on the last Reporting version installed. -
Name the new page
webReportDesigner.html(this is the default name).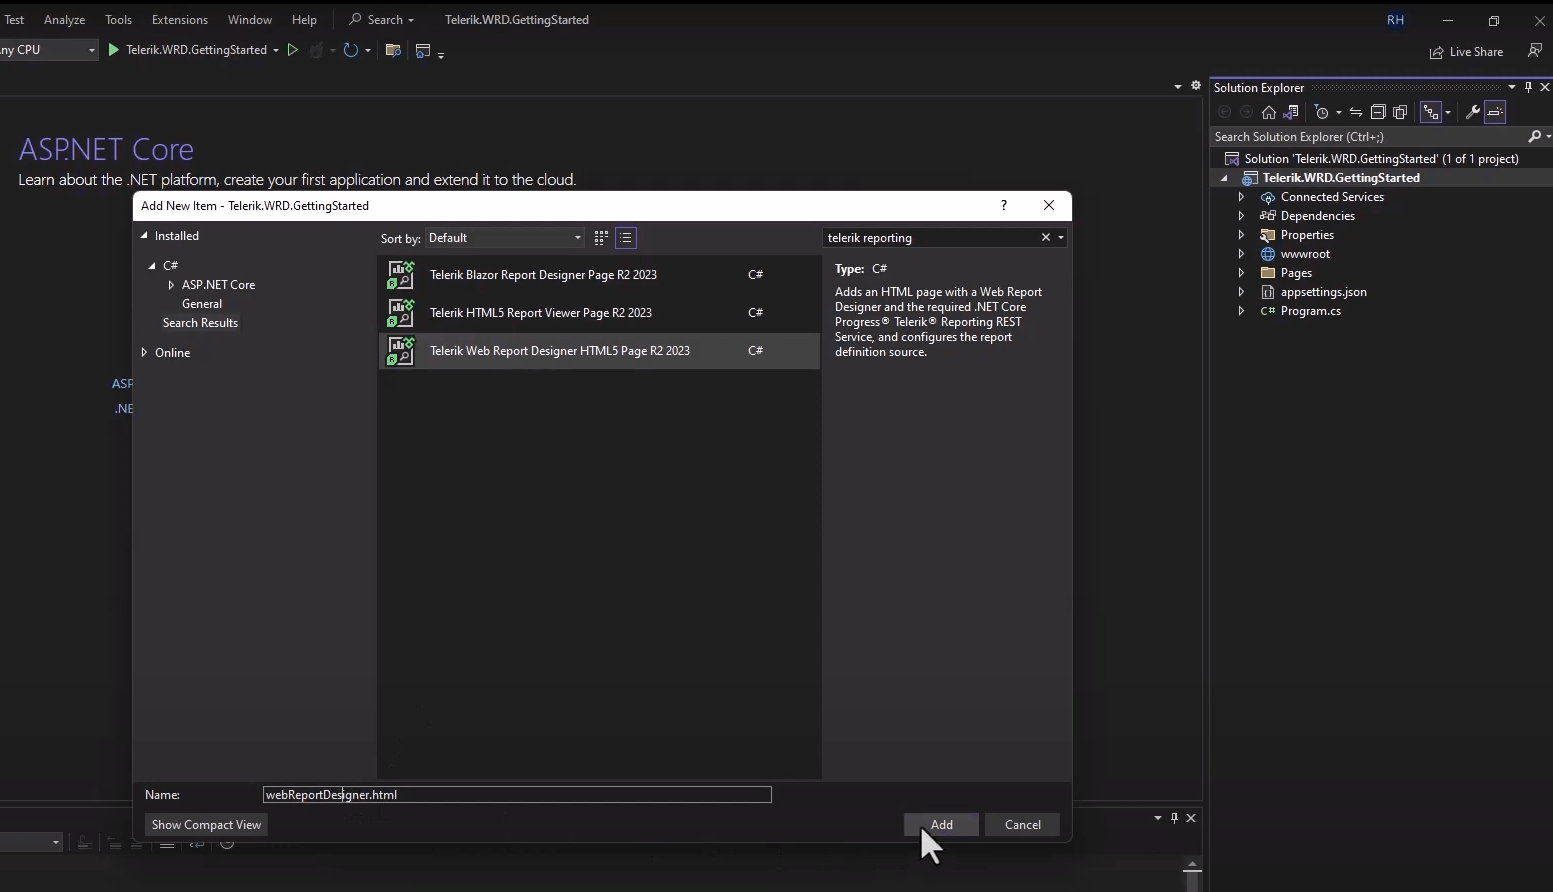
-
Build the project when prompted by Visual Studio.
-
-
Configure the Web Report Designer:
-
In the popped-up Add new .NET Core Web Report Designer wizard, select
Create new REST serviceas we don't have an existing one.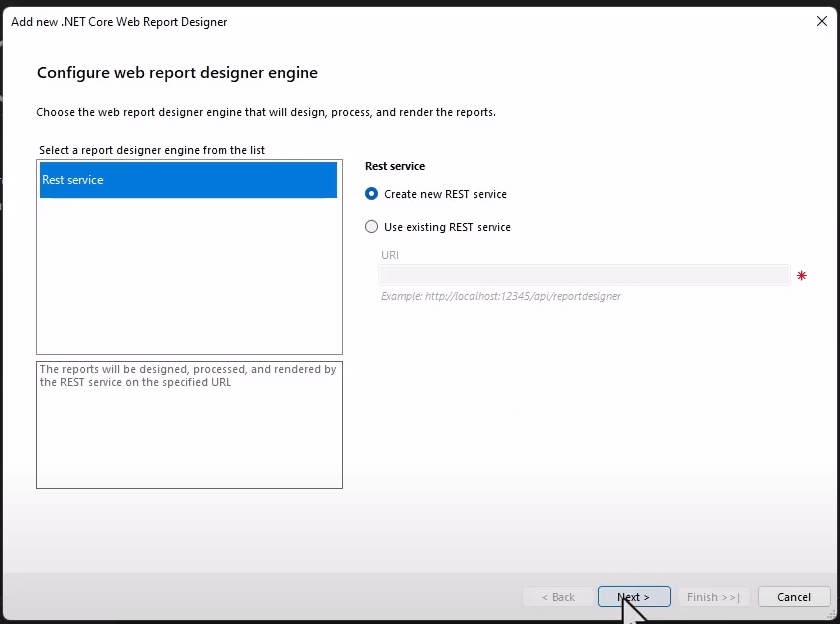
-
On the next step, the wizard will ask for the initial report to load. Select the
Sample report definitionoption to create a new sample report if you don't have any.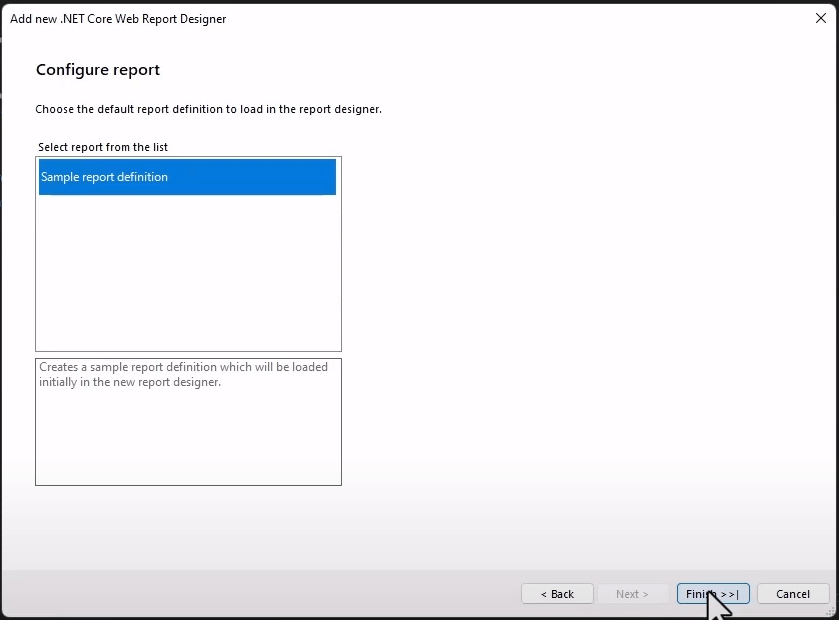
-
When you click
Finish, you should see a status page confirming that everything was set up correctly.
-
-
(optional) Open the file
launchSetting.jsonin the folderPropertiesand add the next line, setting the opening page to the "profiles" > "Telerik.WRD.GettingStarted" object. Note that the name of the project and the web page may vary:"launchUrl": "webReportDesigner.html".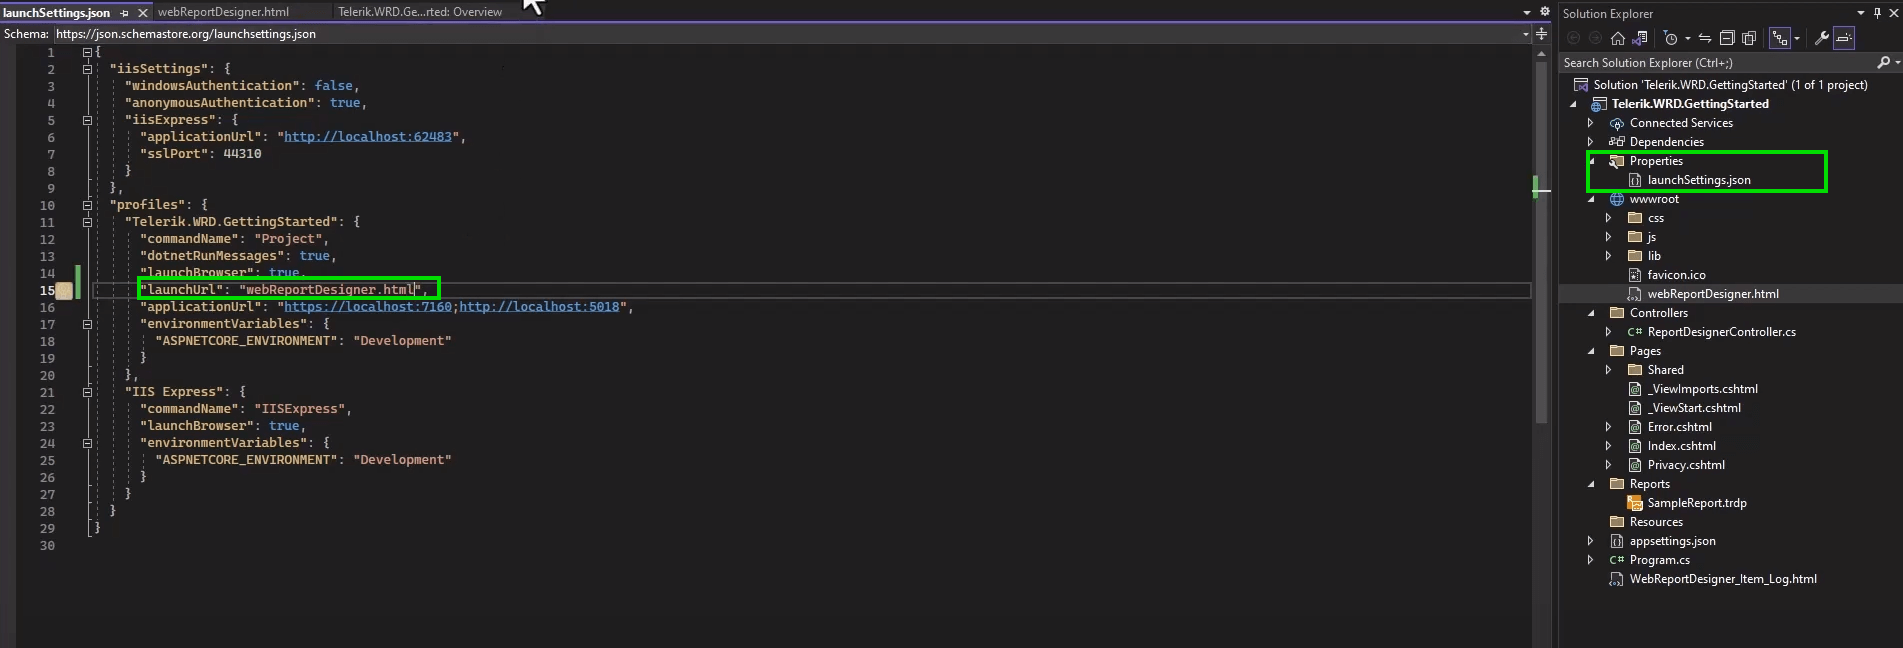
-
Run the project. If everything is fine, you should see the web page with the designer with the sample report opened, and the onboarding guide to walk you through the main tools in the designer.
We recommend getting familiar with the Web Report Designer by clicking on the
Nextbutton in the guide. You may skip the guide at any step by pressing the buttonEnd Tour. Pay attention to the Search functionality of the designer that lets you locate any report item, section, or property easily.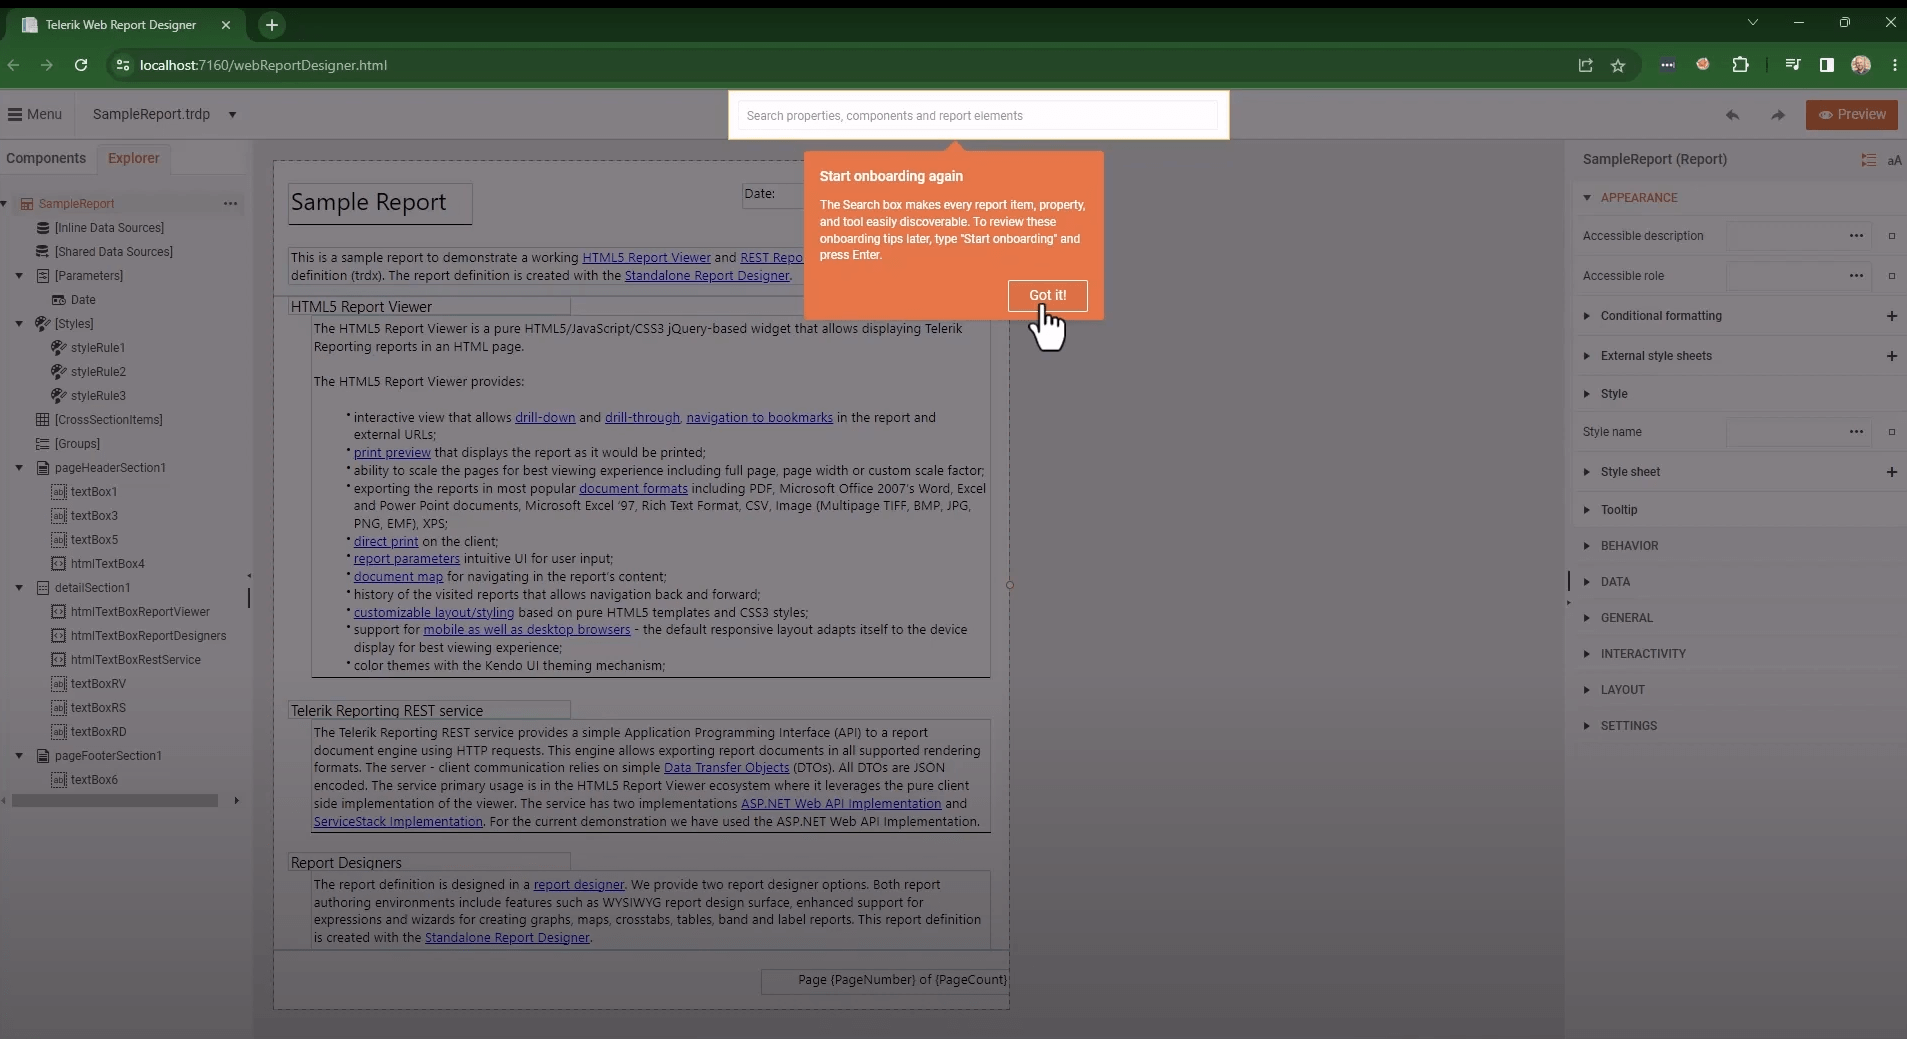
Creating a New Report
Our next goal is to create a brand new report with the just configured Web Report Designer:
-
Go to the main toolbar
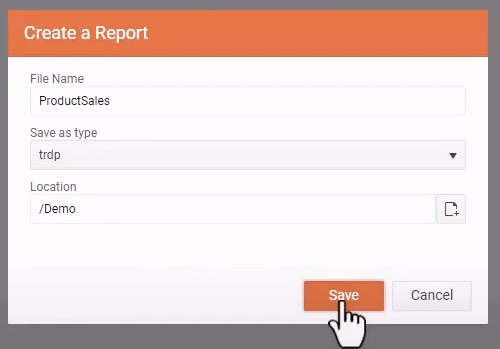
Menuand selectNew Report. TheCreate Reportdialog opens and lets you:- Enter the
File Name. Let's name the reportProductSales. - Select the
Type. Leave theTypeto beTRDP, standing for Telerik Report Definition Packed, the recommended Declarative Report Definition. - Enter
Location. TypeDemoto place the report in the Demo subfolder. - Click
Saveto apply the settings.
- Enter the
-
The new empty report should open in the designer with its default Page Header, Detail, and Page Footer sections. Let's delete the page sections by selecting them and pressing the
Deletekey on the keyboard. -
Next, we want to add a Report Header. Press
Ctrl+Fto focus the Search box, typeReport Header, and pressEnterkey to focus the report section in theComponentsmenu. Click the item to add the section to the report.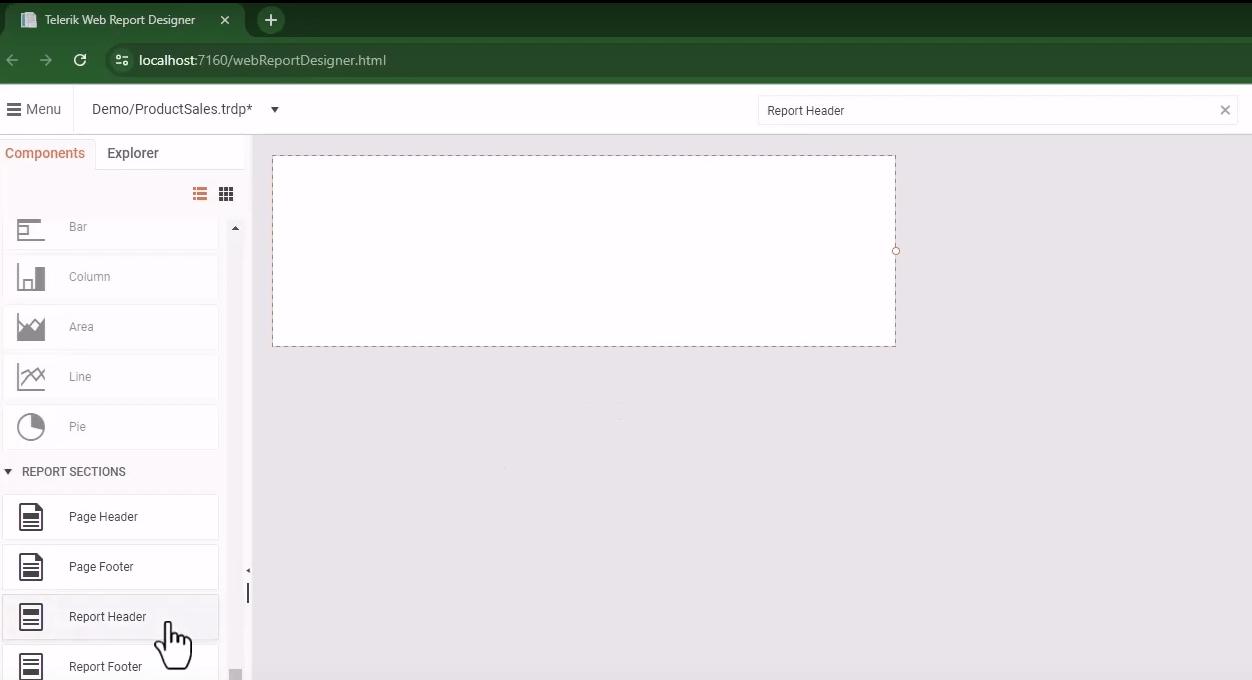
-
Let's add the company logo to the report.
-
We need to add a PictureBox to the Report Header. You may search for the report item, drag it to the Report Header, and adjust its size and position as needed.
-
To upload the logo, search for the
Valueproperty in the PictureBox, and click on the icon beside it. It opens theSelect File...dialog, which represents the Assets Manager. The latter contains report assets such as images, external stylesheets, etc.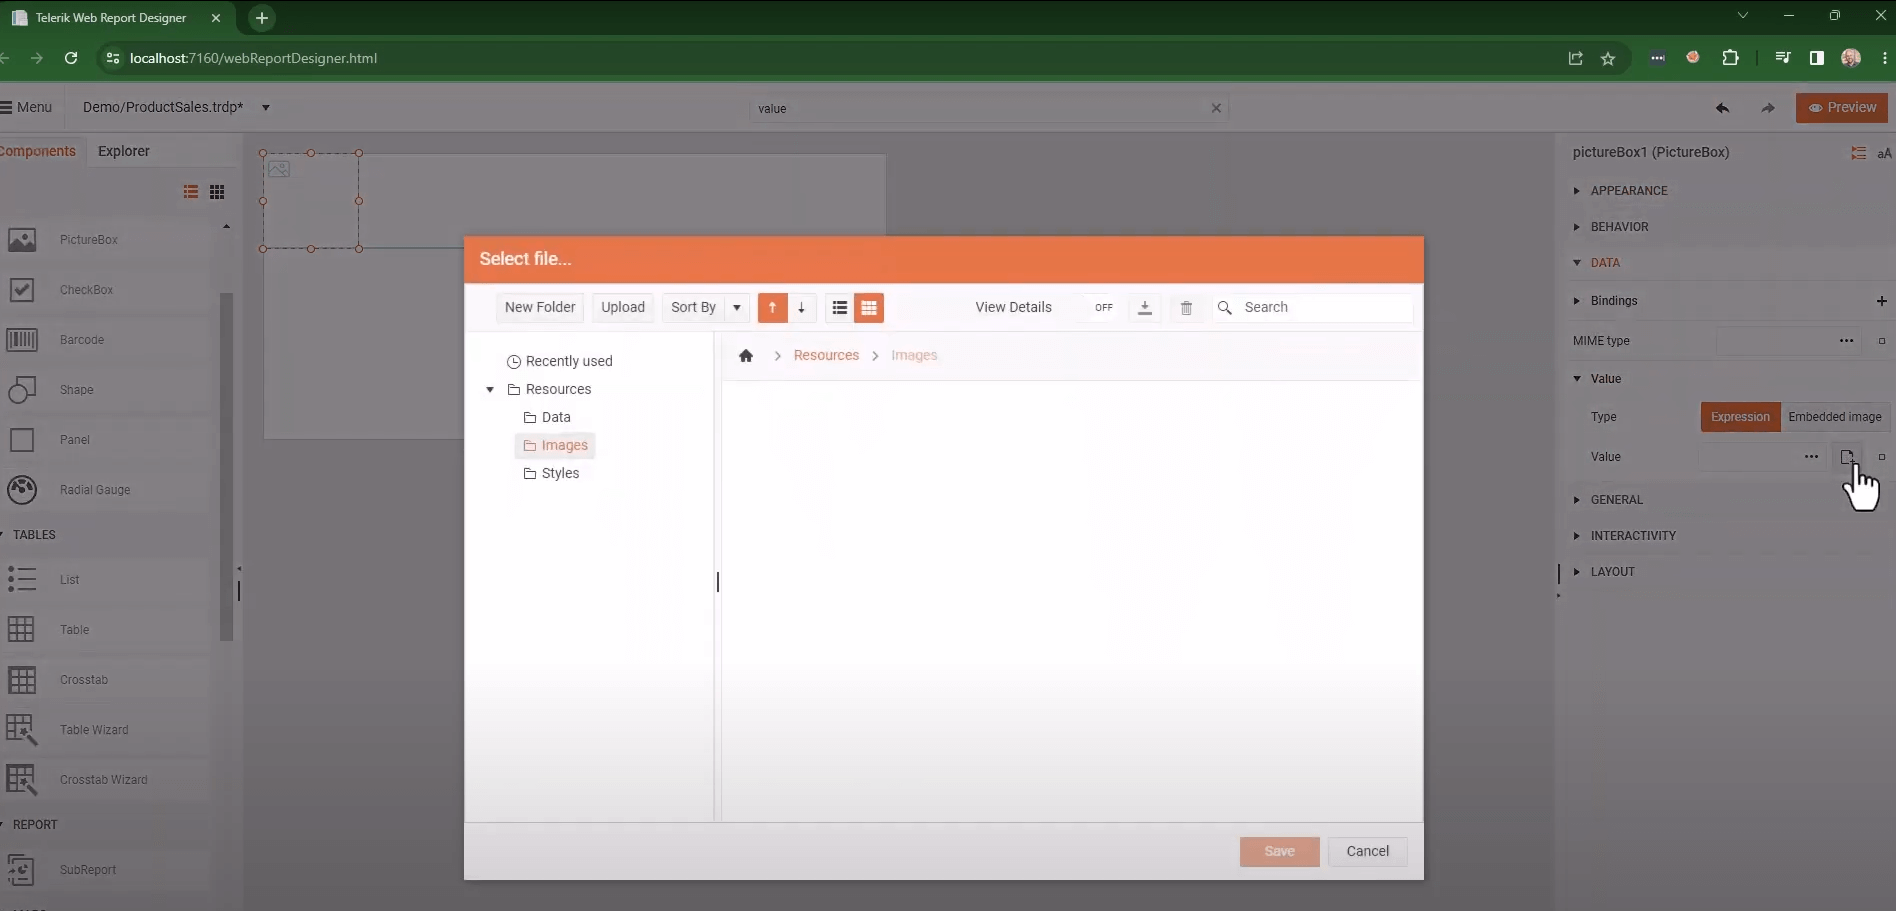
-
Select the
Imagesfolder and click theUploadbutton to upload the image. Click on theBrowsebutton to find the image on your system and open it. Add the selected image by clicking on theUploadbutton. Now the image is in the Assets Manager, and you may clickSave. The value should be populated, and the image should be displayed in the PictureBox.
-
-
Add a title to the report. You may use the TextBox report item.
-
Search in the global search box of the designer and drag the item from the
Componentsmenu to the Report Header. -
You may change the text inline. Double-click on the item to enter it and type
Sales by Category. -
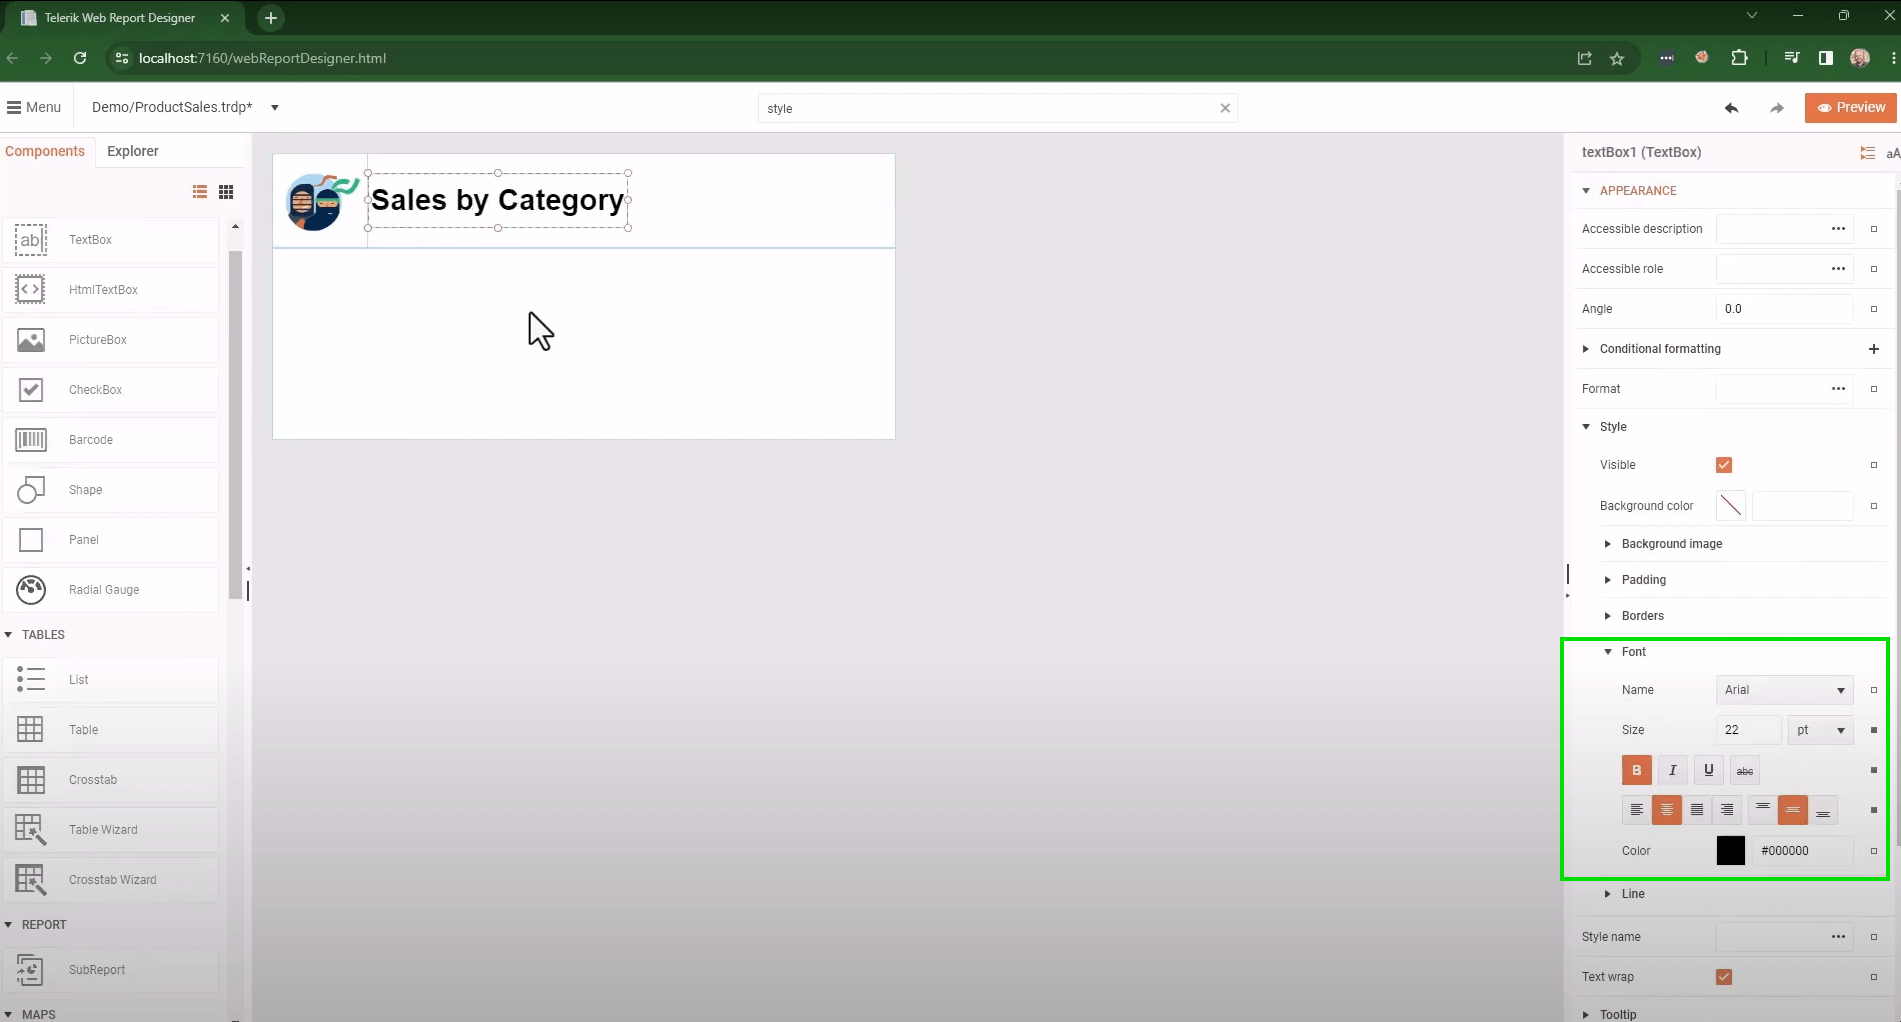
Apply Styles by selecting the TextBox, searching for Style, and finding the appropriate Font styles. Let's use the default Font "Arial", with Size 22pt, bolded, centered, and aligned to the middle.
-
Position and realign the TextBox so that the content fits and looks beautiful.
-
-
Our next step would be to add a DataSource component to the Report. Let it be the WebServiceDataSource fetching data from a remote source.
-
Search for the component and add it to the report. It opens the Configure Web Service DataSource wizard.
-
For
ServiceUrl, we will add the known URL to our demo sitehttps://demos.telerik.com/reporting/api/data/ProductSales.min. It points to a reliable JSON data file. Leave the other options with their default values.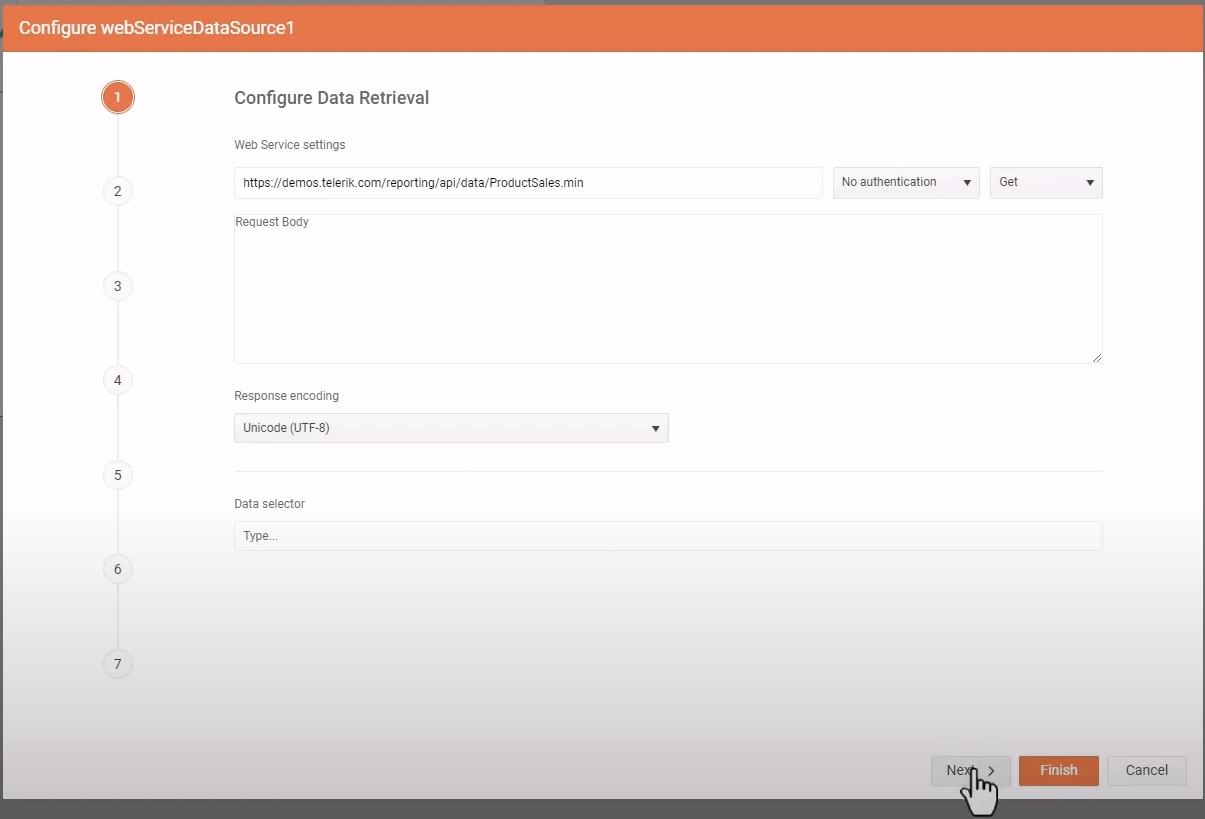
-
Skip the next page, where you may add request parameters, as we don't have any.
-
Skip also the third page that asks whether, in design-time, you would like to use real or mocked data. We will use real data (the default setting).
-
Preview the data on the next page and click
Finish.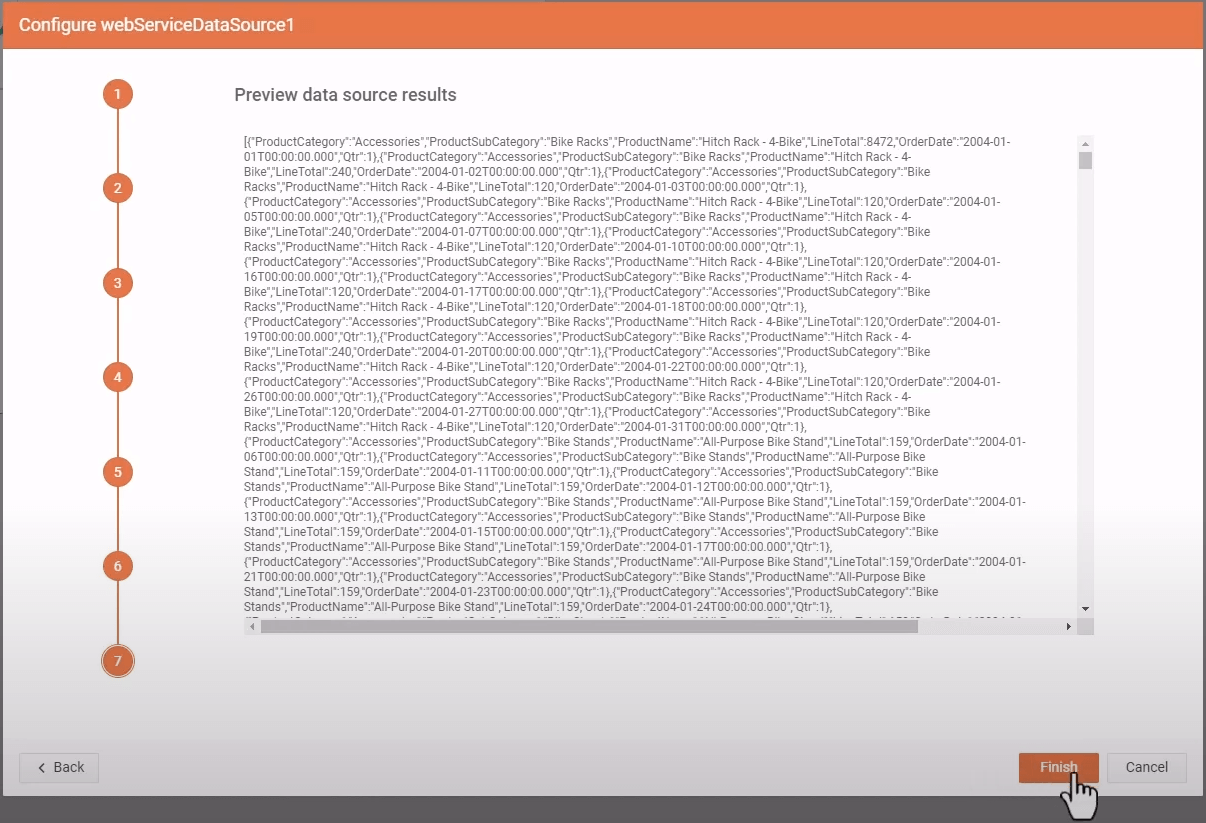
-
The wizard closes, and in the designer's
Explorertab, you should see the new WebServiceDataSource component with its data fields listed.
-
-
Next, lets add the Graph item that is going to show the sales data.
-
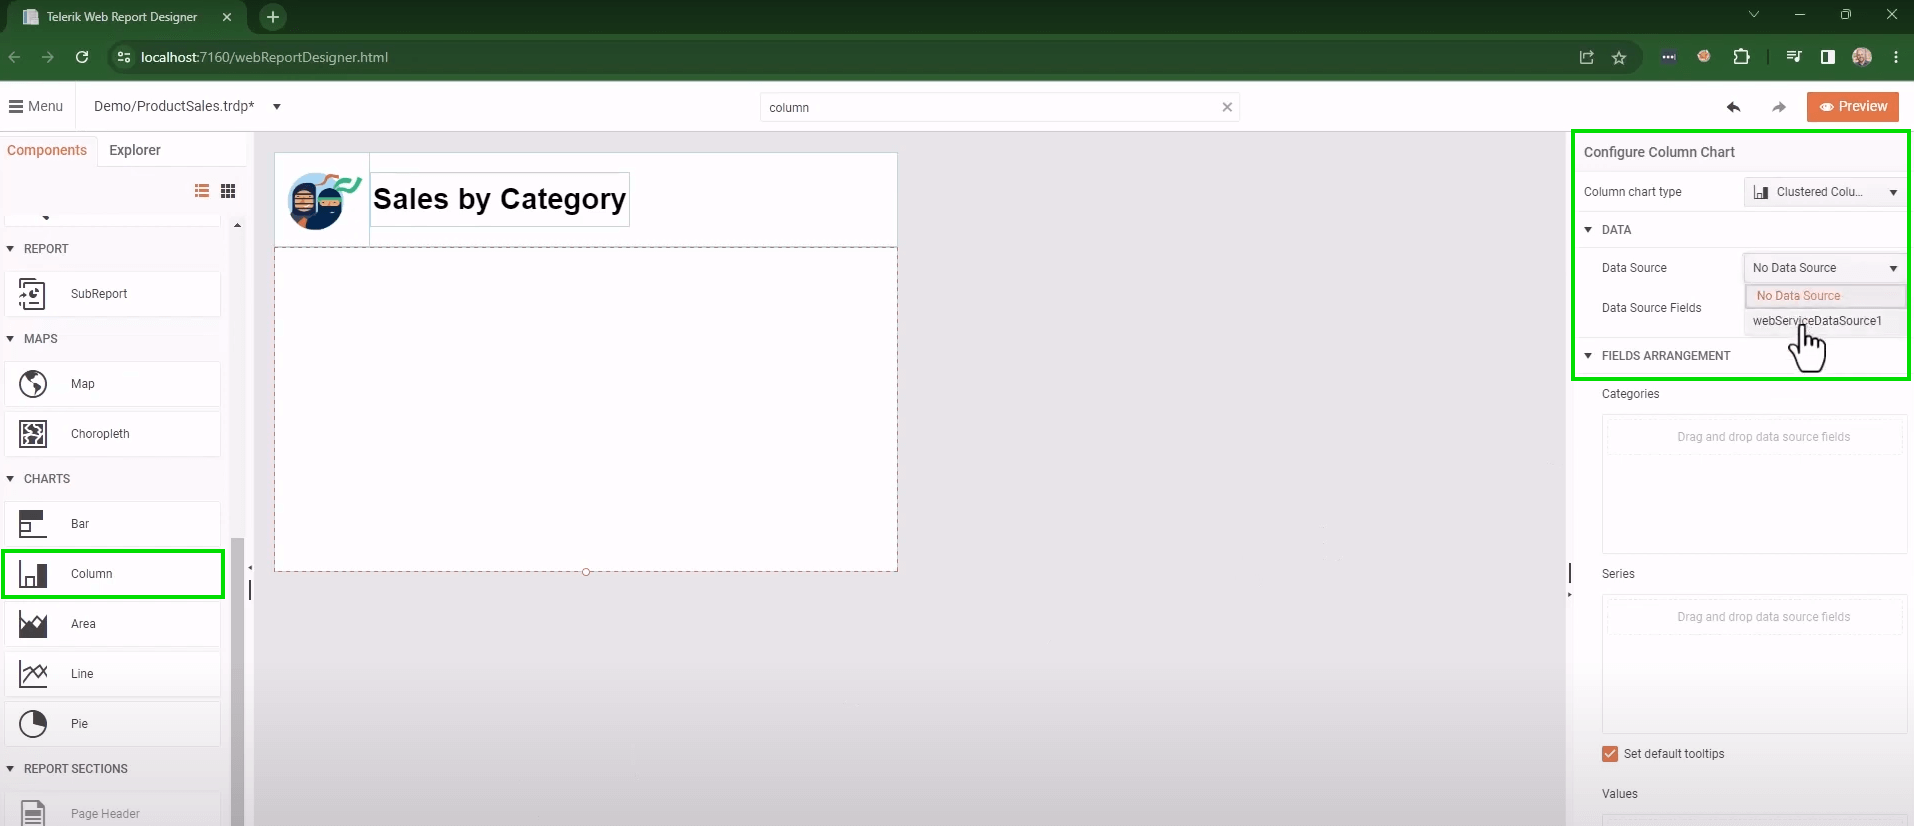
Search for
Columnand drag the Column chart from theExplorermenu to the report Detail section. This will open a chart configurator in the right pane. -
Select the WebServiceDataSource from the dropdown of the Graph DataSource property. The fields will be listed.
-
Drag the
ProductCategoryfield to theCategories. -
For the
Valuesproperty, use theLineTotalfield. -
Click on
Createto render the chart with real data and show it in the report. -
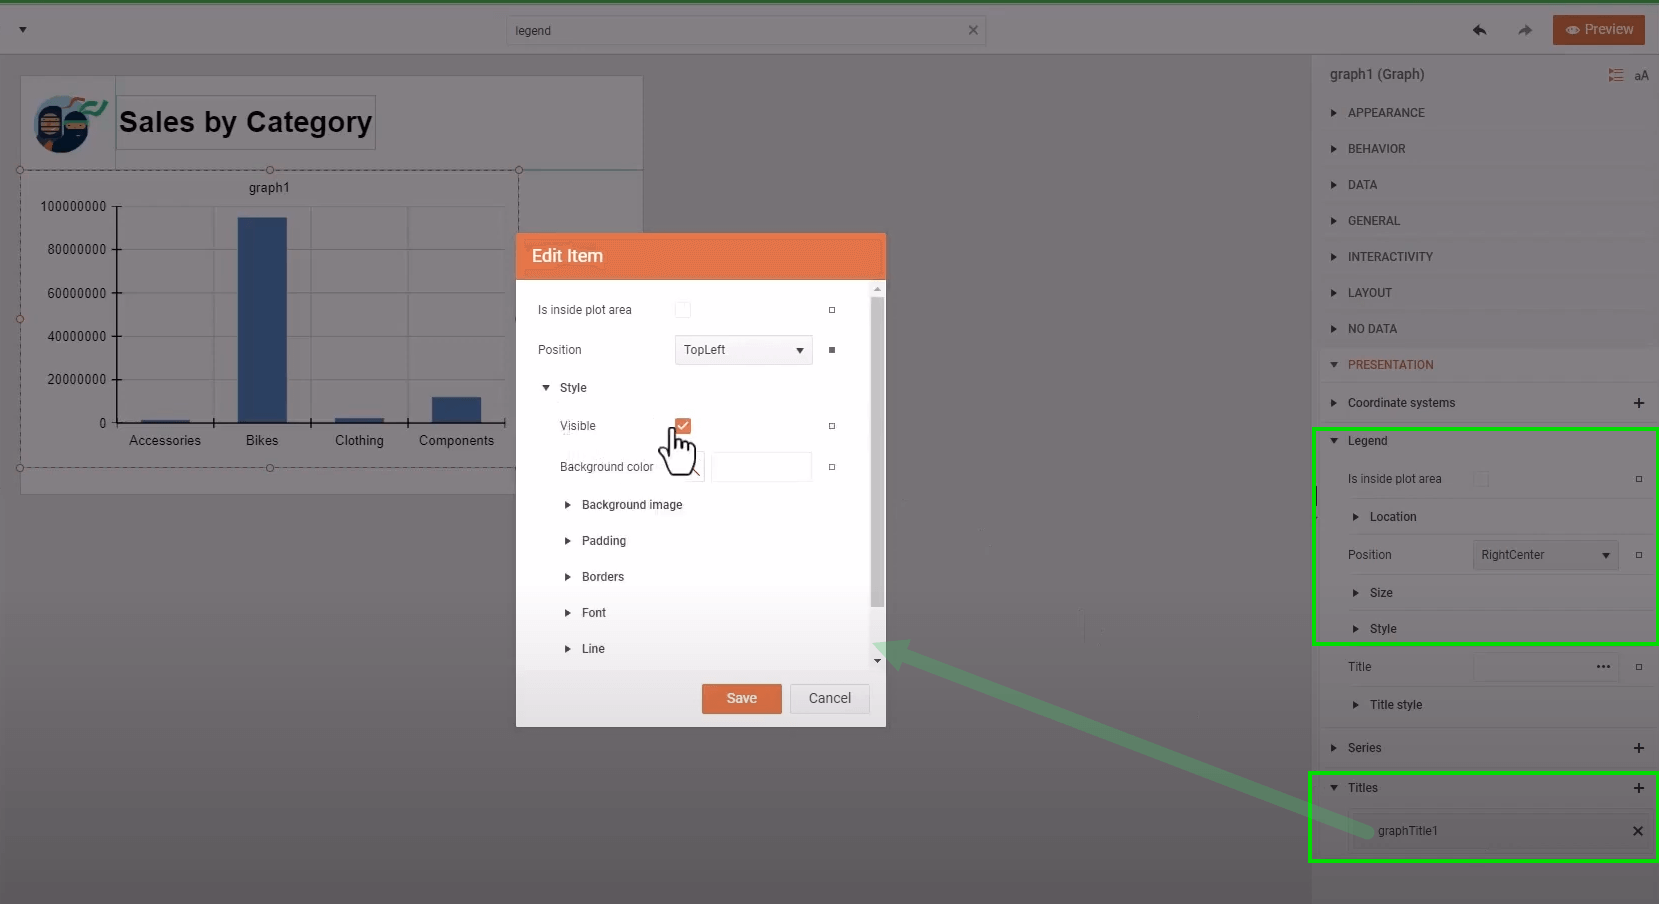
Finally, style the column graph:
- Find and remove the
Legendby unchecking itsStyle>Visiblecheckbox. - Enter the
Titlessection, select the graph title, and uncheck theVisiblecheckbox in theStylesection from the openedEdit itemdialog.
- Find and remove the
-
-
Preview the pixel-perfect report document by clicking on the designer's
Previewbutton at the top right corner.
See Also
- Video Tutorial 'Getting Started with the Web Report Designer: Part 1'
- Video Tutorial 'Getting Started with the Web Report Designer: Part 2'
- Implement a Common Master-Detail Report Scenario
- Web Report Designer
- Setting Up the Web Report Designer in .NET Applications
- Demo Page for Telerik Reporting
- Telerik Reporting Homepage
- Reporting Forums
- Reporting Blog
- Reporting Videos
- Reporting Roadmap
- Reporting Pricing
- Reporting Training
- Web Report Designer User Guide