Step Line Chart
A Step line chart, as part of the ASP.NET AJAX Chart, is a form of line/area chart where each data point from the series is connected with vertical and horizontal lines to form a step-like progression. This type of line/area visualization is useful in displaying the intermittent changes of a quantity that remains a constant during stages. The AreaSeries and LineSeries support Step line rendering. Telerik introduced the Step line chart in Q1 2014.
You can display horizontal and vertical lines through the data points from the series by setting the LineAppearance.LineStyle property of the series to "Step". For example:
<telerik:AreaSeries Name="Area Series">
	<LineAppearance LineStyle="Step" />
</telerik:AreaSeries>
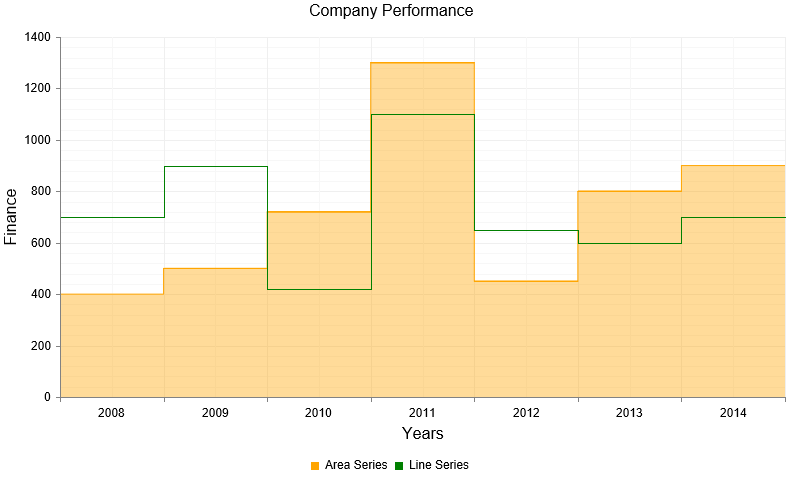
The code in Example 1 will show you how to build a Step line series in Figure 1.
Figure 1: Data points in area and line series are connected through horizontal and vertical lines. The code in Example 1 illustrates how to setup a Step line area and line series.

Example 1: Creating a chart that has two Step line series - AreaSeries and LineSeries. The Step line functionality is enabled by simply setting the LineAppearance.LineStyle property of the series to "Step".
<telerik:RadHtmlChart runat="server" ID="AreaLineSteplineChart" Width="800" Height="500" Transitions="true">
	<PlotArea>
		<Series>
			<telerik:AreaSeries Name="Area Series">
				<LineAppearance LineStyle="Step" />
				<Appearance>
					<FillStyle BackgroundColor="Orange" />
				</Appearance>
				<LabelsAppearance Visible="false" />
				<MarkersAppearance Visible="false" />
				<SeriesItems>
					<telerik:CategorySeriesItem Y="400" />
					<telerik:CategorySeriesItem Y="500" />
					<telerik:CategorySeriesItem Y="720" />
					<telerik:CategorySeriesItem Y="1300" />
					<telerik:CategorySeriesItem Y="450" />
					<telerik:CategorySeriesItem Y="800" />
					<telerik:CategorySeriesItem Y="900" />
				</SeriesItems>
			</telerik:AreaSeries>
			<telerik:LineSeries Name="Line Series">
				<LineAppearance LineStyle="Step" />
				<Appearance>
					<FillStyle BackgroundColor="Green" />
				</Appearance>
				<LabelsAppearance Visible="false" />
				<MarkersAppearance Visible="false" />
				<SeriesItems>
					<telerik:CategorySeriesItem Y="700" />
					<telerik:CategorySeriesItem Y="900" />
					<telerik:CategorySeriesItem Y="420" />
					<telerik:CategorySeriesItem Y="1100" />
					<telerik:CategorySeriesItem Y="650" />
					<telerik:CategorySeriesItem Y="600" />
					<telerik:CategorySeriesItem Y="700" />
				</SeriesItems>
			</telerik:LineSeries>
		</Series>
		<CommonTooltipsAppearance Color="White"></CommonTooltipsAppearance>
		<XAxis>
			<MajorGridLines Color="#EFEFEF" Width="1" />
			<MinorGridLines Color="#F7F7F7" Width="1" />
			<Items>
				<telerik:AxisItem LabelText="2008" />
				<telerik:AxisItem LabelText="2009" />
				<telerik:AxisItem LabelText="2010" />
				<telerik:AxisItem LabelText="2011" />
				<telerik:AxisItem LabelText="2012" />
				<telerik:AxisItem LabelText="2013" />
				<telerik:AxisItem LabelText="2014" />
			</Items>
			<TitleAppearance Position="Center" Text="Years" />
		</XAxis>
		<YAxis>
			<MajorGridLines Color="#EFEFEF" Width="1" />
			<MinorGridLines Color="#F7F7F7" Width="1" />
			<TitleAppearance Position="Center" Text="Finance" />
		</YAxis>
	</PlotArea>
	<ChartTitle Text="Company Performance">
		<Appearance Align="Center" Position="Top" />
	</ChartTitle>
	<Legend>
		<Appearance Position="Bottom" />
	</Legend>
</telerik:RadHtmlChart>