
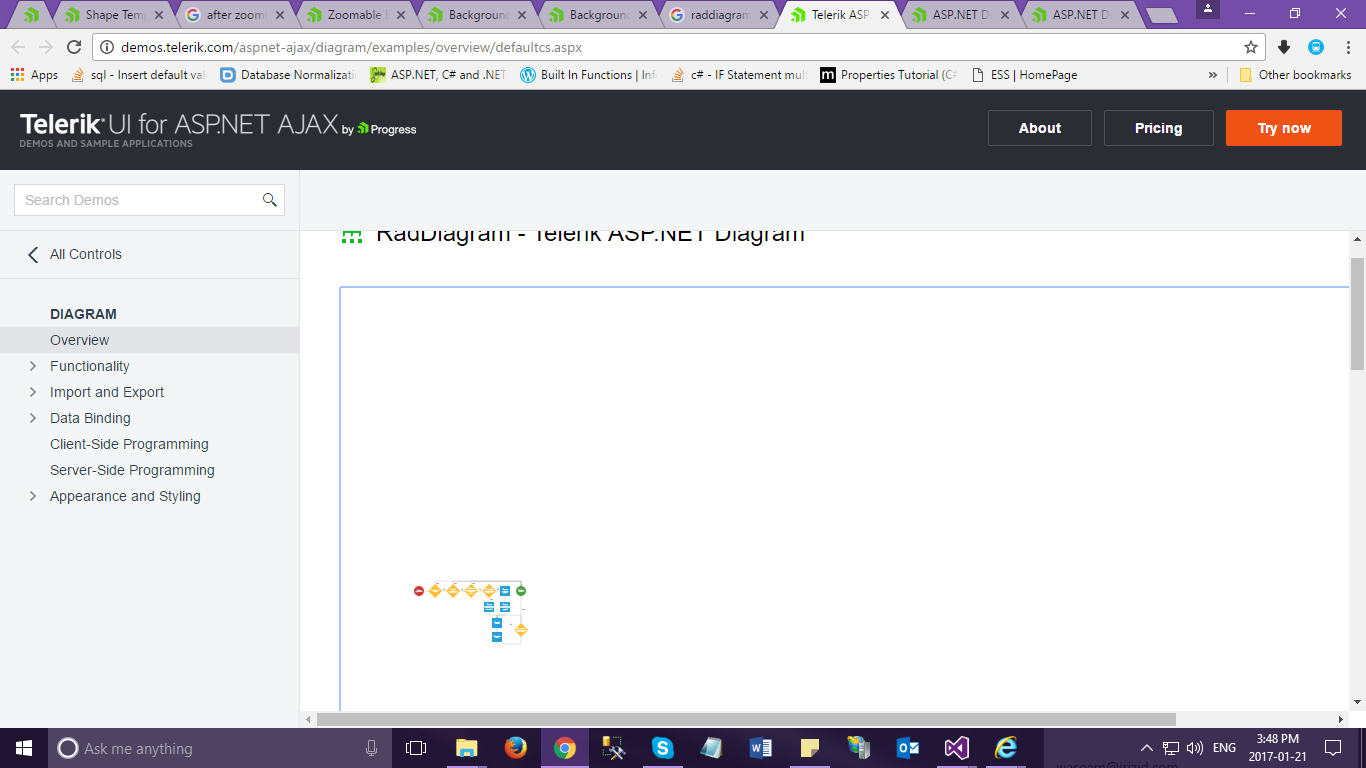
As we are working on RAD DIAGRAM and we are trying to customise. Our requirement is to show the designed diagram even after zoom in and zoom out but in the existing one once we zoom in and try to zoom out the designed diagram is going out of the RAD DIAGRAM window. So can you please suggest us to resolve this issue asap.
Thanks & Regards
Bhavya
Edited ShapesCollection
-
Hdereli
 1 postsMember since:
Oct 2014Posted 17 Oct 2014 Link to this post
Hi,
RadDiagram is really nice component. I am trying to adapt this control to my project. After binding components using server-side methods, it worked fine. However I couldn't get edited shapes new properties (new title,X,Y). ShapesCollection has initial shapes. Is there any way that we can get the latest state of shapes at the server side.
Thanks. -
-
Slav
Admin 1359 posts
Posted 22 Oct 2014 Link to this post
Hello,
The changes that you make on the RadDiagram control are saved only on the client, so it is expected that the ShapesCollection will have the initial shapes.
There is an option for exporting the diagram data as shown in the following demo: http://demos.telerik.com/aspnet-ajax/diagram/examples/saveload/defaultcs.aspx. Nevertheless, currently it has a bug with getting the information for modified connections. You could use the following bug item in our feedback portal to track the status of the issue, vote for it and comment it: http://feedback.telerik.com/Project/108/Feedback/Details/139644
Regards,
Slav
Telerik -
Bhavya
 41 postsMember since:
Aug 2015Posted 15 Dec 2016 in reply to Slav Link to this post
Hi Slav,
I am creating a raddigram as in this link "http://docs.telerik.com/devtools/aspnet-ajax/controls/diagram/functionality/shape-templates"
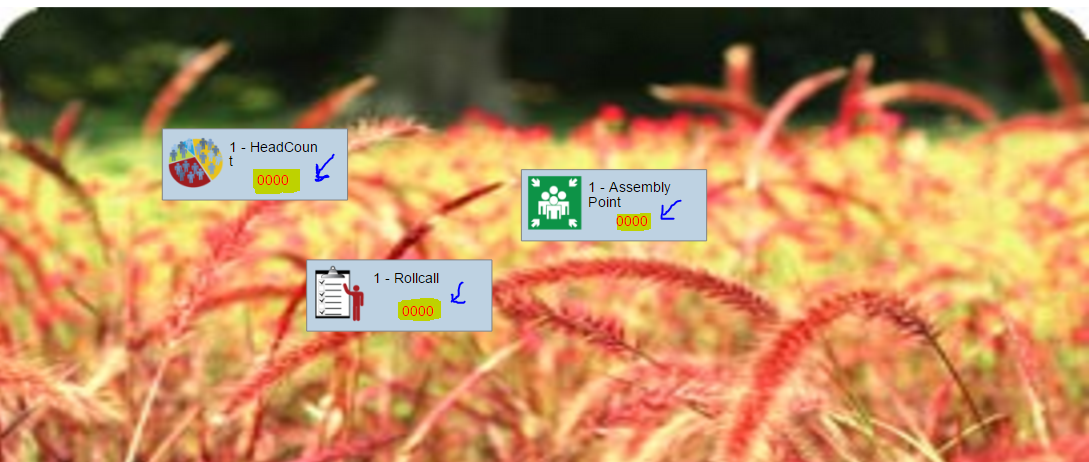
but i am not using DiagramShape. i am able to get the data as shown in the picture pic1.
later i am calling a function to check the value has been increased or not, if value increased i have to update the value. only value should be updated, i should not redraw whole shape. can i do that? if so how?
Please help me in this context.
in timer i am doing in this way but not able to update.
aspx:
<telerik:RadDiagram runat="server" ID="theDiagram" width="1330" RenderMode="Auto">
<ClientEvents OnClick="OnClick" />
<ShapeDefaultsSettings Visual="ImageTemplate"></ShapeDefaultsSettings>
</telerik:RadDiagram>
ImageTemplate:
function ImageTemplate(options) {
var dataviz = kendo.dataviz;
var group = new dataviz.diagram.Group({ autoSize: true });
var backGID = options.id;
if (backGID != "s1") {
group.append(new dataviz.diagram.Rectangle({
x: 0,
y: 0,
width: options.width,
height: options.height,
width: 195,
height: 75,
border_radius: 5,
background: "webkit-linear-gradient(top, #bed2e2 0%,#abd3ee 94%,#d5ebfb 100%)",
fill: {
color: "#bed2e2"
}
}));
var textWrap1 = options.content.substring(0, 12);
var textWrap2 = options.content.substring(12, 19);
group.append(new dataviz.diagram.TextBlock({
text: textWrap1,
color: "#000000",
x: 70,
y: 10
}));
if (textWrap2 != "") {
group.append(new dataviz.diagram.TextBlock({
text: textWrap2,
color: "#000000",
x: 70,
y: 25
}));
}
var img = options.content;
if (img.indexOf("ead") != -1) {
img = "../Images/Img_HeadCount.png";
group.append(new dataviz.diagram.TextBlock({
text: options.Counter,
color: "#FF0000",
x: 100,
y: 45
}));
}
else if (img.indexOf("oll") != -1) {
img = "../Images/Img_Rollcall.png";
group.append(new dataviz.diagram.TextBlock({
text: options.Counter,
color: "#FF0000",
x: 100,
y: 45
}));
}
else {
img = "../Images/Img_Assembly_Point.png";
group.append(new dataviz.diagram.TextBlock({
text: options.Counter,
color: "#FF0000",
x: 100,
y: 45
}));
}
var image = new dataviz.diagram.Image({
source: img,
x: 5,
y: 5,
width: 60,
height: 60,
});
group.append(image);
}
else {
var jsonFilename = '<%=backImageUpload%>';
if (jsonFilename == null || jsonFilename == "") {
var imageFolder = "../backgroundImage/backgound.jpg";
}
else {
var imageFolder = "../backgroundImage/" + jsonFilename + ".jpg";
}
var wid = dataviz.DEFAULT_WIDTH;
var image = new dataviz.diagram.Image({
source: "../backgroundImage/" + options.content + ".jpg",
x: 10,
y: 7,
width: wid + 550,
height: 400 + 200,
});
group.append(image);
}
return group;
};
timer function:
function CountDownTimer() {
$.ajax({
type: "POST",
url: "Frm_MusteringMonitor.aspx/GetSessionValue",
contentType: "application/json;",
data: JSON.stringify(),
success: function (Data) {
if (Data.d != "") {
var diagramWidget1 = $find("<%= theDiagram.ClientID %>").kendoWidget;
var listOfObject = JSON.parse(Data.d);
var dectionaryItem = Data.d.replace(/[&\/\\#+()$~%.'"*?<>{}]/g, '');
var getVal = dectionaryItem.split(',');
var leng = diagramWidget1.shapes.length;
var i = 1;
for (i = 1; i < leng; i++) {
var jsonObjName = getVal[i - 1].split(":");
var DiaObjname = diagramWidget1.shapes[i].options.content;
if (jsonObjName[0] === DiaObjname) {
var NewValue = jsonObjName[1];
diagramWidget1.shapes[i].options.Counter = NewValue ;
// i have three shapes so doing loop here and i am able to get the value here but not updating on diagram
}
}
}
},
error: function (XMLHttpRequest, textStatus, errorThrown) {
}
});
}
Thanks in advance. -
Slav
Admin
1359 postsPosted 20 Dec 2016 Link to this post
Hello Bhavya,
You can redraw the visual of the shape to show the new value. I have attached a short sample that demonstrates this approach.
Regards,
Slav
Telerik by ProgressTry our brand new, jQuery-free Angular 2 components built from ground-up which deliver the business app essential building blocks - a grid component, data visualization (charts) and form elements. -
-
Bhavya
41 postsMember since:
Aug 2015Posted 20 Dec 2016 in reply to Slav Link to this post
Hi Slav,
Thanks for the solution. it is working now without flickering.
-
Bhavya
41 postsMember since:
Aug 2015Posted 11 Jan Link to this post
Hi Slav,
There is a function CountDownTimer(),which is in previous message
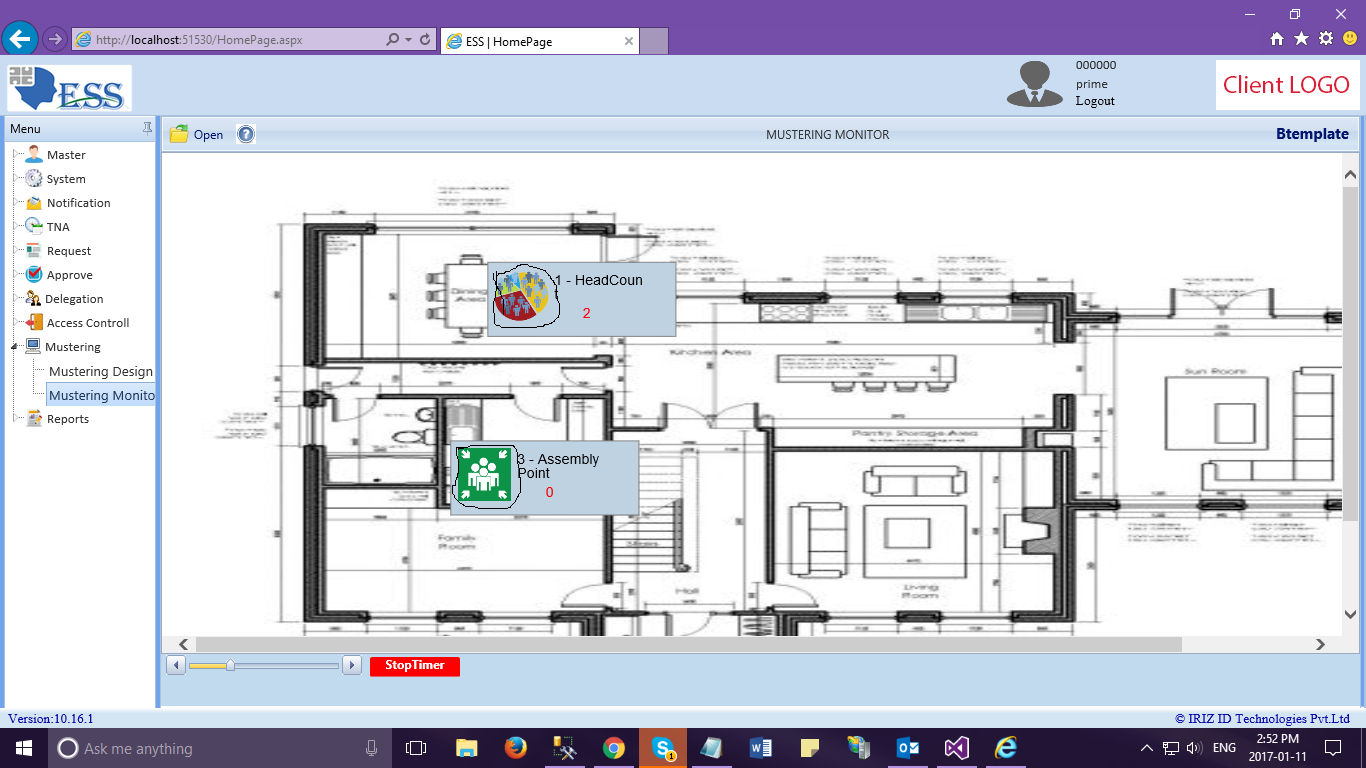
How can i change the image ,In the Attached file i have highlighted the image.
-
Bhavya
41 postsMember since:
Aug 2015Posted 11 Jan in reply to Bhavya Link to this post
You can redraw the visual of the shape to show the new image. I have attached a short sample that demonstrates this approach.
Regards,
Slav
Telerik by Progress -
-
Bhavya
41 postsMember since:
Aug 2015Posted 11 Jan in reply to Slav Link to this post
Hi Slav
How Can i redraw the visual of the shape to show the New Image.methods are same as in previous msg(count down timer). I have attached a template ,where it should affect.
Thanx in advance
-
Slav
Admin
1359 postsPosted 16 Jan Link to this post
Hello Bhavya,
You can create an Image object in the visual as shown in the following help article: http://docs.telerik.com/devtools/aspnet-ajax/controls/diagram/functionality/shape-templates
Regards,
Then you can pass the path of the new image via the options of the shape and redraw its visual similarly to how I update the content in my previous sample.
Slav
Telerik by ProgressTry our brand new, jQuery-free Angular 2 components built from ground-up which deliver the business app essential building blocks - a grid component, data visualization (charts) and form elements. -
Bhavya
41 postsMember since:
Aug 2015Posted 4 days and 3 hours ago in reply to Slav Link to this post
Hi Slavs,
Thank You For the Previous Solution,
As we are working on RAD DIAGRAM and we are trying to customise. Our requirement is to show the designed diagram even after zoom in and zoom out but in the existing one once we zoom in and try to zoom out the designed diagram is going out of the RAD DIAGRAM window. So can you please suggest us to resolve this issue asap.
Thanks & Regards
Bhavya
-
2 Answers, 1 is accepted


You can handle the zoomStart event of the diagram and pass the position of the root shape of the diagram to the e.point object of the event. For example:
http://dojo.telerik.com/AgeCi
Regards,
Vessy
Telerik by Progress

Hi Vessy,
Am a new user to this telerik, the problem what i am facing is >> In Telerik Rad Diagram once after zooming the rad diagram, the scrolling should enable(Horizontal and vertical) and even the diagram should not move when user tries to move the diagram by clicking ctrl+Mouse(Drag) because the diagram is going out of the window.
Please help me to resolve this issue.
Best Regards
Manjari