What You Can Uncover in the New Overview Tab in Fiddler Everywhere 2.0

Summarize with AI:
The Fiddler Everywhere 2.0 release last month debuted a host of impressive features aimed at helping you get to the cause of problems quickly while debugging. When it comes to performance reviews, quickly finding the numbers that can tell you what’s going on is crucial.
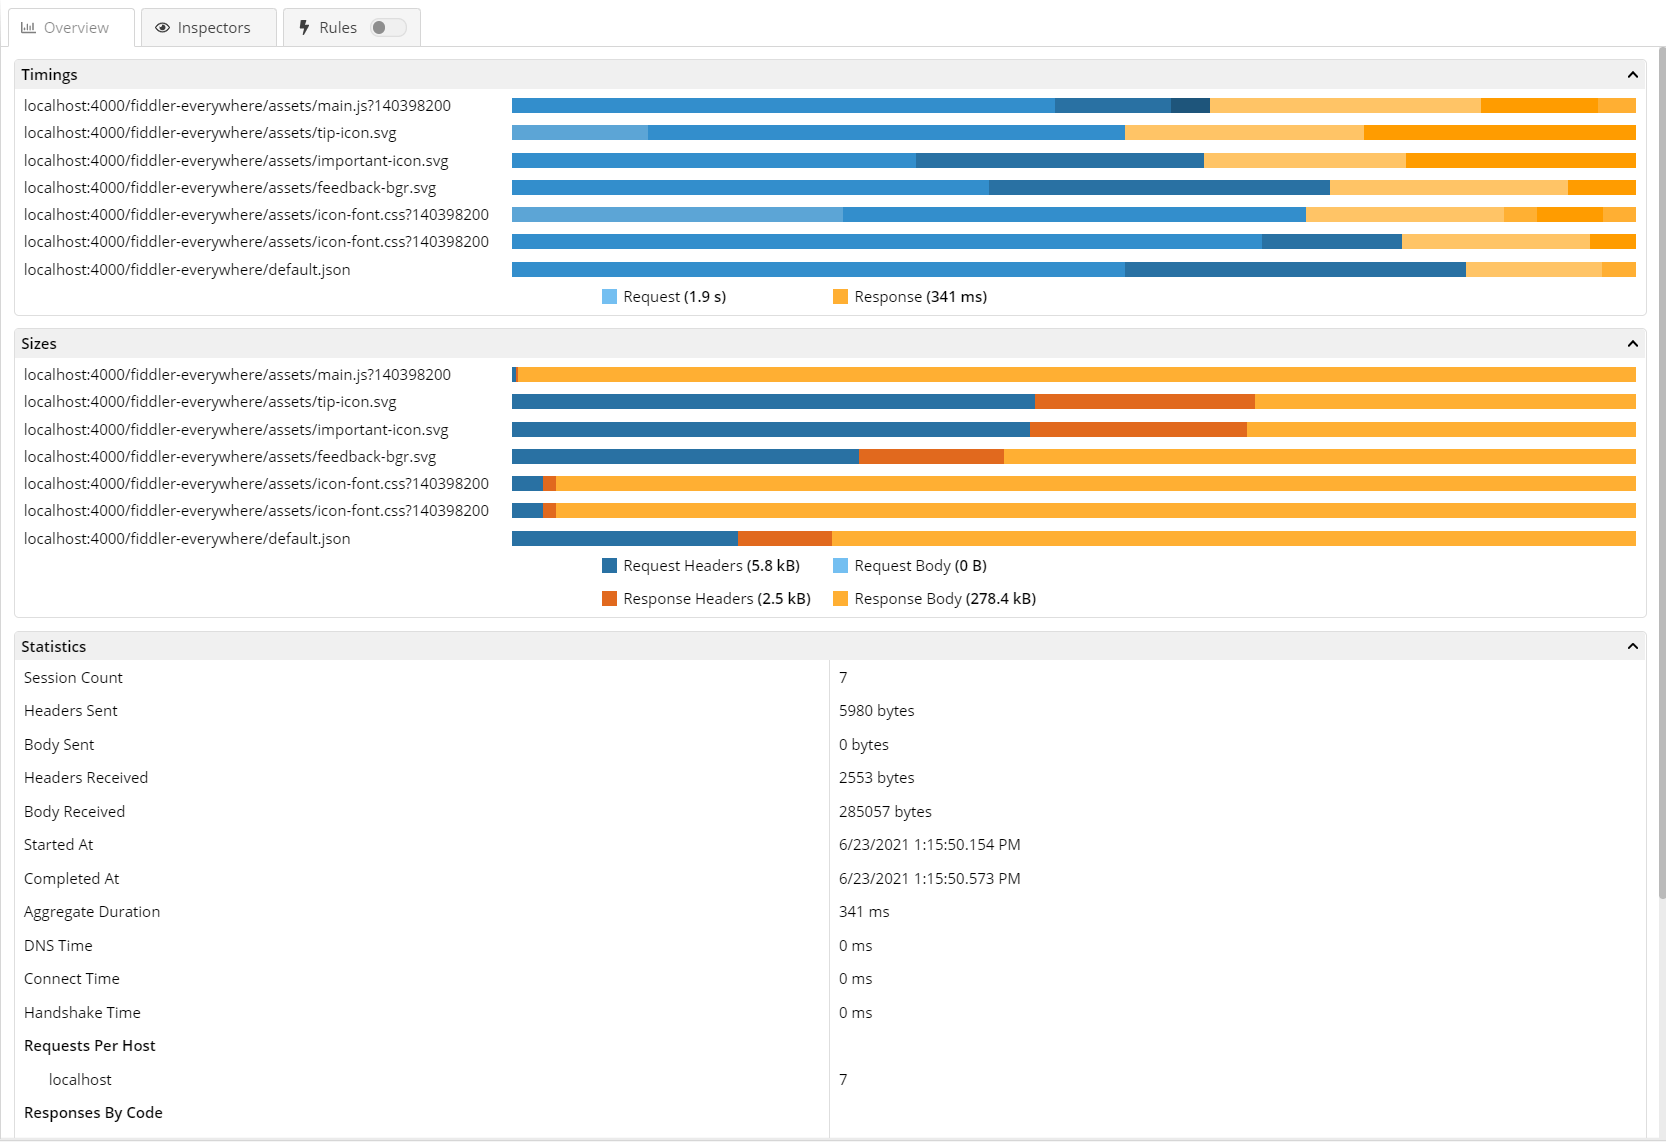
With Fiddler Everywhere 2.0, you can now check the sizes and timings for the execution of different parts of your requests and responses, visualized as text as well as in a chart-like format. You no longer must hunt for this data—it is now easily visible to you, and you can pinpoint what changes need to be made.
In the new Overview tab you can see the entire URL, protocol and SSL version in the column. In addition, selecting multiple sessions shows you statistics for all of them, such as the number of requests per host, number of status code responses, etc. All this information is available in the new Overview Inspector tab applicable for Live Traffic and Saved and Shared sessions.
Widgets for All Your Needs
The Overview tab provides an efficient way for you to gather structured information and specific statistical data for one or more captured sessions: widgets. These dynamic widgets change to meet the needs of the number of sessions you select. Let’s take a look at these handy widgets.
Timings
The robust Timings widget will let you select a single or multiple sessions, and each session will be presented on its own line and with its own URL for reporting charts. You’ll learn the time each session spent in Gateway Determination, DNS , TCP Connect and HTTPS Handshake. You can see the timestamps for major events, so you know how long it took between events down to the millisecond—events like client connected and beginning request, and then how long until Fiddler got the Request headers, how long until the client was done, etc. Plus similar timestamped events for the Response. This widget will give you so much data to play with!
Sizes
The Sizes widget gives you a view of the size of either a single session or a selection of multiple sessions. The results will break down the bytes or kilobytes in each: headers and body of Request and Response. This will allow you to compare the sizes of what the client sent to the server (Request) and what the server returned to the client (Response).
Statistics
With the Statistics widget, you can look at a selection of multiple sessions to learn or report about duration for the group of sessions, the time they spent in DNS, Connect and Handshake, the hosts and how many Requests each host was sent, the received Response status codes and how many times each appeared in the selection, and the types of Responses, with a tally of their sizes. Statistics is going to help you dive into trouble spots and work with your team to discover solutions for pain points.
Request Details
When you want to uncover specifics about a single session’s Request, the Request Details widget will serve you well. You can learn, among other things, the HTTP request method used, the protocol type, the SSL version, and timings with timestamps for milestone triggered events.
Response Details
Similarly, you can zoom in on a single session’s Response data with the Response Details widget. It will give you the HTTP response status code, sizes of body and headers, and timings of all the triggered response events.
Fiddler 2.0 Has Lots to Offer
Prior to the release of Fiddler Everywhere 2.0, the functionality incorporated into this tab was non-existent. Whether you need to optimize your website loading or debug your application for another issue, you now know how to measure the time it takes for execution, and their sizes to understand and identify the cause of a bottleneck.
See the data behind the numbers in a way that makes sense and gives you the insight you need without any added effort.
Be sure to download the latest Fiddler Everywhere version and check out the handy Overview tab! Visit the documentation page for more specifics.

Eve Turzillo
Eve Turzillo is a Developer Advocate at Progress, with a passion for all things related to digital experience. For close to 20 years, Eve has been bridging the gap between technologies and community, starting with .NET and now with managed file transfer. Her experience spans various technical ecosystems, yet fostering community engagement and developing initiatives that align with both organizational goals and community needs has always been at the core of what she does.

