Telerik Reporting & Report Server: Polished Assets Manager in Web Report Designer

Summarize with AI:
The R1 2022 Service Pack release of Telerik Reporting & Telerik Report Server comes with important improvements and fixes in the Web Report Designer’s Assets Manager, the PictureBox and Kendo UI theming compatibility.
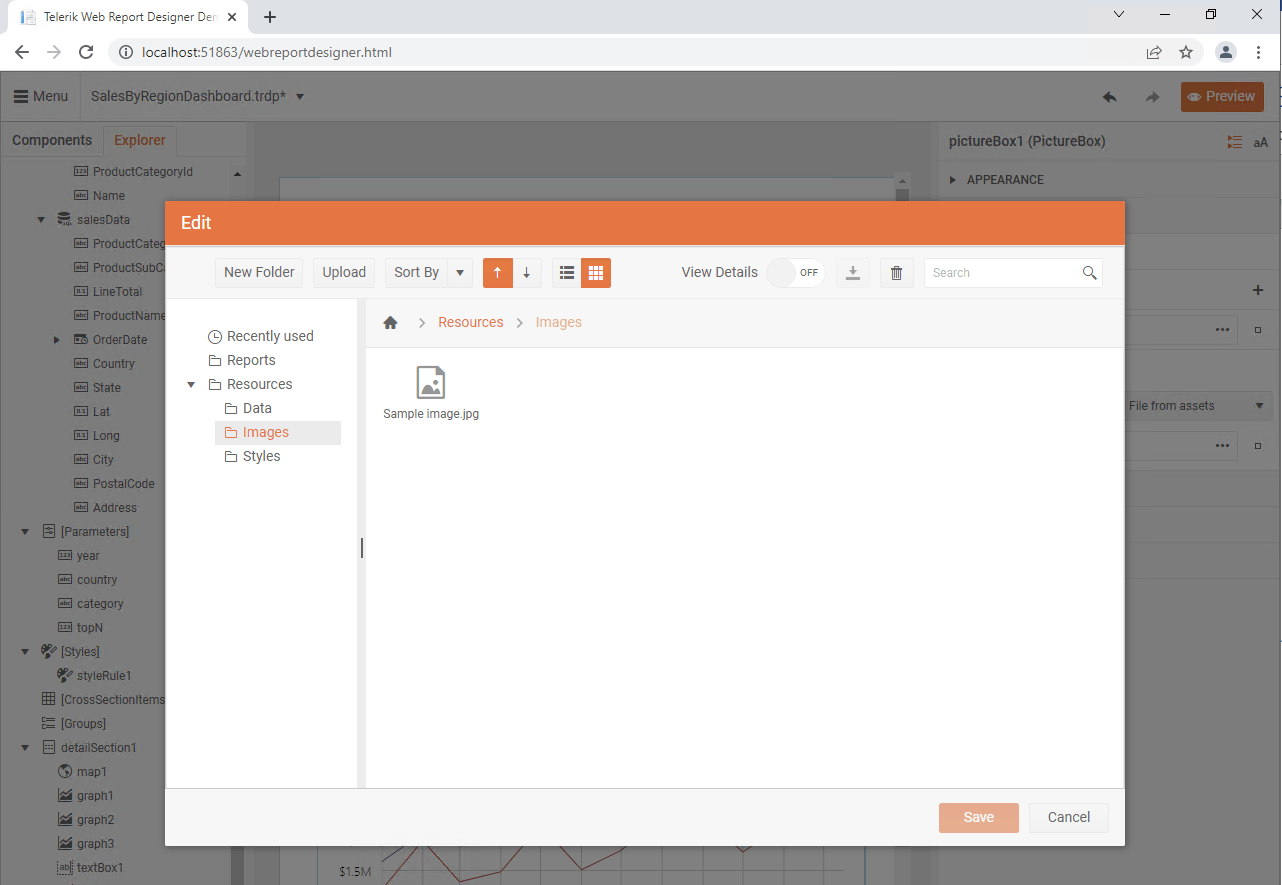
Assets Manager
With the 2022 R1 release, we introduced in the Web Report Designer the Assets Manager tool to enable report authors to upload and reuse imagery, data and styles to the server. Based on user feedback and internal quality assurance, we had to address some issues to improve it as necessary. Let me list some of the changes:
- Assets Manager is now also used when selecting a report to get added in a Report Book (Combined Report) either from the design surface or from the Properties area. Up until now, one had to input the name of the report being added manually. We could enable that because now the Reports folder in the manager gets populated with the permitted reports in the context of the Report Server.
- The Recent assets functionality of the Assets Manager now populates the correct path as a value of the edited property, e.g., the value of the PictureBox item if one chooses it from the Recent folder.
- An already deleted asset was still present in the Recent folder.
- When the items in the Assets Manager are displayed in a grid, they (both files and folders) could not be renamed.
With these listed, now the Assets Manager provides all the necessary functionality to create, rename and delete assets.
As a heads-up, I would add that we plan the following further improvements of the Assets Manager functionality. First, in the context of the Report Server when choosing a report, the available reports will be represented by categories, i.e., each category will be listed as a folder, and the individual reports will be listed in it. For the reports created, edited and chosen in the context of your custom web application, we plan to even support folder nesting so that the reports get organized as the users need.

Custom Data Provider Support for SQL Data Source
The SQL Data Source continues to be the most-used one, and this is not a surprise having in mind how mature and accordingly reliable the relational database management systems are.
Still, not every data provider out there can be pre-listed when configuring the SQL Data Source. This is because one can add a DbProvider as a NuGet package, for example, and register it programmatically using the DbProviderFactories class. To handle that scenario while the report author is setting up an SQL Data Source, the Web Report Designer now allows entering the name of the target data provider and this way enables plugging it in. The request to introduce this extensibility point came from you, our users.
PictureBox Item UX
Yes, TextBox is the most-used item. But the PictureBox is second. And there is a simple quality-of-life improvement that came up as an idea thanks to the release webinar demo. Previously, if the report author chose a substantially sized image, they sometimes wouldn’t realize it was chosen successfully—as, by default, the Sizing property had the value Normal, which rendered in the item’s boundaries the top-left corner of the chosen image. If that top-left corner of the image is not particularly expressive, this could lead to confusion. Not cool.
Now, when adding a new PictureBox item, its Sizing property gets initialized to the Scale Proportional value so that the whole image gets displayed, scaled as necessary. And this logic is now applied from all the three report designer tools—Web Report Designer (including the Blazor one based on it), the Standalone Report Designer and the Visual Studio built-in one. Keep in mind that the new logic does not affect existing reports in any way, so your implemented visualizations are safe.
Report Server FTW
With the Assets Manager addition, the Web Report Designer is now my designer of choice in the context of editing reports on the Report Server. This addition allows for having common imagery and styles for the reports a company uses. This simplifies the common branding of the reports and the reuse of data sets stored as files.
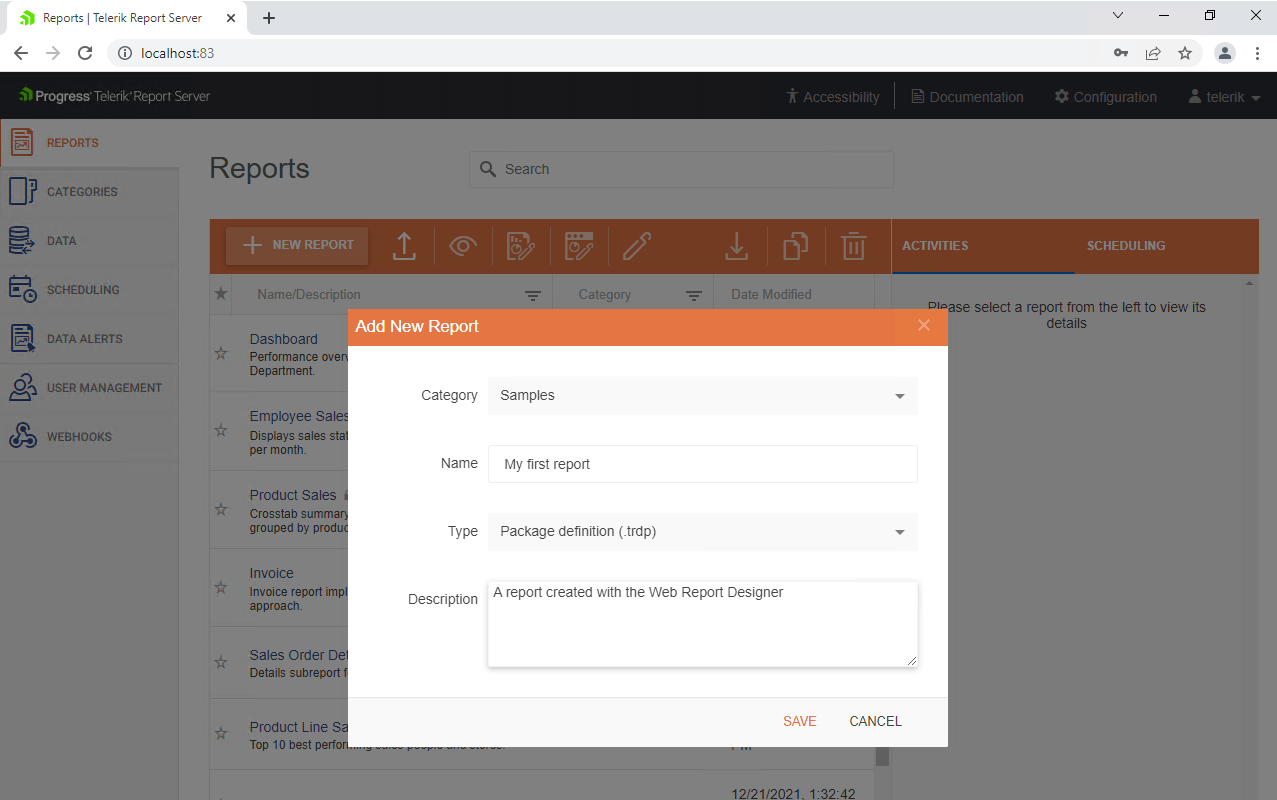
The SP release enables the usage of the Web Report Designer on report creation as well. Let me explain. Up until now, when the New Report action was triggered by the user this opened the Standalone (aka Desktop) Report Designer. It does the job well, but it just breaks the pure-web user journey of the users. Now, as long as the Web Report Designer usage is enabled, the New Report action opens a dedicated dialog to choose and enter a category and name for the newly created report. Once these are in place, it opens the Web Report Designer to work on the report. Finally, one can use only the personally preferred designer tool without touching the other. There, I said it.

Speaking of the Report Server, there is another UX goodie worth mentioning. Have you ever accidentally opened or even triggered the Change password/Log out menu while only trying to Configure the server or Preview a report while editing it in the Web Report Designer? I have. Well, no more. The menu in question is only opened when clicked, not just hovered. Simple.
Kendo UI Dependency Change
Kendo UI libraries started introducing changes aligned with this plan to further improve the customizability and expressiveness of the libraries and make them capable of fitting the target corporate design language. This evolution comes at a price, and indeed we identified certain style incompatibilities and a non-expandable export dropdown when using Kendo UI scripts with versions before R1 2022 along with the version 5.0.1 of the Sass-based Kendo UI themes. That is why with this SP we issued the necessary changes in the HTML5-based report viewer controls, updating our Kendo UI requirements. Starting with this release, we will be using Kendo UI version 2022.1.119 or later along with the corresponding Kendo UI themes.
Other Important Fixes
There are two regression bugs fixed, so I feel obligated to mention those for the people who noticed and reported them. Thanks!
Shapefiles (used to set up a Choropleth visualization) referenced with absolute pathname would stop resolving correctly when the report was generated. Generally, it is better not to use absolute paths for any report resources so that a report definition is usable no matter the deployment, but still, this now works again.
In addition, embedded images in the form of a Base64-encoded string that hit a particular length limitation would stop being correctly rendered when the report was rendered. That is now fixed promptly.
Enough. The full list of fixes and improvements may be scanned in the issued release notes for Telerik Reporting and Telerik Report Server. Have fun!
Try It Out and Share Feedback
If you still have not, start your free trial of Telerik Reporting or Telerik Report Server today and share your thoughts in our respective Feedback Portals, or right in the comments below.

Milen Elkin
Milen Elkin is Product Manager of Telerik Reporting & Telerik Report Server. It’s been a while since he joined the company back in 2007. What drives his work is the belief that handling data should be easy. Besides his work, he likes running and cycling in the city of Sofia and enjoys the countless shapes and shades of green color up in the Bulgarian mountains.
