Q1 2015 SP1 is Out, Featuring Scale Breaks in RadChartView
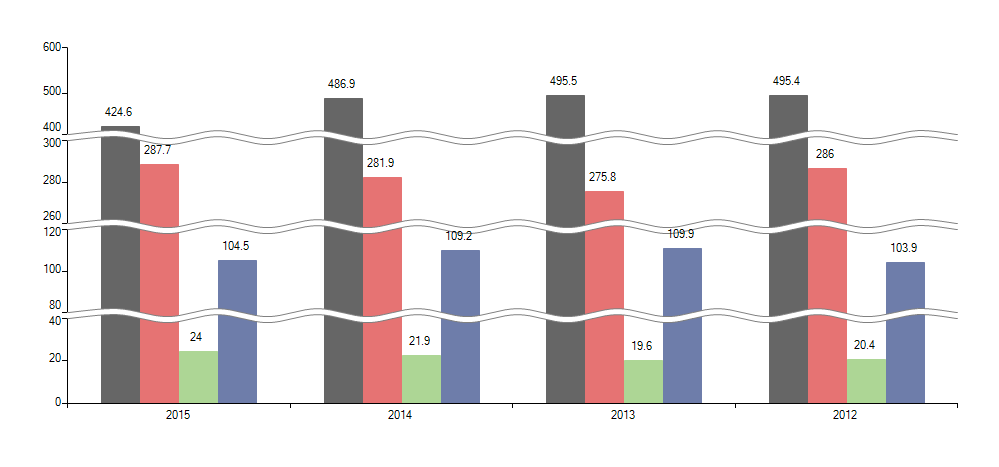
For the service pack of the Q1 2015 release, we kept on the initiative of improving RadChartView where we addressed a couple more feedback items on the control, most interesting of which is the new feature: scale breaks.
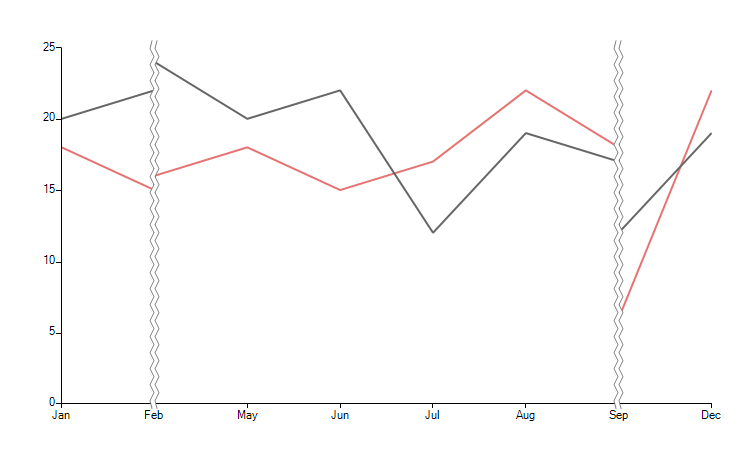
A scale break is a clear visual indication drawn across the plotting area of a chart to denote a break in continuity between the high and low values on a value axis (usually the vertical, or y-axis).

The API for customizing the scale break consist of the following properties:

For a list of the improvements made in Q1 2015 SP1, you can have a look at our release notes.
Make sure you download the new release from your Telerik account, or if you don’t have one, you can download a trial.
A scale break is a clear visual indication drawn across the plotting area of a chart to denote a break in continuity between the high and low values on a value axis (usually the vertical, or y-axis).
Scale breaks are supported in all of the cartesian series, except the financial series. Here is a list of the supported series: Area, Bar, Line, Stepline, Scatter, ScatterLine, Bubble, ScatterArea, Range, RangeBar.
To add a scale break, you need to create an object(s) of type AxisScaleBreak and add it to the ScaleBreaks collection of the desired axis.
To add a scale break, you need to create an object(s) of type AxisScaleBreak and add it to the ScaleBreaks collection of the desired axis.
List<AxisScaleBreak> breaks = new List<AxisScaleBreak>();breaks.Add(new AxisScaleBreak("Break1", "Feb", "Apr"));breaks.Add(new AxisScaleBreak("Break2", "Sep", "Nov"));foreach (AxisScaleBreak scaleBreak in breaks){ lineSeries.HorizontalAxis.ScaleBreaks.Add(scaleBreak);}The API for customizing the scale break consist of the following properties:
- Style: Enables you to change the visual style of the scale breaks. Three different styles are available:
- Straight
- Waved
- Ragged
- BackColor: Enables you to change the background of the scale break.
- BorderColor: Controls the color of the scale break lines.
- Size: Controls the distance between the scale break lines.
For example, here is how to change the style of the scale breaks of the HorizontalAxis:
lineSeries.HorizontalAxis.ScaleBreakStyle = ScaleBreakStyle.Ragged;For a list of the improvements made in Q1 2015 SP1, you can have a look at our release notes.
Make sure you download the new release from your Telerik account, or if you don’t have one, you can download a trial.

About the Author
Stefan Stefanov
Stefan Stefanov (MCPD) is a Senior Manager, Product Management and Product Marketing at Progress. He has been working with Telerik products since 2010, when he joined the company. Off work he enjoys traveling, hanging out with friends and reading various technology blogs. You can find Stefan on Twitter and LinkedIn.
Related Posts
Comments
Comments are disabled in preview mode.
