
Performance Profiling Your React App

Summarize with AI:
React is an awesome framework for frontend development. Knowing how to discover performance issues in a React application is important as a precursor to building performant React apps. In this article, we'll learn how to profile the performance of React apps using React Profiler, and leverage it to discover performance issues.
React is an awesome framework for frontend development. It helps us painlessly create interactive UIs. Using the virtual DOM, React is able to reconcile changes to the DOM in a performant way.
But as we write code, we unknowingly introduce performance issues. Thus, we should be able to discover these performance issues, before we can fix them.
In this article, we’ll learn how to profile the performance of our React application using React Profiler.
In today’s web, amongst other things, an app is said to be performant if it handles rendering over 60 frames per second. Anything less than that would lead to “jank” and an overall slow user experience.
Prerequisites
To follow this article, basic React knowledge is required. You should also be familiar with the React DevTools.
React Profiler
React 16.5 added support for the DevTools profiler plugin. This plugin collects timing information about each rendered component in order to identify performance bottlenecks.
React applies changes to the DOM during its commit phase. React Profiler groups performance by commits, giving you the ability to see how costly each change is.
Accessing React Profiler
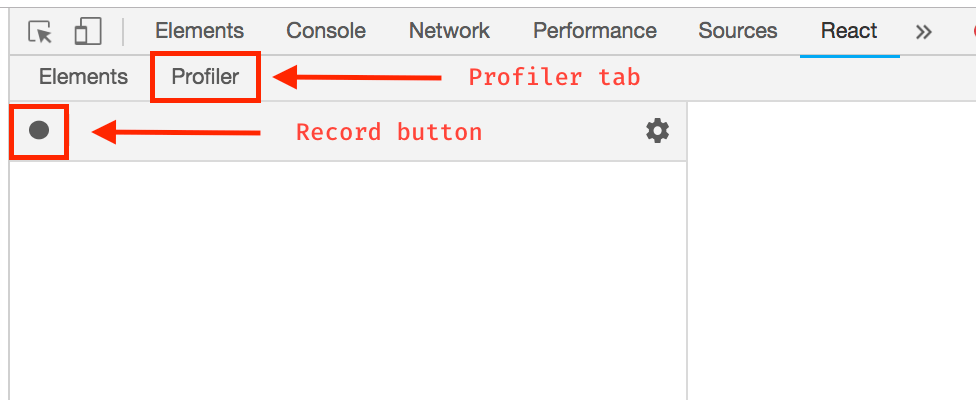
If you’re running a React application that supports React Profiler, simply open the React DevTools and you’ll see a “Profiler” tab. Clicking the tab will show you a record button, which records your app’s performance when clicked:
Profiling A React Application
To demonstrate how to profile a React application using React Profiler, I’ll use a simple to-do app built using the Create React App.
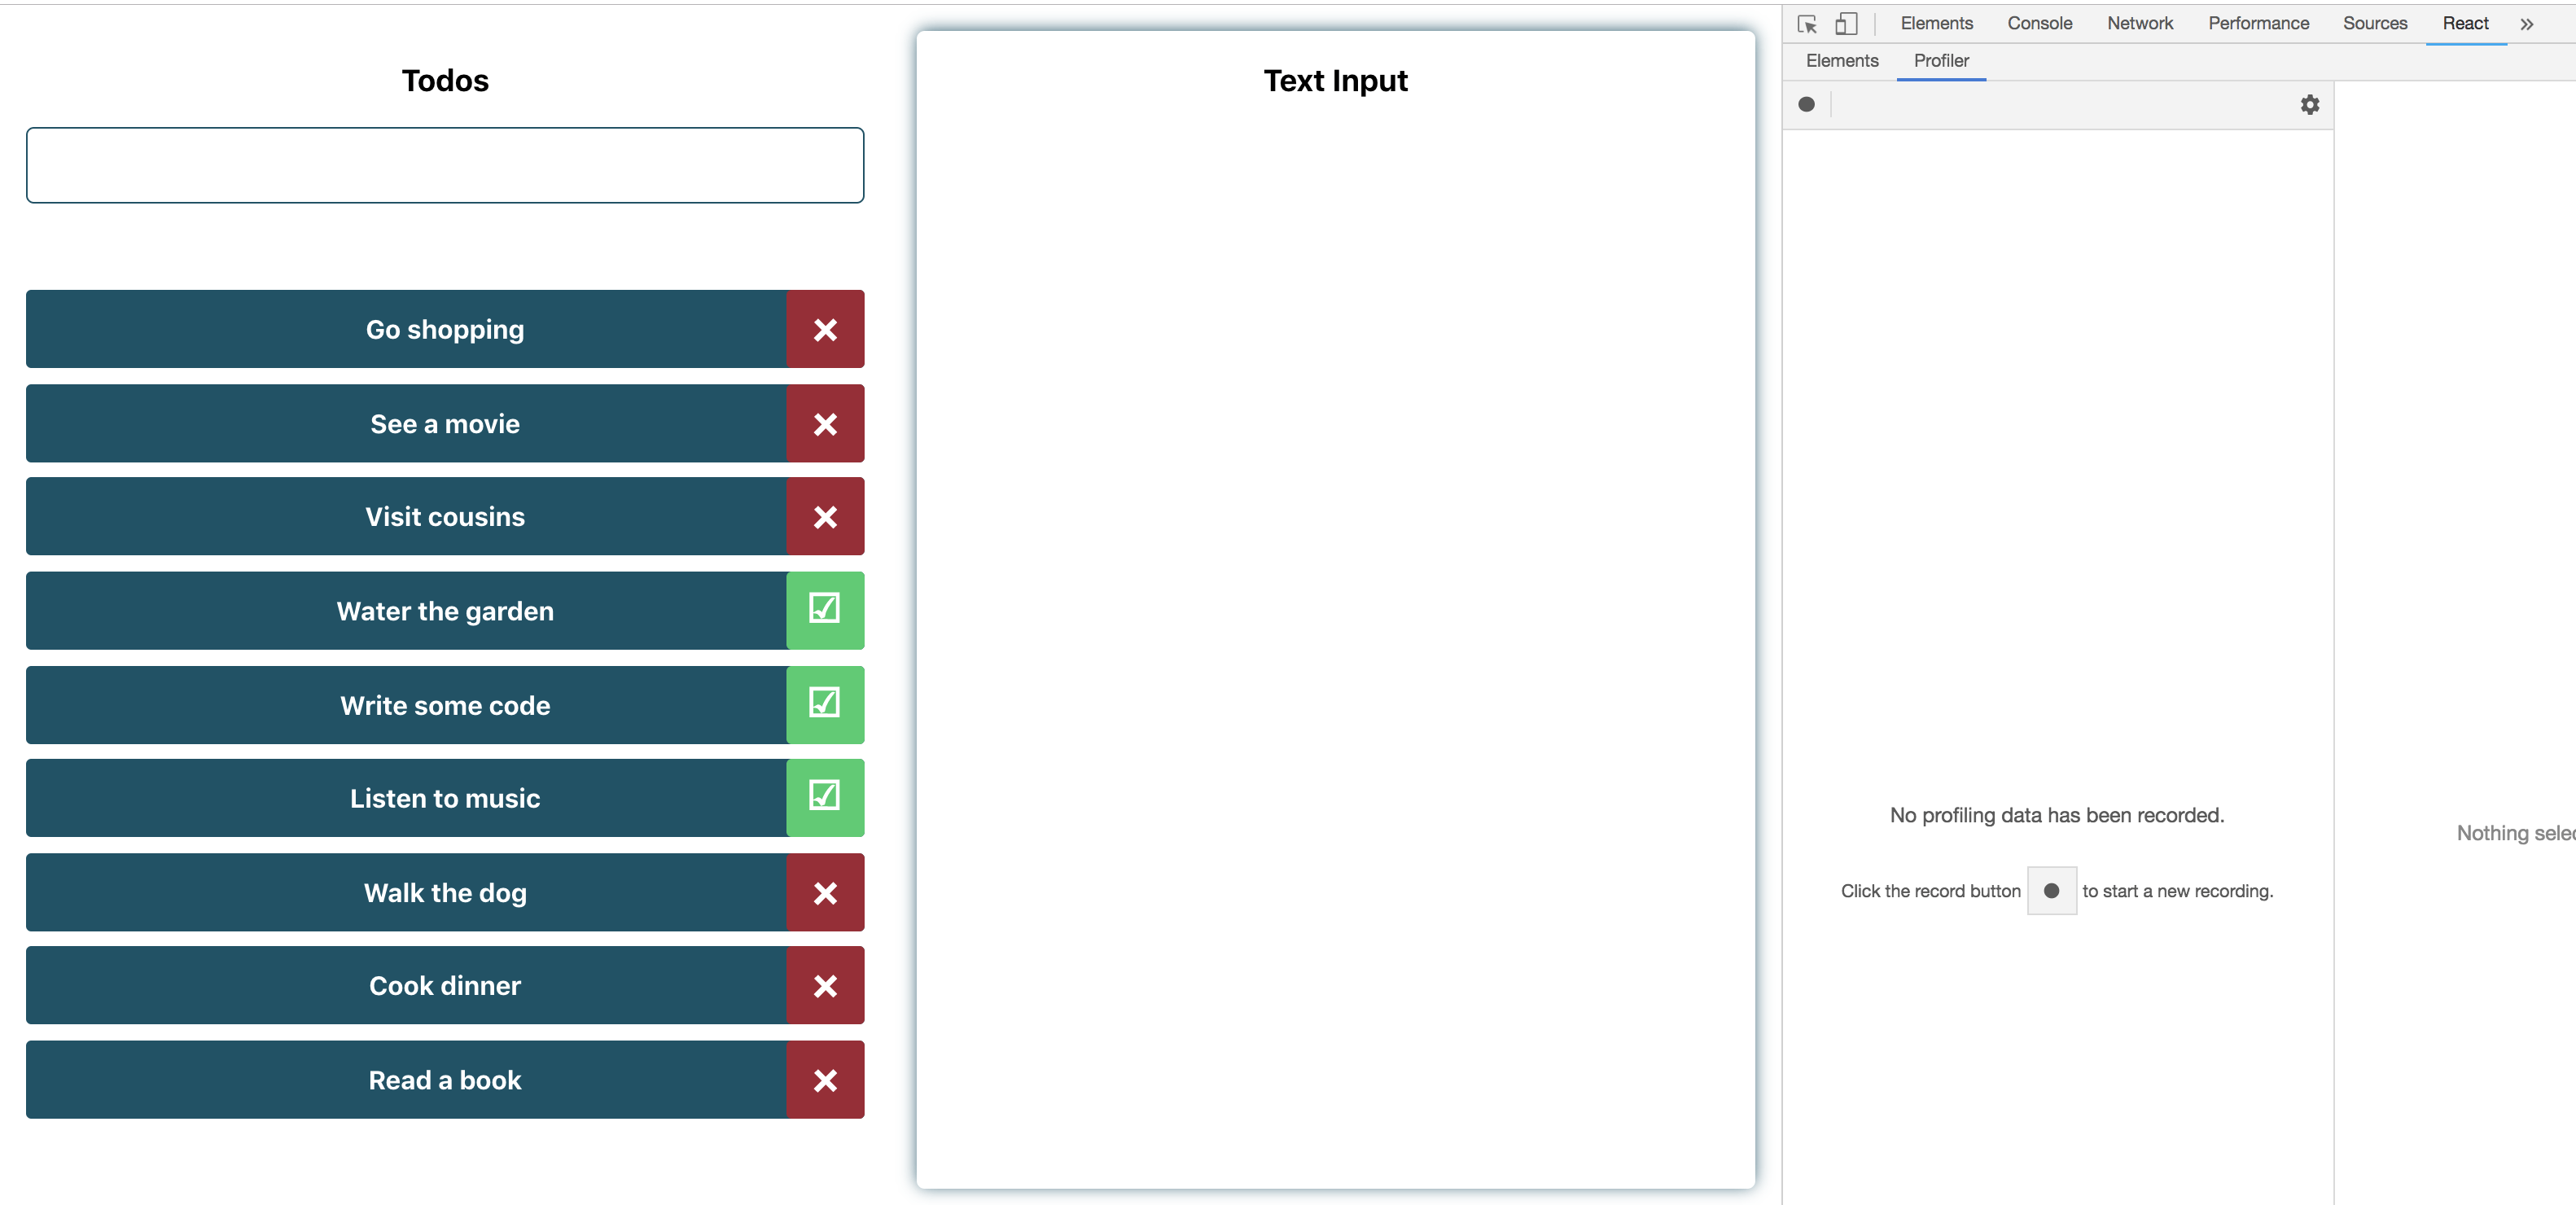
The to-do app has an input field and renders a hard-coded list of to-dos. The input from the input field is displayed on another section of the page:
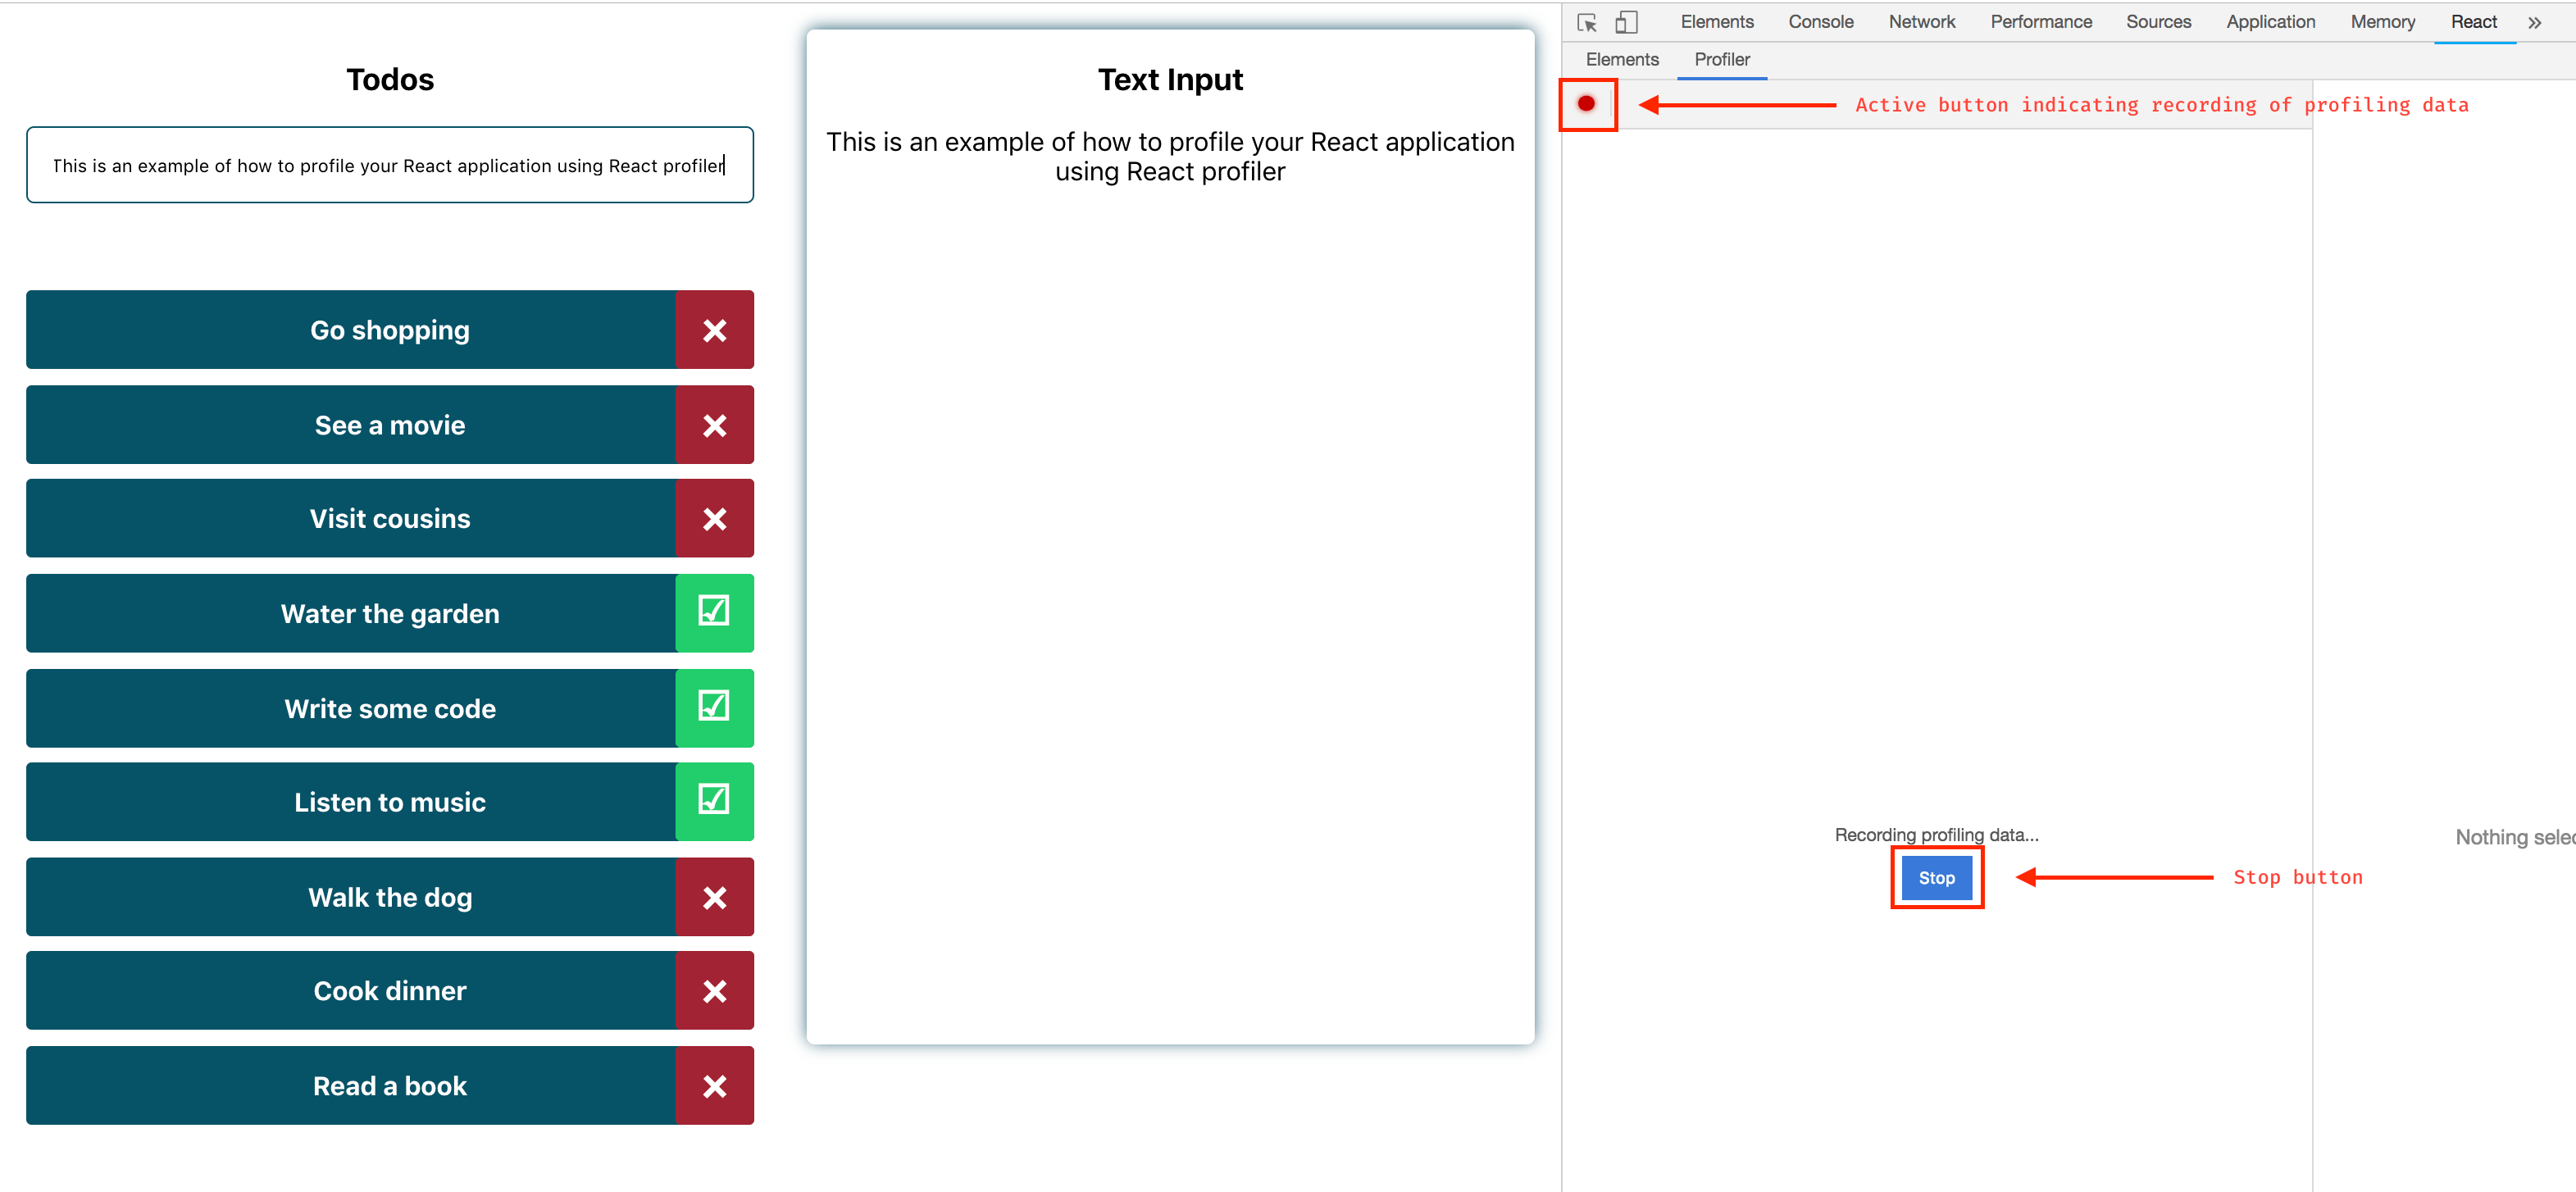
To record the performance of your app, click the record button, then make use of your app as you normally would. Once you start recording, React Profiler collects information every time your application renders. When you are done profiling, click the stop button:
Reading Performance Data
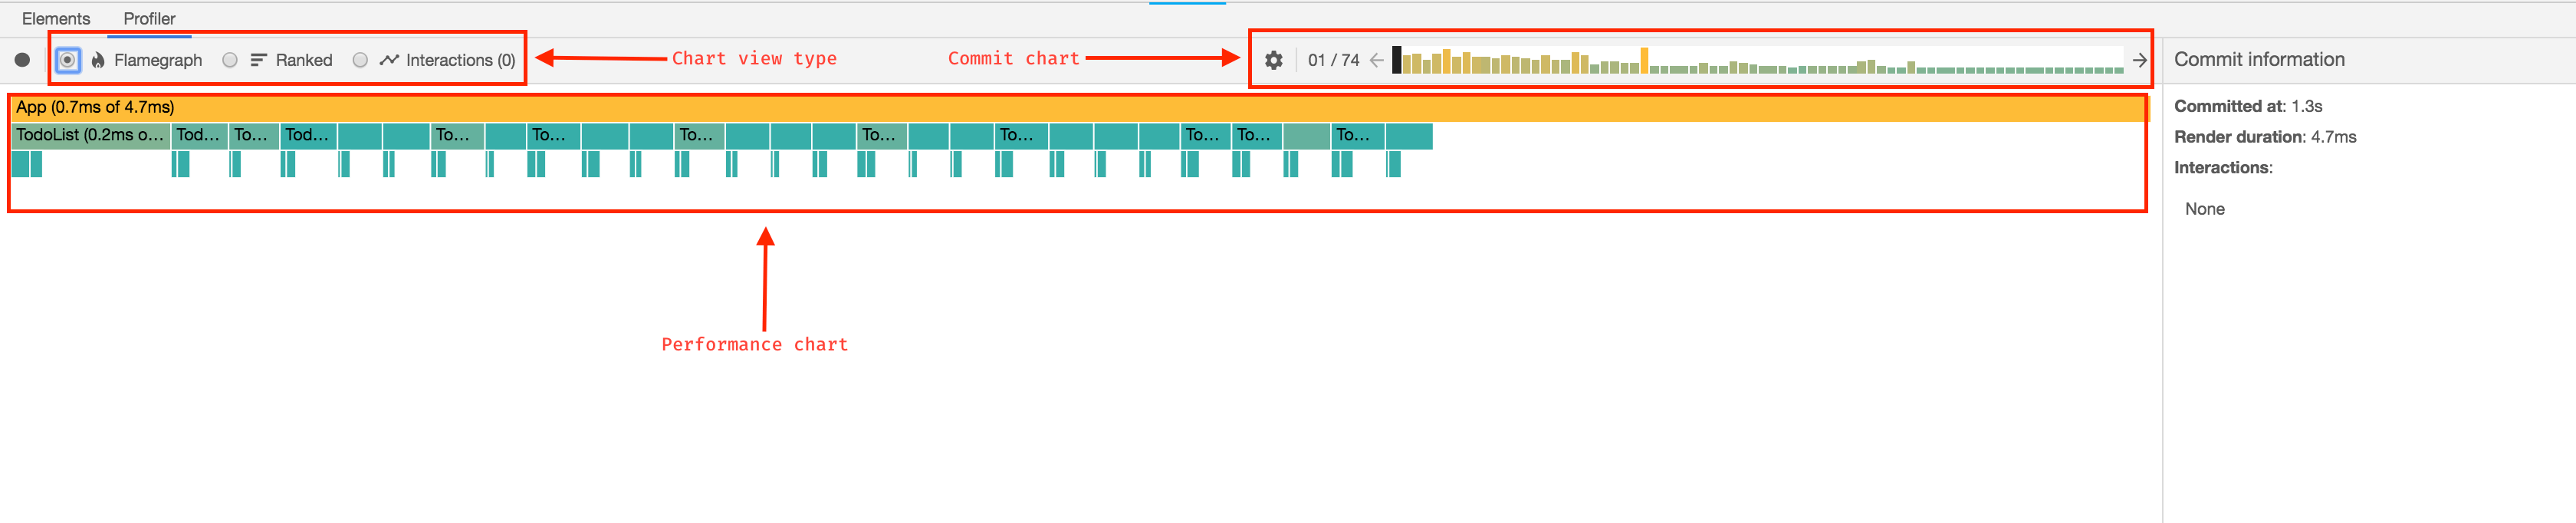
When you click the stop button, the Profiler tab is filled with performance data in form of a flame graph. The data has a commit chart, chart view selector, and performance chart view section:
Commit Chart
The commit chart can be found in the top right part of the tab. It contains all the commits applied within the profiling period.
Each bar in the chart represents a single commit. The height and color of the bars represent how long a commit took to render; the tall and yellow bars are the commits that took longer, while the short and blue ones represent the commits that took a shorter time to render.
The bars can be selected (selected bars are colored black) and their corresponding commit information viewed:
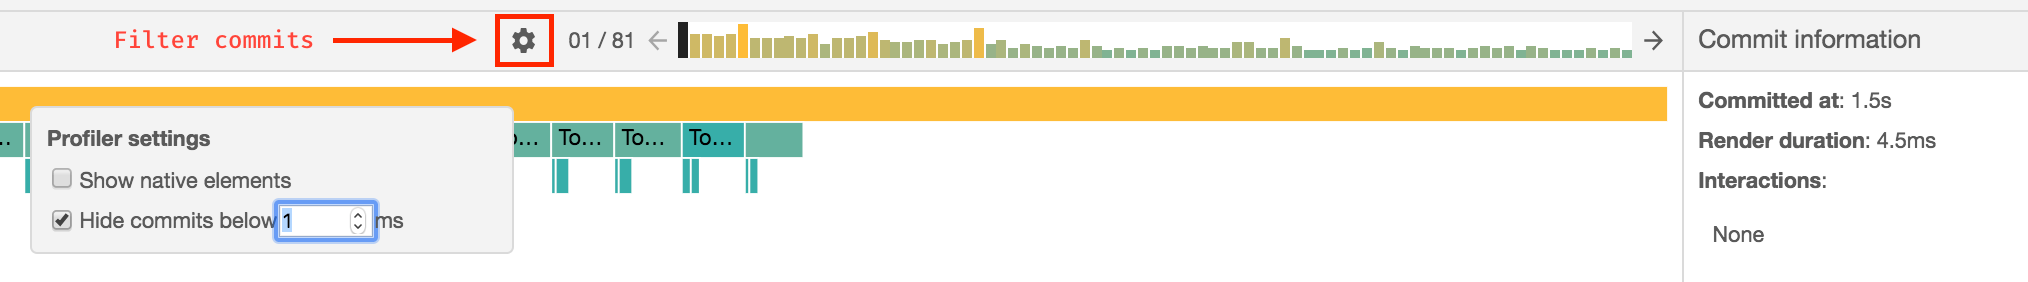
In the image above, we see that there are 81 commits. The currently selected commit took 4.5ms to render and there was no interaction. In cases where you have so many commits, you can filter commits by clicking the gear icon shown in the image above. It allows you to hide commits that fall under specified thresholds.
Browsing Commits
Commits can be viewed as flame charts, ranked charts, component charts and interactions. These different views give you different perspectives with which to view the performance of your app. Clicking a commit bar shows you data for that commit in the chart view.
Flame Chart
The flame chart view represents the state of your application for a particular commit. Each bar represents a component and the width of a bar shows how long it took for a component and its children to be rendered.
The colors of the bars also indicate how long it took for each component to render. Yellow components took more time, blue components took less time, and gray components did not render at all during the commit.
Clicking a component shows you information about it during that commit on the right detail panel:
Ranked Chart
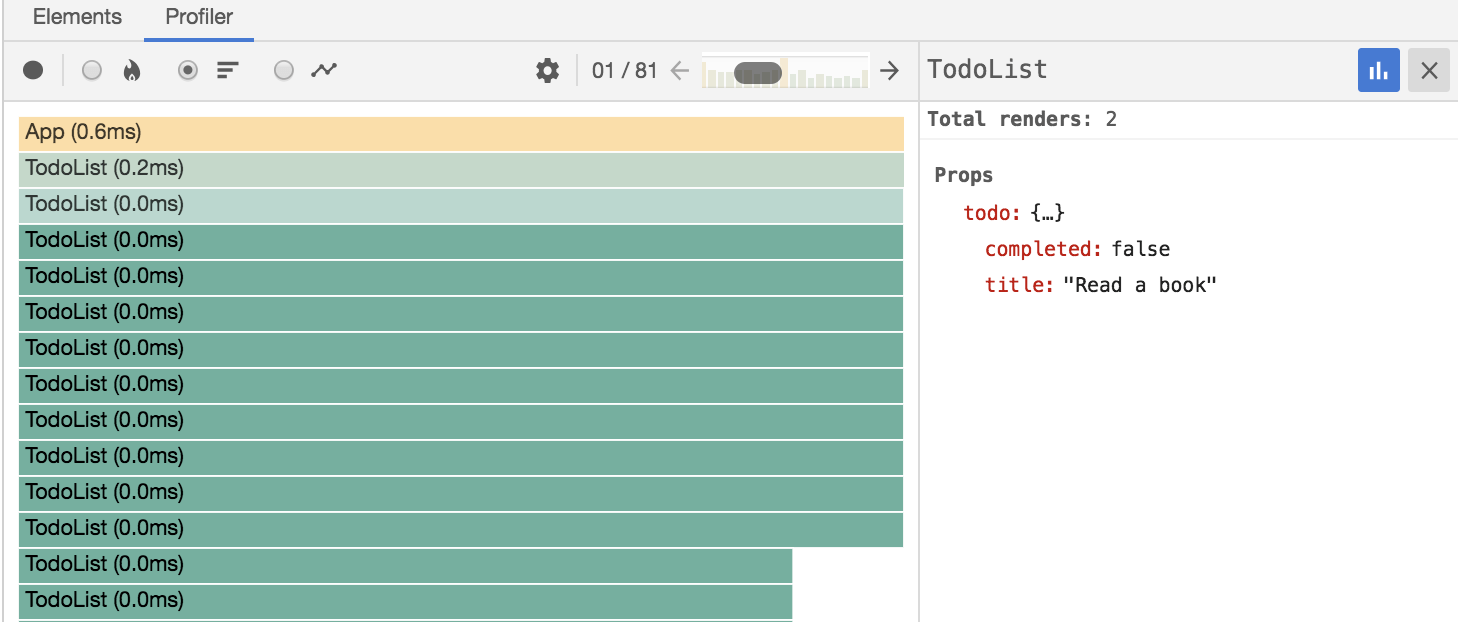
The ranked chart view displays each component in a single commit, ranked in order of how long they took to render. The components which took longer to render are at the top. To view this chart, click the ranked chart radio button in the top left corner of the Profiler tab. As with the flame chart, you can zoom in or out on a ranked chart by clicking on components:
Component Chart
The component chart provides information on the render cycle of a component while you were profiling. It displays this in form of a bar chart. Each bar represents a time when the component rendered. If the selected component did not render at all during the profiling session, a message is shown to indicate this.
To view this chart, either double-click on a component or select a component and click on the blue bar chart icon in the right detail pane. You can return to the previous chart by clicking the “x” button in the right detail pane:
Interaction Chart
The interaction chart is an experimental API that can trace the cause of an update and display it in the profiler tab.
Common Problems With React Profiler
- Having multiple roots in your application can lead to an error after profiling: No profiling data has been recorded for the selected root. If you encounter this error, try selecting a different root in the elements panel to view profiling information for that root.
- Sometimes a commit may be so fast that React Profiler does not get any meaningful information. In such cases you would get the following error: No timing data to display for the selected commit.
Conclusion
In this article, we’ve learned performance profiling for a React application using React Profiler. I hope you’ve learned something that will help you build more performant React apps.
For More on Building React Apps
Looking to learn more about React and get going with your React app development? Check out these resources to find out more:

Christian Nwamba
Chris Nwamba is a Senior Developer Advocate at AWS focusing on AWS Amplify. He is also a teacher with years of experience building products and communities.