
.NET 10 for .NET MAUI: Exploring the New Diagnostics and Metrics

Summarize with AI:
OK, MAUI devs, ICYMI here are the diagnostics and metrics tracking updates to .NET MAUI released with .NET 10 that you need to know!
The most important tool for making decisions is data: metrics, statistics and real numbers that tell you what you’re doing well and what you need to improve. Without them, you’re literally guessing.
Imagine going to the doctor for an eye exam and, when he arrives, he decides to give you a diagnosis without evaluating you, without tests, without anything.
Would you trust that result? Of course not. 🙆♀️
But if that same doctor sends you for tests, evaluates, compares and explains exactly what’s going on? Then you’d feel more confident, because you know there’s real data behind the diagnosis.
The same thing happens with our applications: you can’t optimize, improve or fix what you can’t observe. If you don’t have metrics that tell you how often a screen fails, how long it takes to display its elements or where time is being lost during the layout cycle, you’re working blindly.
Having clear metrics not only helps you as a developer detect issues faster, but it also allows you to provide a better service to your users, because you can anticipate problems even before your user or client notices something is wrong.
In this article, we’ll talk about the new comprehensive diagnostics and metrics tracking for .NET MAUI—incredibly useful for identifying performance issues and understanding what’s really happening inside the layout cycle.
First of All, A Quick .NET Aspire Review
Before diving into diagnostics, it’s important to understand, at a high level, what .NET Aspire provides, because it’s the environment where you’ll be able to see your saved diagnostic data.
It’s a new application model in the .NET ecosystem, and .NET MAUI for .NET 10 now includes a project template that creates a .NET Aspire service defaults project.
This project introduces extension methods that automatically wire up telemetry and service discovery in your app. In practice, this means:
- Telemetry enables your app to collect, measure and emit runtime data for monitoring and analysis.
- Service Discovery allows your app to locate and communicate with other services without relying on hardcoded URLs. Instead of pointing to fixed endpoints, your app connects using a service name.
Diagnostics
Microsoft added a full diagnostics and metrics system for .NET MAUI apps. Its main focus is monitoring layout performance—how views are measured and arranged on the screen—and it’s built on an extensible architecture that can easily support future observability features.
Basically, the core diagnostic infrastructure includes these three main points:
ActivitySource: “Microsoft.Maui”
This is responsible for emitting activities (traces) when .NET MAUI performs layout operations. Thanks to this, we can know things like:
- When a
Measure()orArrange()operation starts and ends - How long each operation takes
- Which view triggered it
In summary, ActivitySource records every step of the layout process with detailed timing information.
⚠️ As important context:
- Measure is the process where .NET MAUI calculates and determines how much space a view needs.
- Arrange, which happens after Measure, is where .NET MAUI positions the view on the screen with its final size and location.
Metrics: “Microsoft.Maui”
Through a meter (a component of the .NET metrics system), this exposes metrics in different formats, such as:
- Counters: To identify how many times an event occurs
- Histograms: To measure how long an operation takes or how its values are distributed
Basically, metrics are responsible for providing the raw numbers needed to analyze performance.
Feature Switch: Meter.IsSupported
This allows metrics to be enabled or disabled at runtime for AOT/trimming. In other words, it works like a switch that lets you turn your metrics collection system on or off depending on your needs.
Layout Performance Tracking
Basically, this is where the most important UI operations—Measure() and Arrange()— are instrumented. In simple terms, it takes care of:
Instrumenting IView.Measure() and IView.Arrange()
This means that .NET MAUI now injects internal measurements into these methods—as explained earlier.
When we talk about “instrumenting,” we mean adding metrics, logs, or traces inside the code so we can measure, monitor, diagnose or analyze how these operations behave.
Tracks Timing, Counts and Detailed Context
It records how long each Measure() and Arrange() operation takes and how many times they were executed, and—most importantly—adds rich tags and context such as which screen it happened on, which layout triggered it and which view was involved. This gives you much more precision when diagnosing and resolving issues.
Zero-Allocation Instrumentation for Optimal Performance
This means that all the instrumentation added to track Measure() and Arrange() is implemented using structs and a using pattern, so it generates zero heap allocations. In simple terms, the diagnostics system doesn’t create extra garbage or slow down your app while measuring performance. It records everything efficiently without impacting the UI’s responsiveness.
📊 Metrics Collected
All the concepts explained above are ultimately exposed through a set of specific metrics:
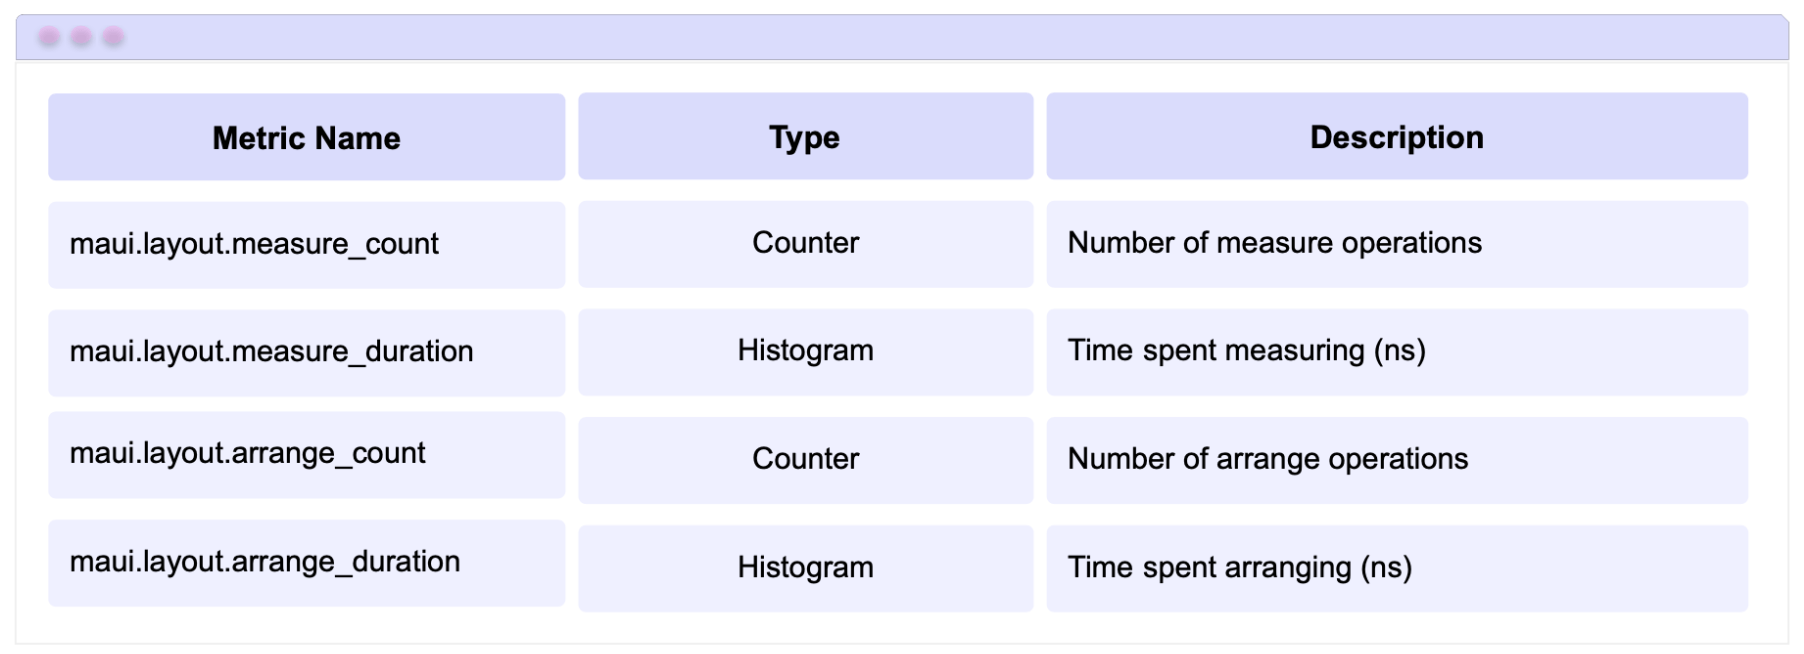
Data from the official documentation.
🏷️ Diagnostic Tags
Diagnostic Tags are labels automatically added by .NET MAUI to metrics and traces. Their purpose is to provide additional context about the view responsible for executing a Measure() or Arrange() operation.
In simple terms, these tags tell you which control triggered the operation, where it was located and its size.
The available tags are:
All Views
These apply to any view in .NET MAUI.
Tag: element.type — Full type name
Represents the full type name of the visual element that triggered the operation.
For example:
- Microsoft.Maui.Controls.Button
- Microsoft.Maui.Controls.Label
This tag helps you identify whether a specific control is causing multiple Measure() or Arrange() calls.
Controls (Element / VisualElement)
These tags are added to all controls that inherit from Element or VisualElement. They include:
- element.id: Internal ID assigned by MAUI
- element.automation_id: A custom ID defined by you (optional), commonly used for testing and accessibility
- element.class_id: The control’s ClassId
- element.style_id: Internal ID associated with applied styles
- element.class: Describes the visual characteristics of the control; helps you understand what style, template or visual category it had at the time
- element.frame: Represents the final position and size of the control on the screen (for example: x=0, y=34, width=260, height=55)
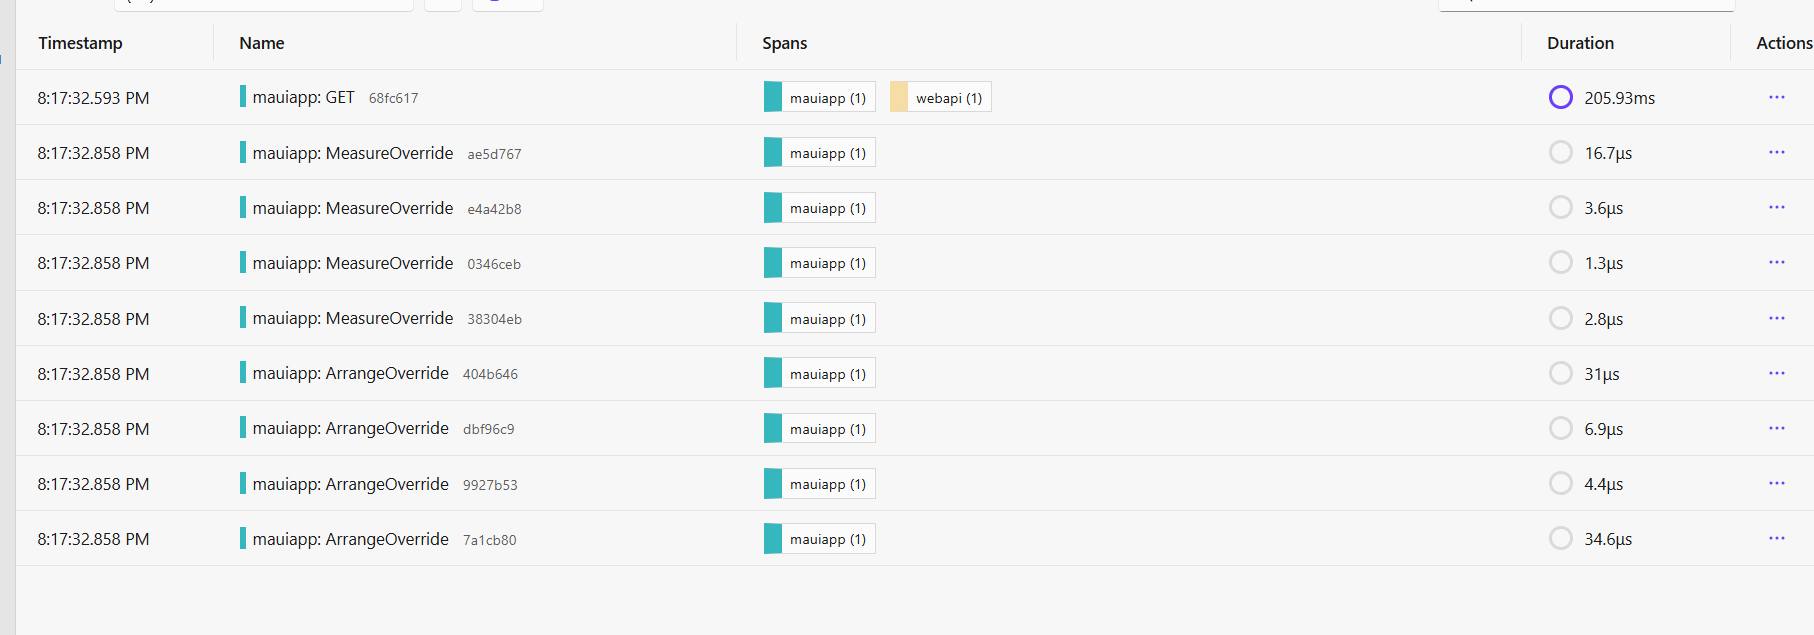
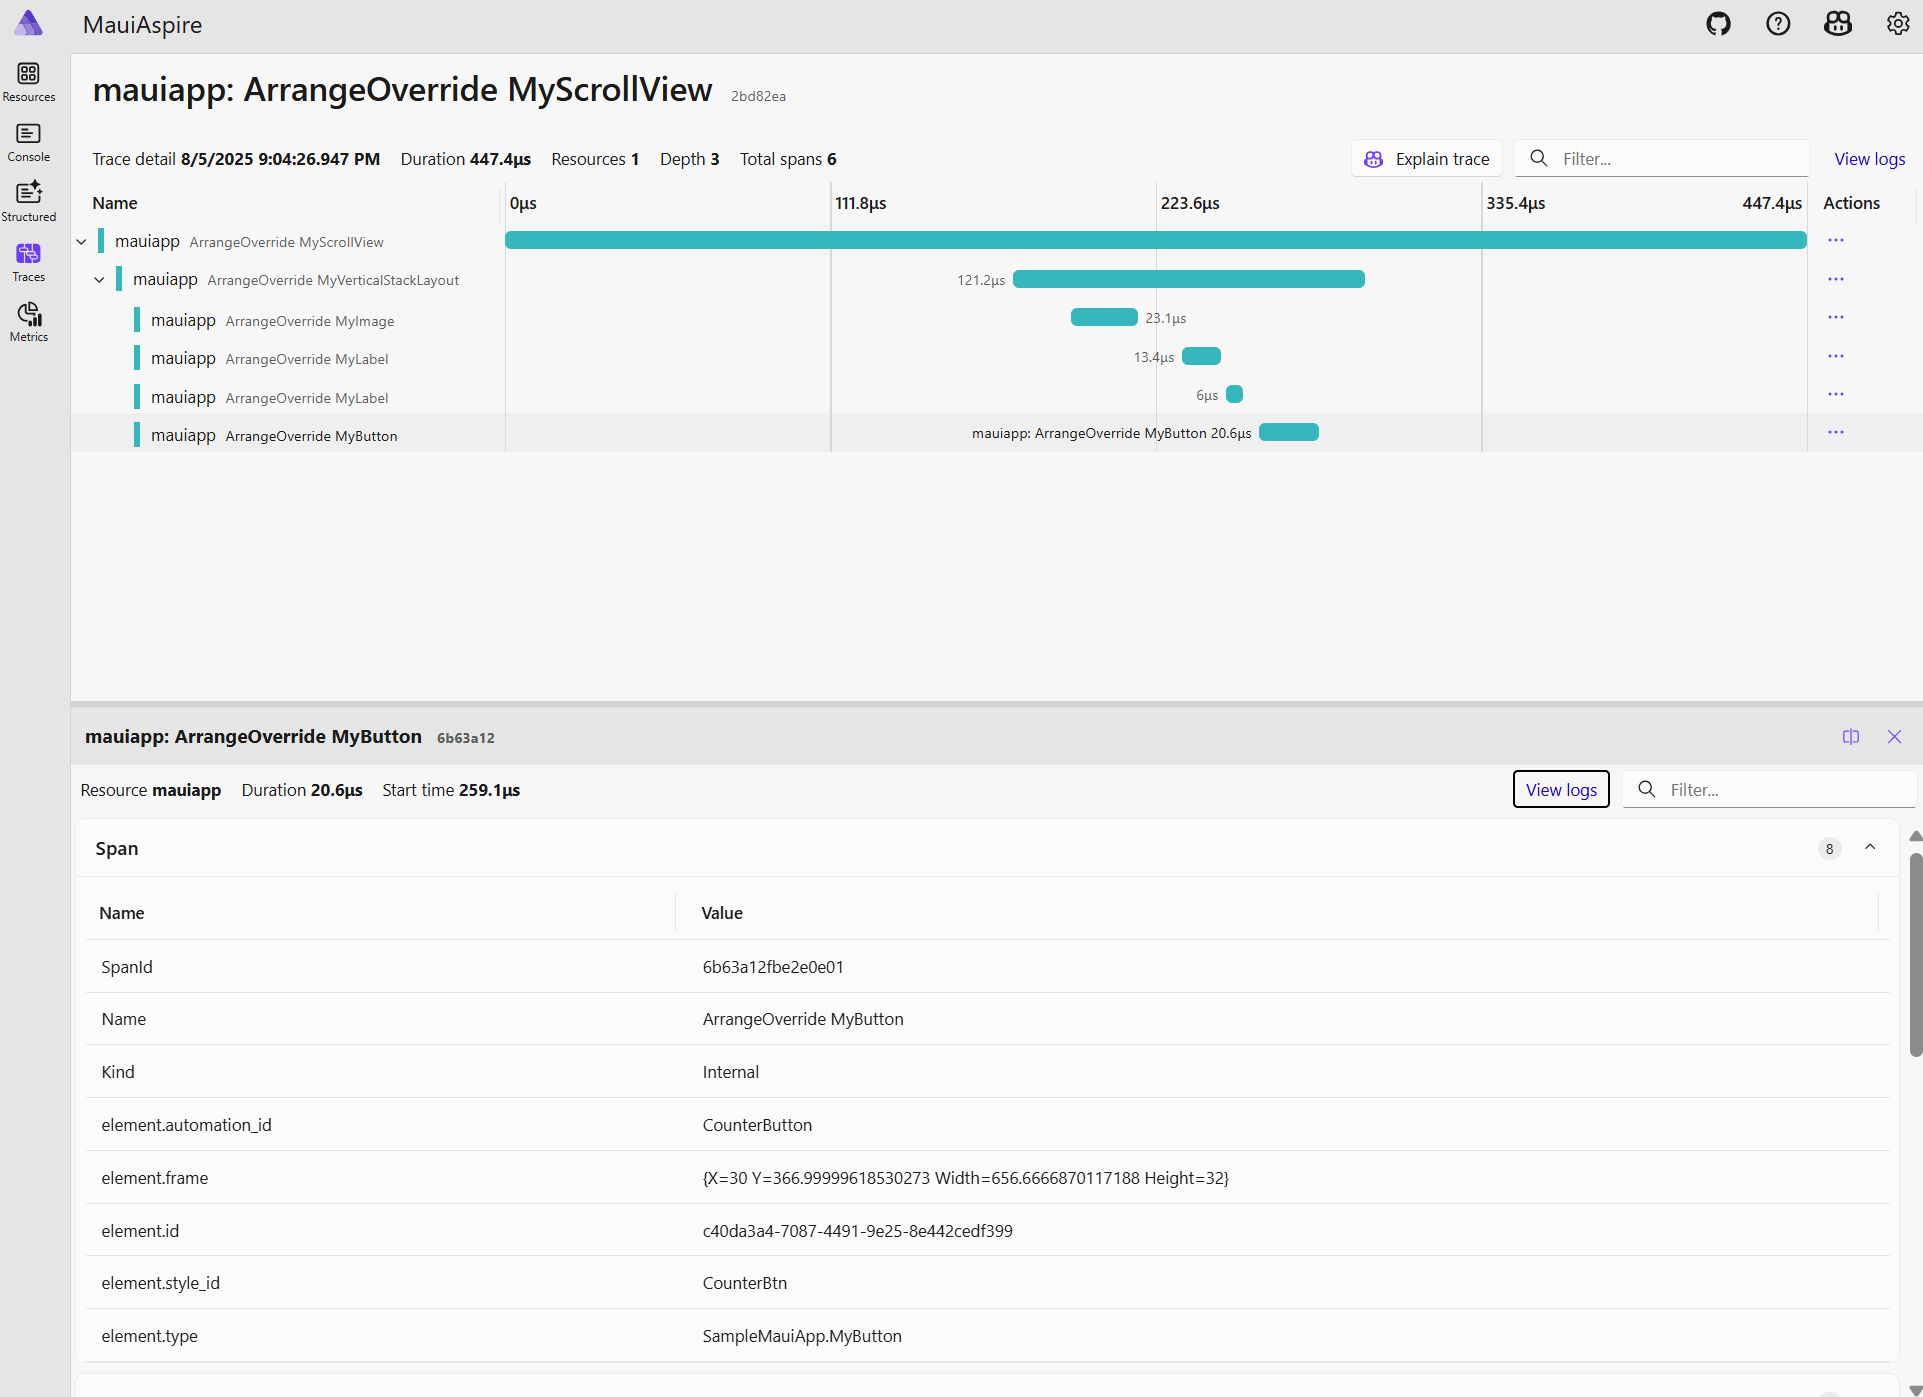
Where Can You Find These Metrics?
Remember at the beginning of the article when we talked about .NET Aspire?
Well, that’s exactly where you can view all these metrics.
Below, I’ve included images from the official documentation so you can visualize how this looks in practice.
✍️ If you want to dive deeper into the topic, I recommend checking out the pull request for “[v3] Add Diagnostics Metrics Tracking to MAUI Applications”.
Conclusion
And that’s it! 🎉 In this article, you explored how the new diagnostics system in .NET 10 enhances observability in .NET MAUI apps. You learned what each component does, how layout operations are instrumented, and how metrics are exposed so you can better understand your app’s performance.
Now you have the tools to make diagnostics your ally—helping you detect issues faster, optimize your UI more confidently and build apps that are both smoother and easier to maintain.
If you have any questions or want me to cover more related topics, feel free to leave a comment—I’d be happy to help you! 💚
See you in the next article! 🙋♀️✨
References
The explanation was based on the official documentation:

Leomaris Reyes
Leomaris Reyes is a software engineer from the Dominican Republic specializing in mobile development. She is a 7-time Microsoft MVP and actively builds mobile applications while sharing practical knowledge through technical articles and developer-focused content.
Through her work, she explains programming concepts, developer tools and real-world development practices to help developers grow in their careers.
You can follow her on Instagram and TikTok at @leomarisreyes.dev, read her articles on AskXammy, and connect with her on LinkedIn, where she shares tutorials, insights and resources for developers.
Related Posts
Comments
All articles
Topics
Web MobileMobile
Desktop
Design
Productivity
People
