How to Use the DevTools Network Filter Effectively

In this post we’ll go over the Network filter feature of Chrome DevTools to show you how to use it effectively in various use cases.
Before we get into all the details, let’s take a moment to understand what Chrome DevTools is all about. Chrome DevTools is a set of web developer tools built directly into Google Chrome, to help developers diagnose problems on the go and build satisfactory websites, faster. Using DevTools makes it easy to view and manipulate pages on the browser by inspecting their elements and changing the CSS and HTML values.
Opening DevTools
There are a few steps to take when opening DevTools on Google Chrome, as we would see below, and you are welcome to use any of them:
- Keyboard Shortcuts:
Command + Control + Con Mac.Control + Shift + Con Windows and Linux.
-
Chrome Main Menu
- Click on the Chrome main menu.
- Select on
More Tools. - Select
Developer Tools.
-
Inspect the page.
- Right-click anywhere on the browser and select Inspect.
DevTools is comprised of so many panels, tabs and features. However, in this post, we’ll focus more attention on the DevTools Network panel, and specifically on the Filter tool. Since we now have a fair understanding of DevTools and how to open it in Chrome, let’s get into the Network filter tool.
The Filter Tool
The filter tool is used to narrow down the resources in the browser to what the developer needs at that moment. It is responsible for filtering HTTP requests that are being inspected on the browser. It can also be used to check parameters sent through an Ajax request. Ajax requests are asynchronous requests initiated by the browser that do not result directly in a page transition.
- Note: The
Consolepanel also has a filter tool. Do not mistake one for the other, since they serve different purposes.*
Open Filter Tool
The filter tool is located inside the Network panel in DevTools. With our keyboard shortcuts, DevTools will open directly into the Elements tab. In that case, we’ll switch to the Network tab, where we’ll have access to the filter tool like so:
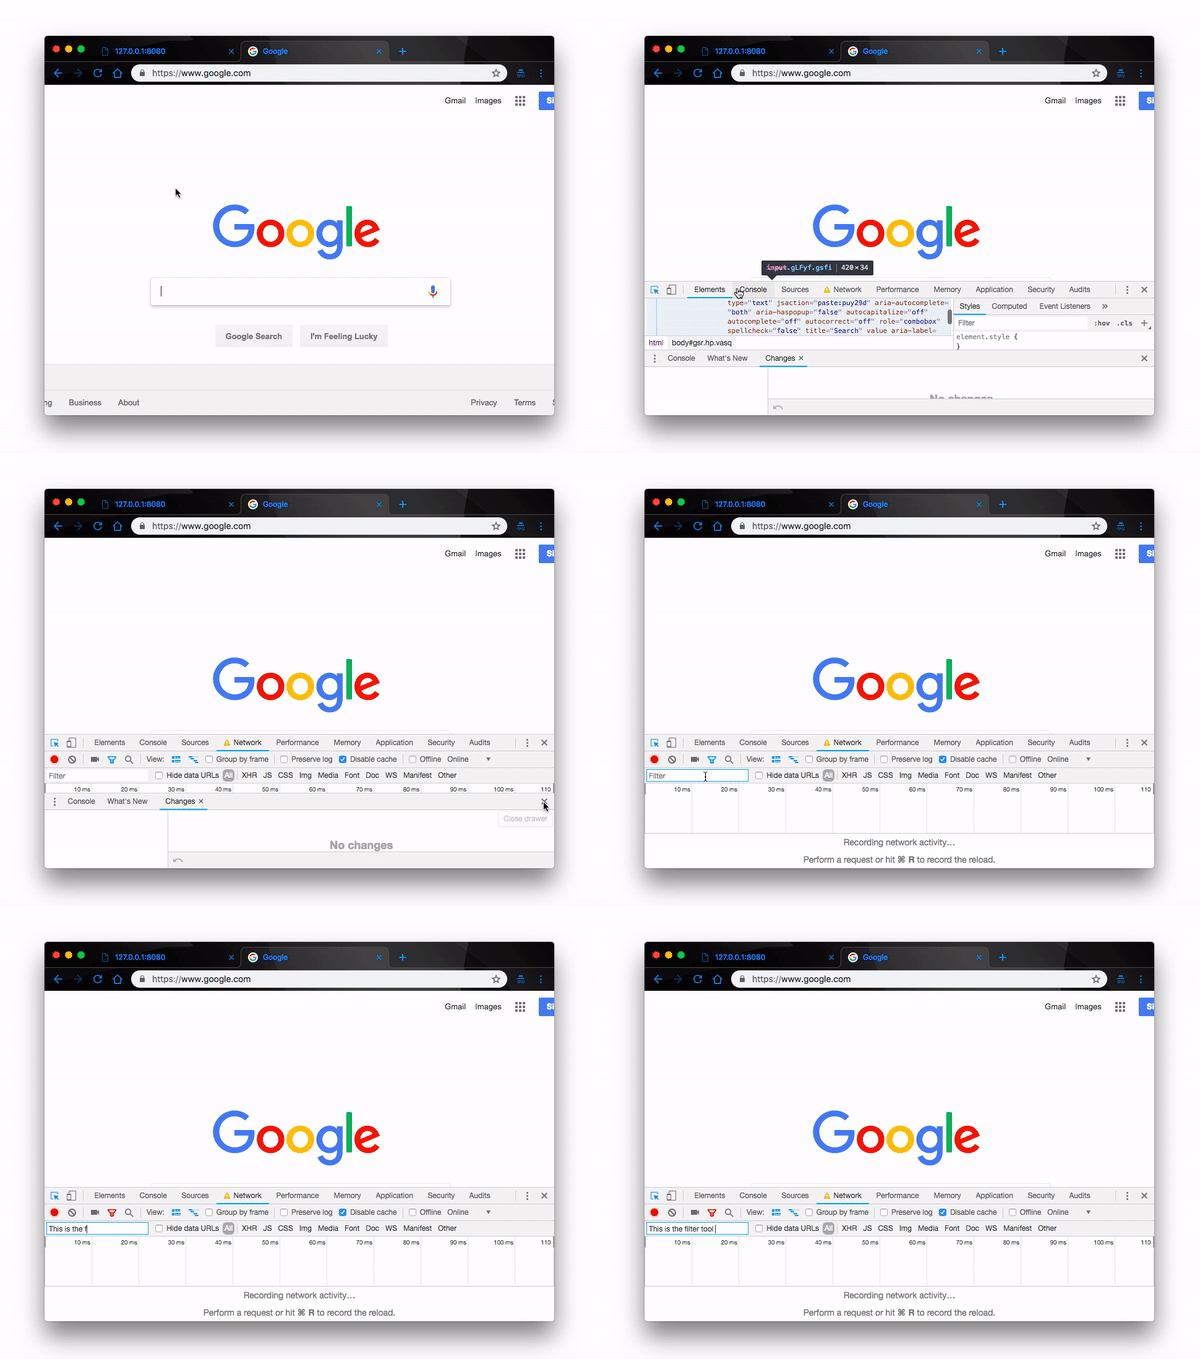
Filtering HTTP Requests with the Filter Tool
HTTP requests are generated by the activities that happen on the browser. These requests are sent to a web server which returns a resource. When these requests are received, the Filter tool helps developers to search for specific parameters. It also helps to restrict which requests you are inspecting so you do not get overburdened.
For instance, with the filter tool, you could search for XHR, or Media, or WS, or specify the exact parameter you want by typing it out. That way, it restricts other parameters and only shows you what you need at that moment. It makes working on the project less stressful, and you get to work faster too. Also, when you’re filtering and not getting the expected result, make sure that the request type quick selector is on All. As the name implies, it shows all the types.
1. Filtering Requests by Types
To check for an Ajax call to verify the variables being sent, you would have to find the call in the Network tab, and check the query string parameters in the Header. But then tracking the Ajax call in the Network tab is stressful. That is where the Filter tool comes in. With the filter tool, you can simply filter by type. For instance, you can filter for XHR, JS, IMG like so:
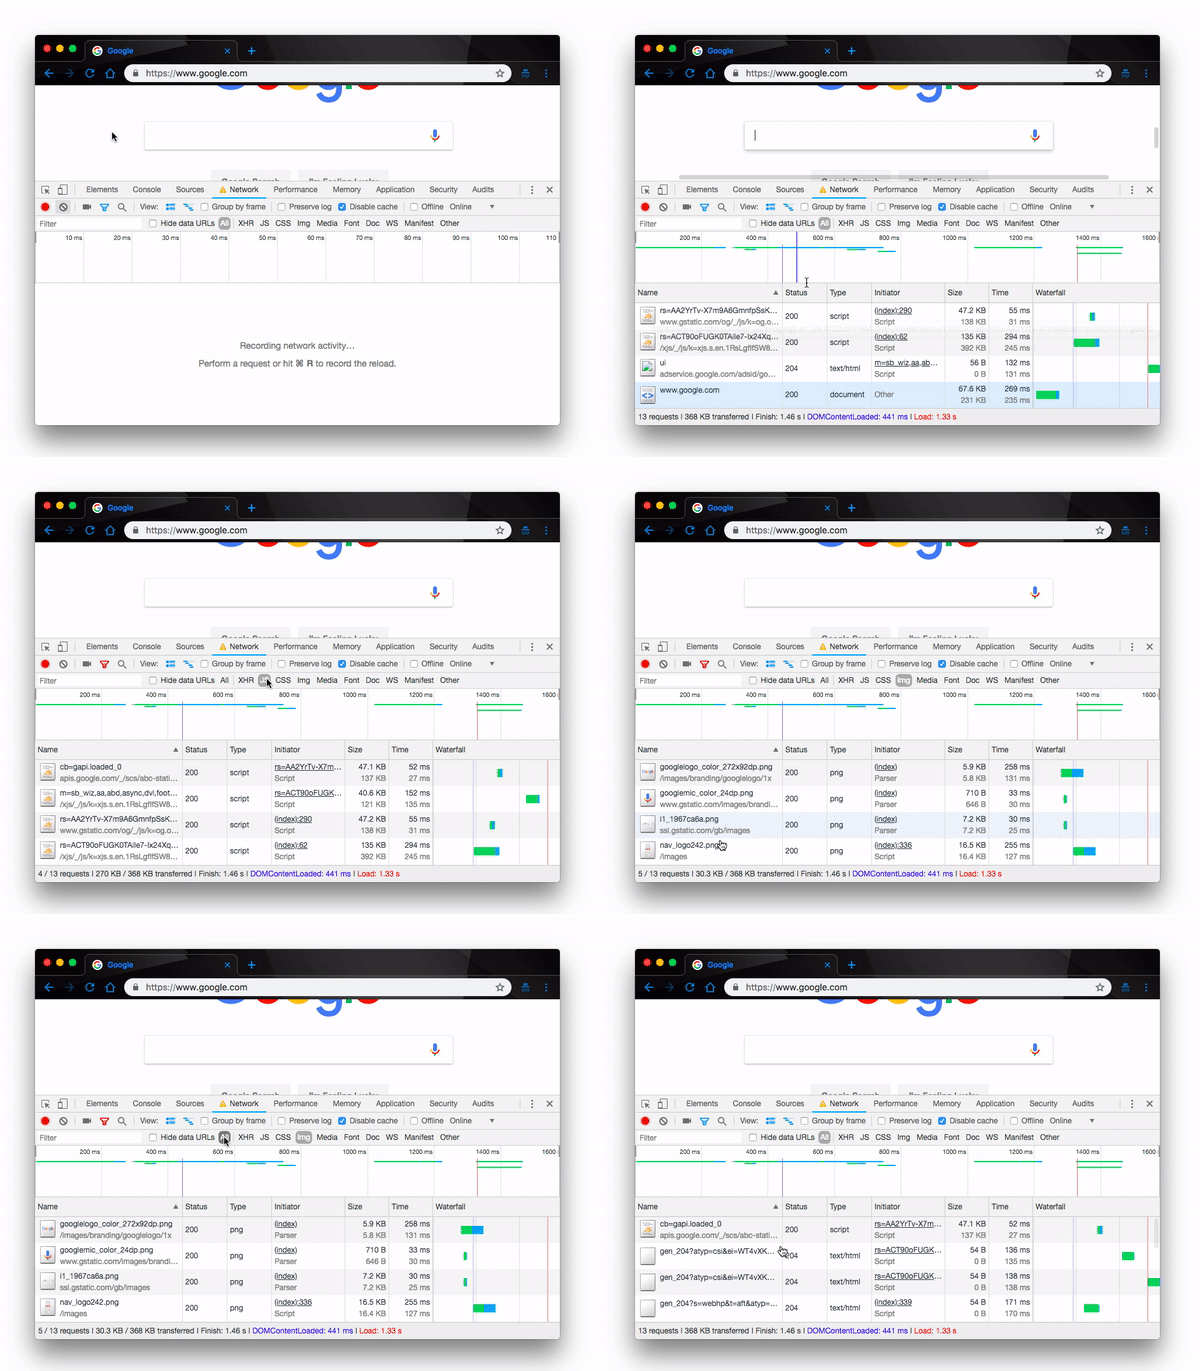
In addition, you can also filter the network activity with the contents of server’s URL by typing it in the Filter tool, and having it search automatically.
2. Filtering by Domains and Status Codes
You can filter on things like domain, status code, response header, etc. Inside the filter tool search pane, type in the domain or status code to see their values as applied on the web page you’re currently on.
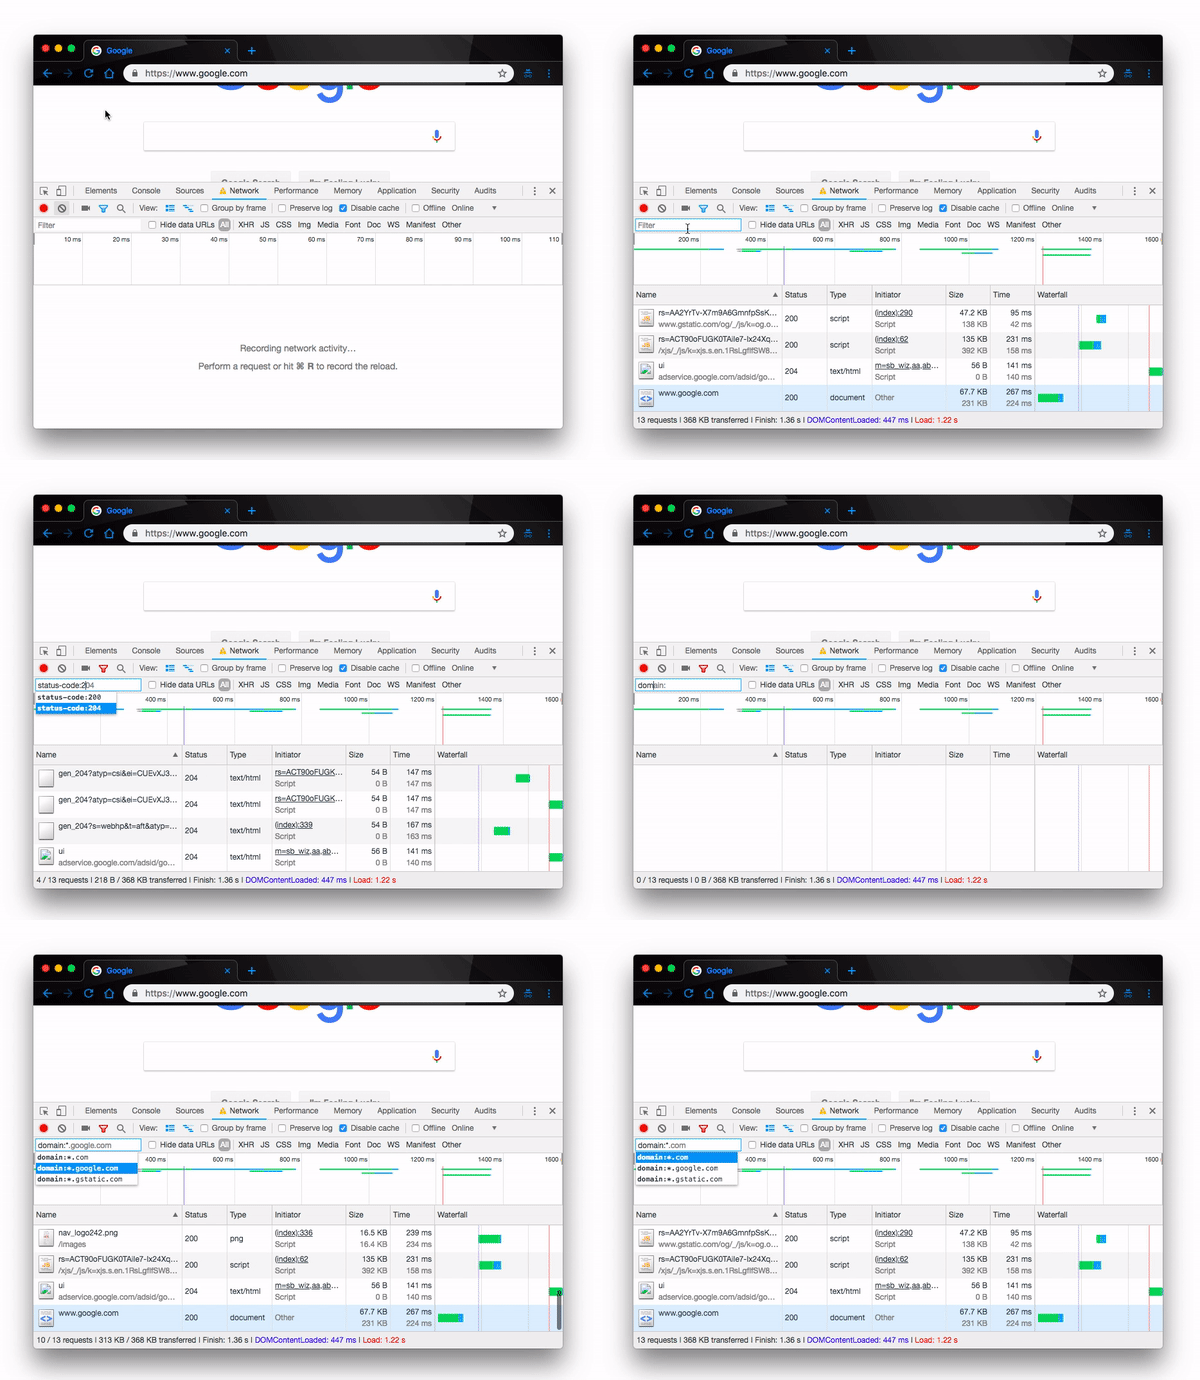
3. Filtering by File Size
In addition to status codes and domains, the network filter tool gives us the ability to filter requests by file sizes using the larger-than keyword. Setting the value of the larger-than keyword to a certain number will list all the request files that are lower than the specified file size like so:
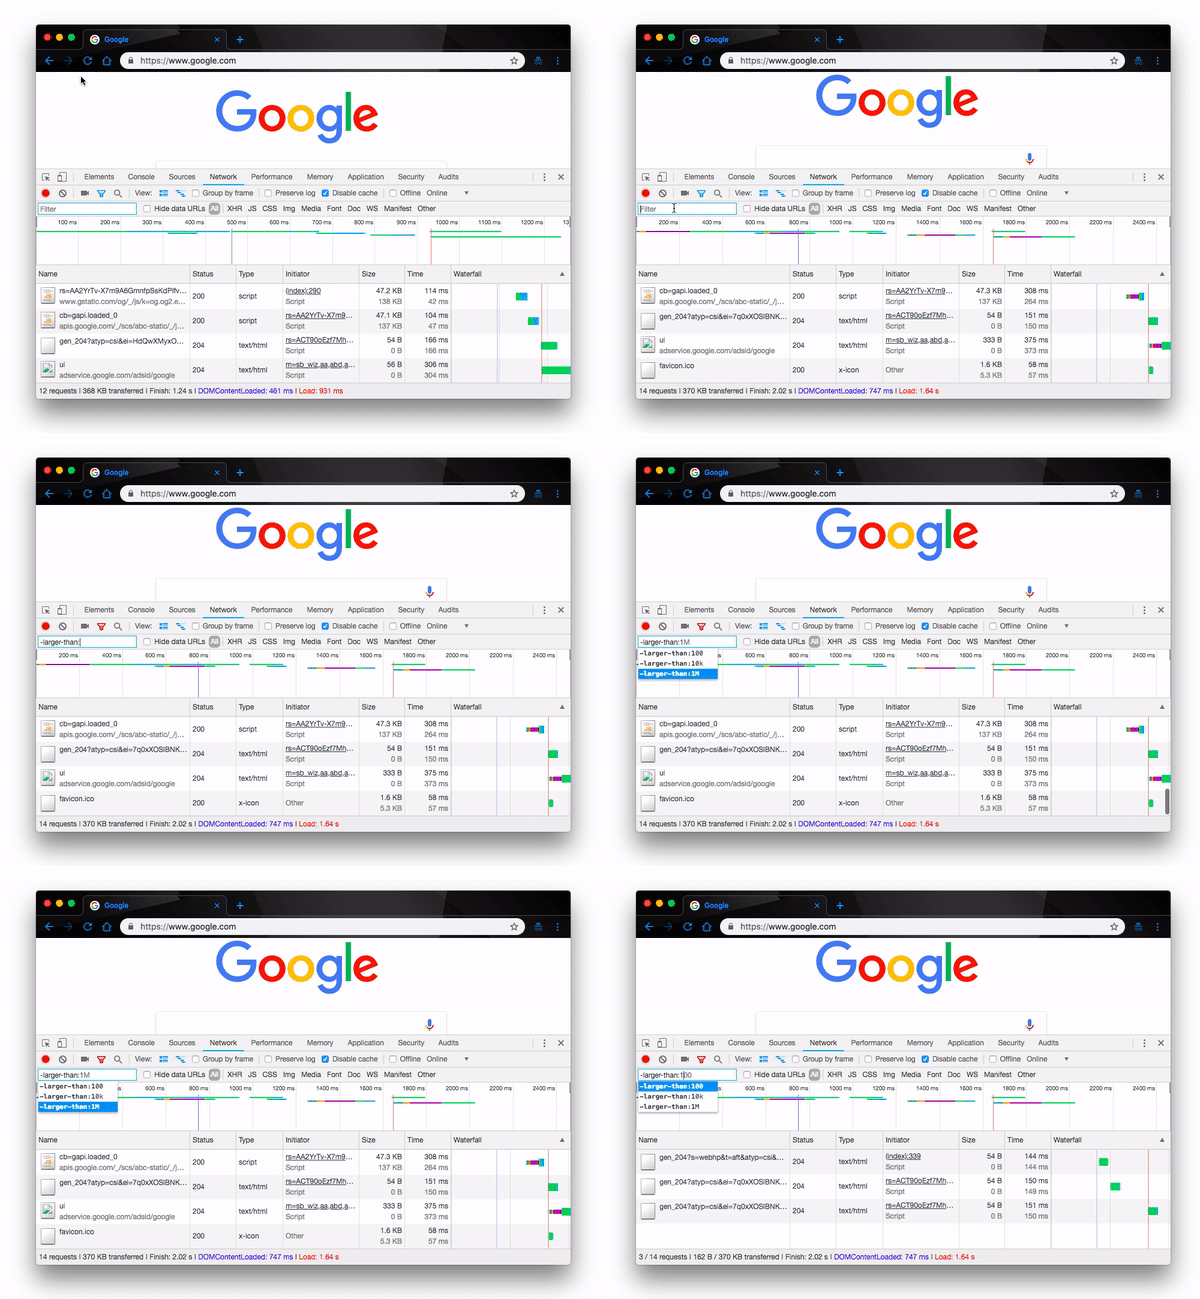
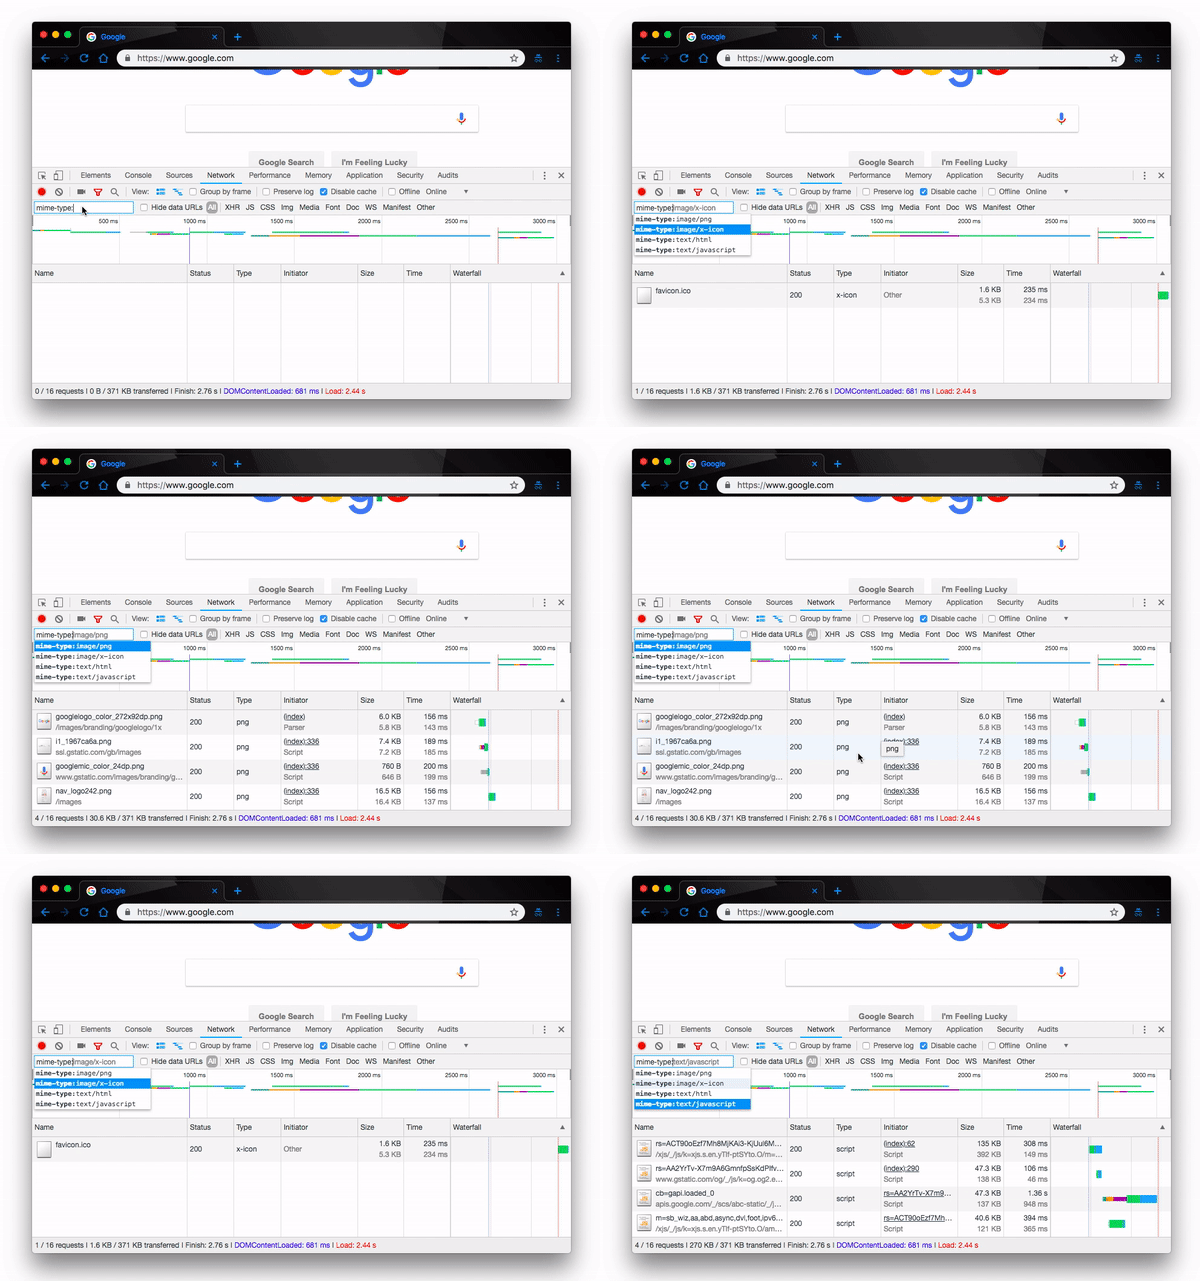
4. Filtering by Mime Type
The filter tool also lets us filter requests by mime type. This helps developers filter through the HTTP request and display tables containing data of the selected mime types. Depending on the web page you’re on, the available mime-types can range from png, jpeg, x-icon, etc.:
5. Filtering by Request Methods
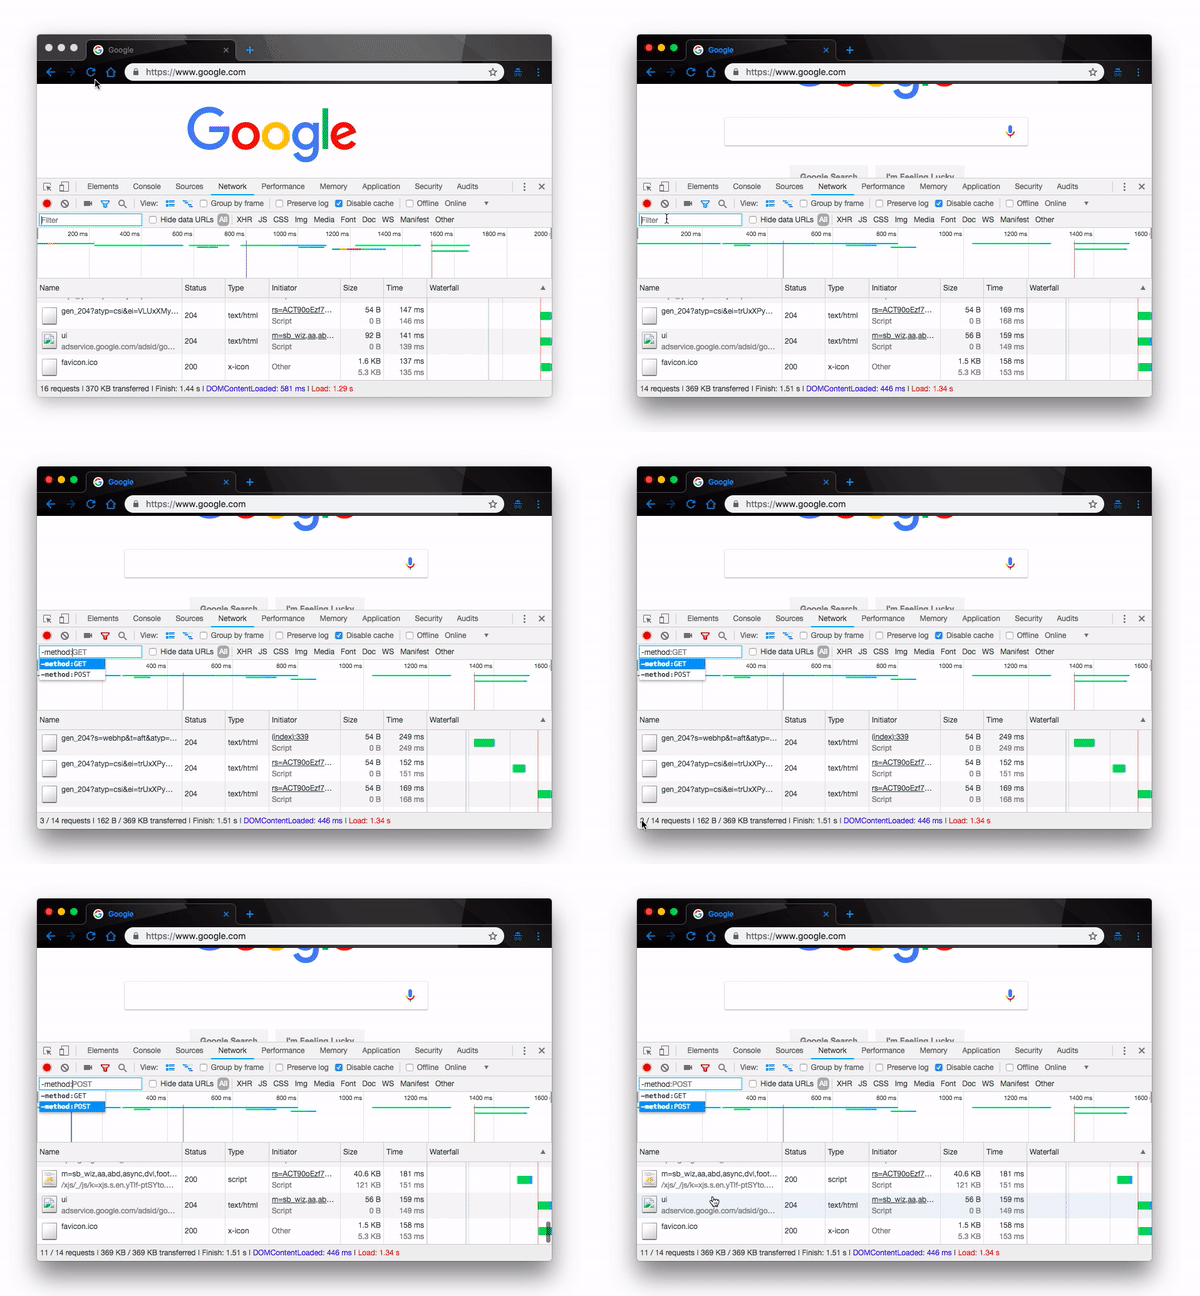
We can use the available request methods to filter through our request table. Usually we have the GET and POST request methods available on our pages. However, in more advanced web pages, we can have as many as five request methods. We can leverage the filter tool feature to determine and explore these methods like so:
Conclusion
In this post, we have defined the Filter tool in the Network panel of the Chrome DevTools. We have also reviewed the uses cases with demonstrative examples to help you understand how to use the tool effectively. There’s so much we can do with DevTools and the Network panel. You can read more about the Network panel on the Chrome DevTools official documentation.
For More Info on Building Great Web Apps
Want to learn more about creating great user interfaces? Check out Kendo UI - our complete UI component library that allows you to quickly build high-quality, responsive apps. It includes all the components you’ll need, from grids and charts to schedulers and dials.

Christian Nwamba
Chris Nwamba is a Senior Developer Advocate at AWS focusing on AWS Amplify. He is also a teacher with years of experience building products and communities.
