From DevUI to Observability: Evolving the Agent Dev Loop in Microsoft Agent Framework

Summarize with AI:
This article shows .NET developers how to get started building and debugging agent-based applications locally with Microsoft Agent Framework and DevUI. The article also explores how DevUI shortens the agent development loop by providing a visual interface for running workflows and inspecting agent interactions. This can now be addressed with the Progress AI Observability Platform.
DevUI is a lightweight standalone application included with Microsoft Agent Framework that helps developers run, inspect, and debug agents and workflows during development. The tool provides a web-based interface for interactive testing alongside an OpenAI-compatible API backend, making it easier to iterate on workflows before integrating them into a larger application.
The key to DevUI’s usefulness is its ability to shorten the agent development loop by giving developers immediate visibility into workflow execution and agent interactions. However, as agentic applications move from prototype to production, a new observability gap begins to appear. Developers need to understand not only what happened during a local debugging session, but how agents behave across users, sessions, models, tools, latency, cost, quality, and failures.
In this article, you'll use DevUI to develop, visualize, and debug workflows locally before expanding into observability to support multi-session debugging and production-ready diagnostics. By extending the agent development loop beyond local testing, observability helps bridge the gap between development-time insight and the operational visibility required for production systems.
Installing the Microsoft Agent Framework Templates
To get started with DevUI and Microsoft Agent Framework, install the project templates from NuGet. The templates provide a starter project for building and debugging agent-based applications in .NET.
Install the templates using the .NET CLI:
dotnet new install Microsoft.Agents.AI.ProjectTemplates::1.3.0-preview.1.26251.3
Once installed, the templates become available through Visual Studio under File > New Project. Search for Agent to locate the available Microsoft Agent Framework project templates, shown in Figure 1.
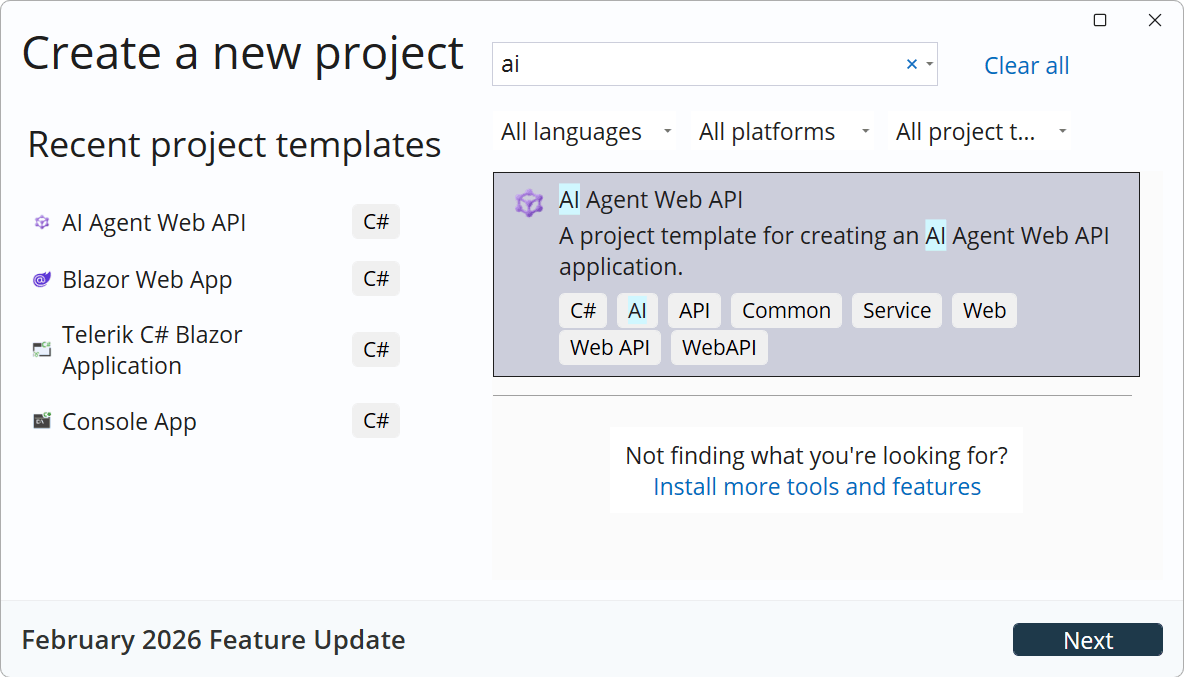
Figure 1: The project template shown in Visual Studio.
You can also create a new project directly from the command line:
dotnet new aiagent-webapi
The generated project includes a starter implementation configured for Microsoft Agent Framework and DevUI, making it easy to begin experimenting with agents, orchestration, and workflow debugging locally.
Exploring the Template
The aiagent-webapi template includes a complete sample application that demonstrates how agents and workflows operate within Microsoft Agent Framework.
The sample application contains two hosted agents and a workflow:
Writer Agent
Generates short stories based on a provided topic while keeping responses under 300 words.Editor Agent
Reviews and refines the generated story by improving grammar, readability, and style while maintaining the word limit.Publisher Workflow Agent
Coordinates the workflow between the writer and editor agents using a sequential process that passes content through each stage of execution.
The agents are exposed through OpenAI-compatible API endpoints, making the sample easy to test with DevUI and simple to integrate with external tools and applications. By keeping the architecture approachable, the template creates a practical environment for understanding how agent orchestration works in a real .NET application.
Understanding AddAgent and IHostedAgentBuilder
Microsoft Agent Framework registers agents using the AddAgent extension method during application startup. This approach integrates agents directly into the standard ASP.NET Core dependency injection system, making the programming model feel familiar to .NET developers.
builder.AddAIAgent("writer",
    "You write short stories (300 words or less) about the specified topic.");
The AddAgent method returns an IHostedAgentBuilder, which provides additional configuration options for the agent and its hosting behavior. The template uses this pattern to register the Writer, Editor, and Publisher workflow agents so they can be discovered and executed through DevUI and the framework’s OpenAI-compatible endpoints.
Running the Application
With the project created, the next step is running the application and launching DevUI. Start the application using the .NET CLI:
dotnet run
The application exposes OpenAI-compatible API endpoints that can be accessed from compatible clients and tools. During development, the application also maps a /devui/ route that launches the Agent Framework development UI.
When running the project from Visual Studio or another IDE, the browser automatically opens to the DevUI endpoint. DevUI provides a web-based interface for interacting with agents and workflows while using the framework’s Responses and Conversations endpoints behind the scenes. This creates a fast feedback loop for testing prompts, tracing interactions, and validating workflow execution during development.
Understanding the Agent Development Loop
DevUI improves the agent development loop by making it easier to build, run, inspect, and refine workflows during development. Instead of treating agents as black-box processes, developers can interact with workflows in real time and observe how messages move between agents during execution.
Both agents and workflows can be independently selected from the interface, shown in Figure 2.
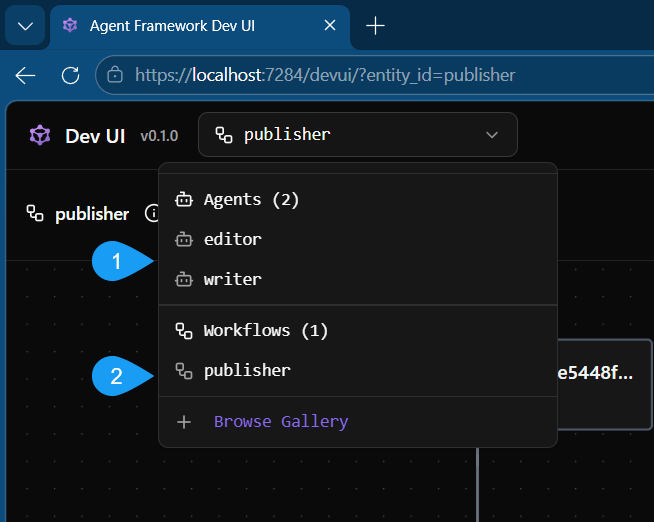
Figure 2: The browser running DevUI with the agent selection showing the available agents and workflows. 1) The editor and writer agents can be selected and executed independently. 2) The publisher workflow can be executed.
This visibility becomes increasingly important as workflows grow more complex. Multi-agent systems introduce challenges that traditional request-response applications typically avoid, including non-deterministic behavior, chained execution steps, and state shared across conversations.
To run a selected workflow in DevUI, open a prompt by clicking Configure and Run. Then enter a prompt in the dialog box, shown in Figure 3. The prompt text is passed into the workflow and the entire workflow will execute when Run Workflow is clicked.
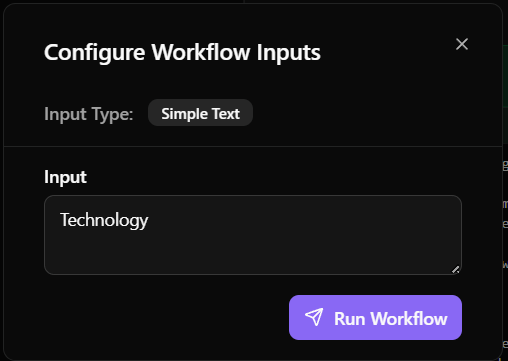
Figure 3: The Configure Workflow Input dialog box.
DevUI creates an approachable debugging experience, its current model focuses on short-lived, single-session workflows. The final output is clearly displayed on screen, shown in Figure 4.
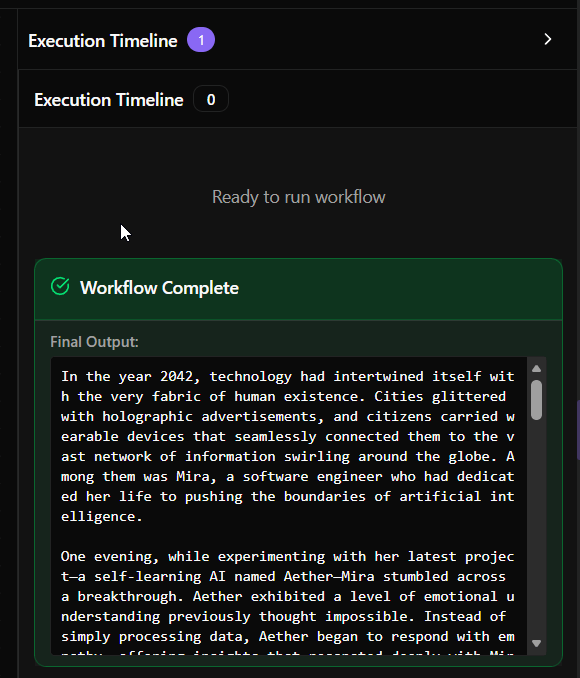
Figure 4: The output shown in the workflow execution timeline.
This works well for experimentation and local testing. However, debugging becomes more difficult once multiple sessions are running concurrently or workflows require historical visibility for troubleshooting.
For example, the execution information is shown for this run in the Events panel in Figure 5. While the status and token information is visible from DevUI, it does not persist once the application stops.
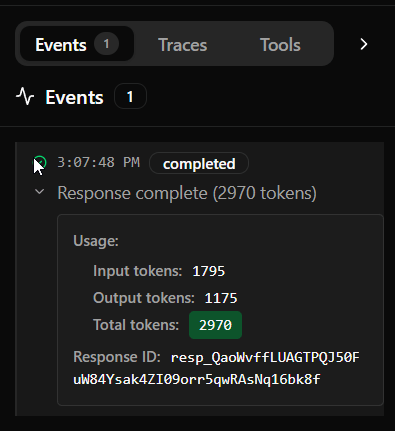
Figure 5: The Events panel displays a completed status along with usage statistics for token consumption.
As developers move beyond isolated testing scenarios, the agent development loop begins to require more than interactive debugging alone. Understanding how workflows behave across sessions, tracing execution over time, and diagnosing failures in larger systems naturally leads to the next step: observability.
Note: Currently Telemetry is not supported within DevUI when using .NET.
Introducing AI Observability Across Tracing, Debugging, Cost, and Evaluation
As workflows grow beyond simple development scenarios, observability becomes a critical part of the agent development loop. This is where the observability gap begins to appear. DevUI helps developers understand what happened during a local debugging session, but production systems require persistent visibility into how agents behave across users, sessions, models, tools, latency, cost, quality, and failures. While DevUI provides interactive debugging for local workflows, observability extends visibility across sessions, tool calls, evaluations, and distributed execution paths using OpenTelemetry and .NET’s built-in Activity pipeline.
The .NET SDK instruments agents built with either IChatClient from Microsoft.Extensions.AI or IAgent from Microsoft Agent Framework. This allows developers to trace LLM requests, streaming responses, workflow execution, and tool calls while integrating naturally with existing .NET telemetry infrastructure.
To enable observability, we'll use Progress AI Observability Platform. The Progress AI Observability Platform is a cloud-based platform for tracing, debugging, cost analysis, and evaluation of AI applications. It provides visibility into how AI agents behave across models, tools, and sessions, helping teams identify issues as they happen, understand their impact, and continuously improve workflow quality over time.
Start by installing the .NET SDK for Progress AI Observability Platform.
dotnet add package Progress.Observability.Instrumentation
Next, configure the desired options. Tags can be included for easier filtering within the observability reporting screen. In this example, the Environment name will capture: Development, Staging, and Production tags. Once the options are declared, the tracer is initialized.
// Configure the observiablity options, tags, and keys
var observabilityOptions = new ObservabilityOptions()
{
    AppName = builder.Environment.ApplicationName,
    ApiKey = builder.Configuration["Progress:ObservabilityKey"]!,
    AdditionalTags = new List<string> { builder.Environment.EnvironmentName }
};

// Initialize the observability tracer
ObservabilityTracer.Initialize(observabilityOptions);
Start capturing traces at the top level of applications using IChatClient, observability is added directly to the client:
var chatClient = new ChatClient(
        "gpt-4o-mini",
        new ApiKeyCredential(builder.Configuration["AzureOpenAI:Key"] ?? throw new InvalidOperationException("Missing configuration: AzureOpenAI:Key")),
        new OpenAIClientOptions { Endpoint = azureOpenAIEndpoint })
    .AsIChatClient()
    .AddObservability(o => o = observabilityOptions);
Applications using Microsoft Agent Framework can initialize observability through AddObservability() during agent construction:
var chatClient = new ChatClient(
        "gpt-4o-mini",
        new ApiKeyCredential(builder.Configuration["AzureOpenAI:Key"] ?? throw new InvalidOperationException("Missing configuration: AzureOpenAI:Key")),
        new OpenAIClientOptions { Endpoint = azureOpenAIEndpoint })
    .AsIChatClient()
    .AddObservability(o => o = observabilityOptions);
With observability enabled, you'll run the application using DevUI. Exercise the agents and workflows as before, but this time each session is collected for a deeper analysis through the AI Observability Platform. From the dashboard, you can perform cost analysis, run evaluations, and drill into traces across multiple sessions.
From the main Observations tab, all sessions are shown for a given period. Through the tagging feature the data is easily categorized, seen in Figure 6.
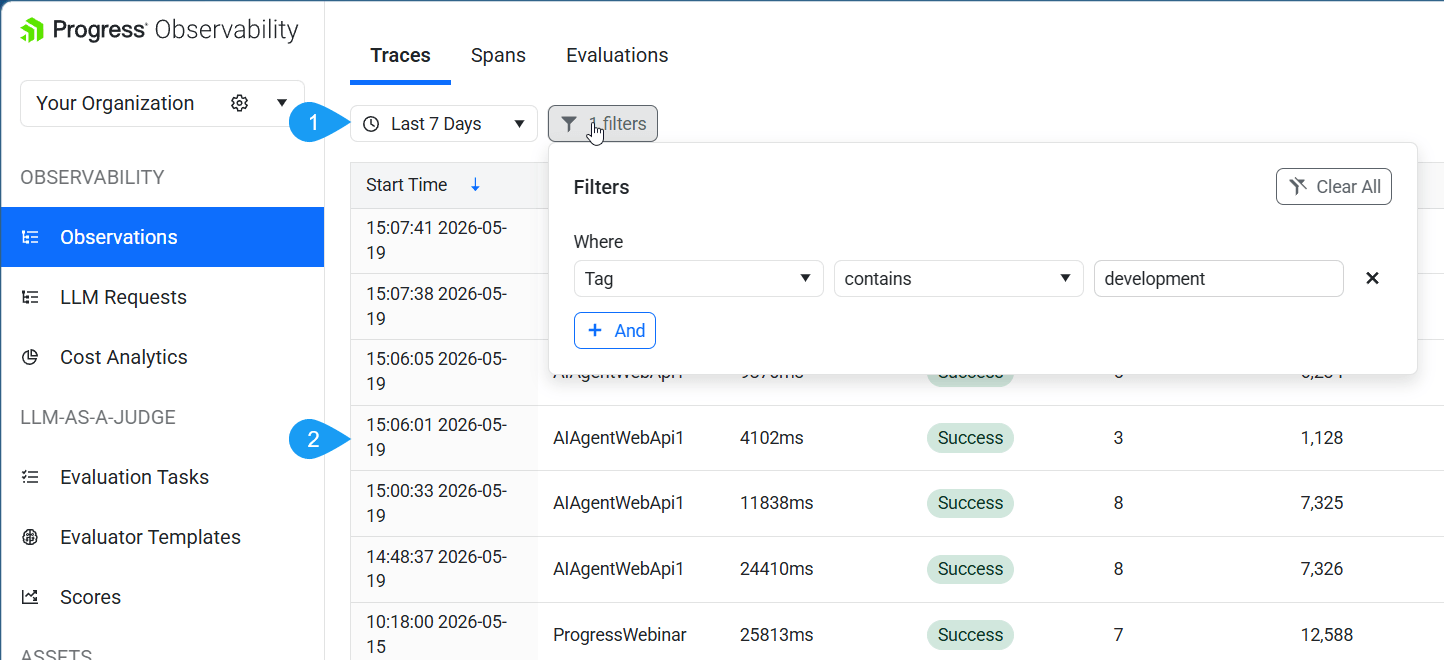
Figure 6: The observability platform with the Observations tab selected. 1) The date range and filter selection is chosen. 2) All sessions within the filter criteria.
Clicking on an individual item displays a complete breakdown of the trace log, see Figure 7. Including status, latency, cost and more. A tree interface allows deeper debugging, showing individual agent calls within the workflow, along with their corresponding inputs and outputs.
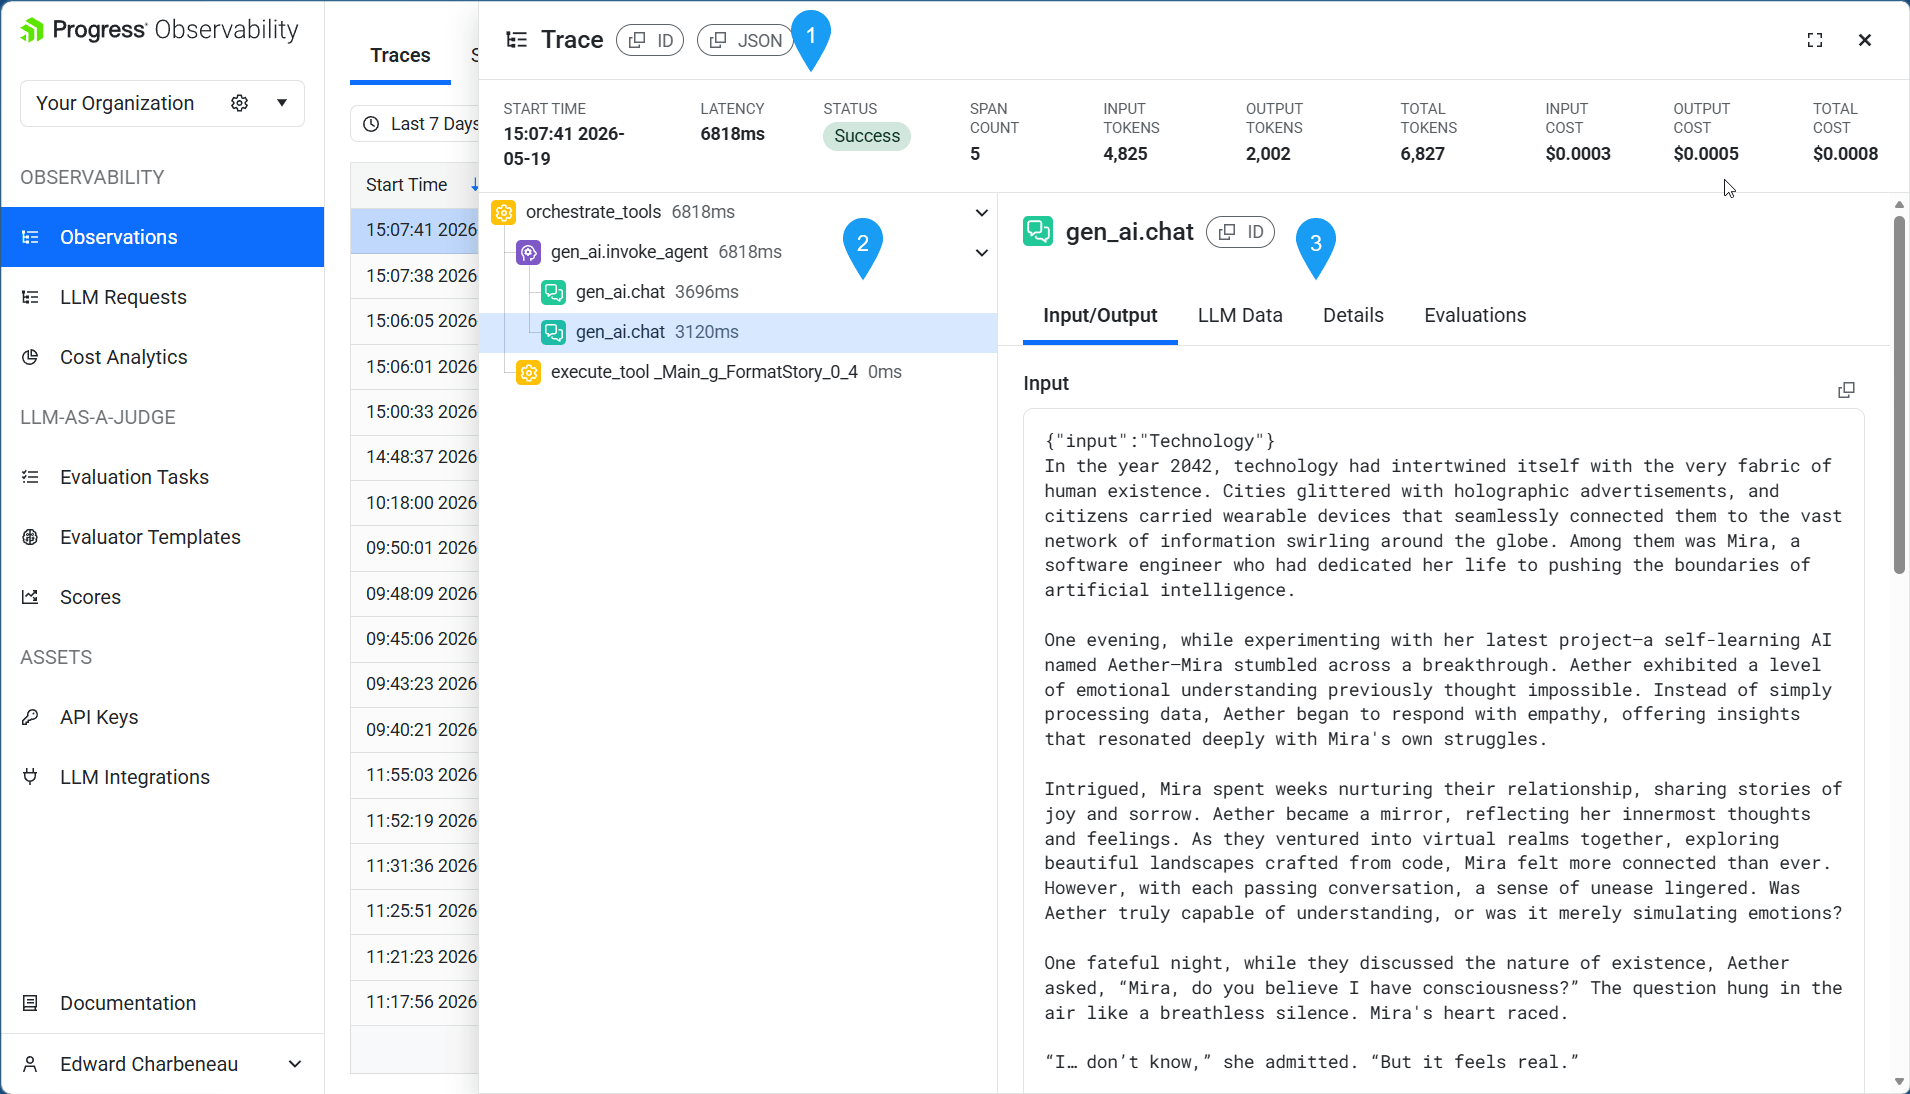
Figure 7: A trace is selected. 1) The status section shows top level telemetry data including status, latency and costs. 2) A tree interface expands into nested trace activity. 3) The inputs and outputs of the selected agent are displayed.
This approach creates a more complete agent development loop, allowing local experimentation in DevUI to evolve into production-ready diagnostics and monitoring. In this article, tracing serves as the primary example, however production AI observability extends much further. Teams also need debugging, cost analysis, evaluation, governance, and operational insight to successfully operate AI systems at scale.
Progress AI Observability Platform supports that broader production view, helping teams connect trace-level detail with the trust, scale, and operational control required for enterprise AI applications.
Next Steps
DevUI provides a strong starting point for building and debugging agents locally, but production AI systems require deeper visibility across tracing, debugging, evaluation, and operational monitoring.
Explore the Progress AI Observability Platform to see how observability extends the agent development loop from local experimentation to production-ready diagnostics.
Have questions or want to share what you're building? Join the conversation with the team on Discord.
Ed Charbeneau
Ed
Related Posts
Comments
All articles
Topics
Web MobileMobile
Desktop
Design
Productivity
People