
Does Your React App Need a Spreadsheet or Data Grid?

Summarize with AI:
Understand the differences between spreadsheets and data grids and which problems they solve best so you can make the right choice for your React application.
Spreadsheets and data grids: at first glance, they might seem to be interchangeable components. Since both use a tabular display to format large quantities of data, it can be difficult to know which option you should choose for your React application.
However, despite their similar appearances, they offer very different functionality—and choosing the wrong one will have a negative impact on your user experience. Understanding the differences between the two and which problems they solve best will enable you to make the right choices for your React application.
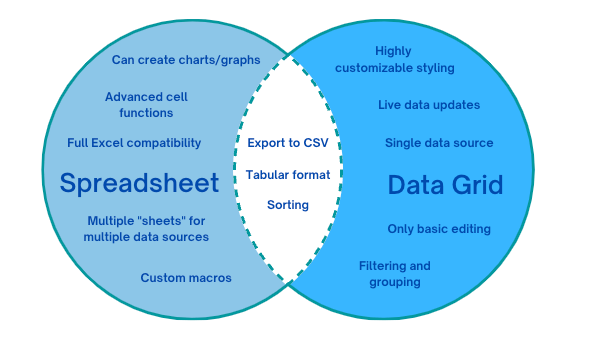
Ultimately, it comes down to whether your users’ primary goal is to edit or view the data. It can help to imagine the two components as two sides of a Venn diagram: there are some features in the middle that are available in both spreadsheets and data grids, but most of their feature sets are oriented toward accomplishing those different goals.
Where Spreadsheets Shine
Spreadsheets are ideal for complex data entry and editing. Their feature set focuses on the ability to not only make changes to huge swaths of data at once, but also to run arithmetic equations and other mathematical/financial functions on the data. Some spreadsheets will also allow users to create charts, graphs and other data visualizations based on the data. Basically, the data is the starting point in a spreadsheet—users expect to be able to manipulate that data, not just view it.
Spreadsheets also offer the ability to separate data into multiple “sheets,” the data of which can come from different sources and be interacted with independently. While these sheets can share linked data, ultimately, they operate separately from each other. This ability to handle multiple data groups is a notable distinguishing feature.
Microsoft Excel is the software that has truly set the bar for the spreadsheet experience. Even in web apps, many users will expect a spreadsheet component to meet or exceed the available features they’ve become used to using in Excel. They’ll also very much expect the layout and general user interface to mirror the Excel experience, so you’re limited in your ability to truly customize the component beyond surface-level adjustments (such as color, button shape, etc.). Along with this comes an expectation that your component plays nicely with Excel, allowing your users to upload and/or export files in Excel-compatible file types so that they can quickly and easily move data back and forth between the applications.
When Data Grids Dominate
Data grids, on the other hand, are best for viewing data in multiple ways. Their features focus on giving the users all the tools they need to mix and match the way data is shown to them, allowing them to find connections they might not have been aware of before. The data is the end goal, not the starting point of a data grid. Users will expect to be able to filter, sort, group and otherwise reorganize the way the data is shown to them when using a grid. Most data grids will allow limited editing capability, but it’s not the focus of the component.
Because of this, grids usually focus on showing data from a singular data source. The tabbed “sheets” approach of a spreadsheet isn’t relevant here. Because the user isn’t focused on editing the data, live updates are a distinguishing feature of data grids. In a spreadsheet, you wouldn’t want the data to automatically live update and refresh while a user is in the middle of running functions or doing math with it—you want the user to have full control over updating the data manually, so you don’t interrupt their work.
At the end of the day, most users will expect data grids to operate like fancy tables of data (which, to be fair, they kind of are). Because there’s not the same strict set of expectations around how tables look or are styled, designers have a lot of leeway when working with data grids. Obviously, you still want the user to be able to quickly and easily use the available data tools … but beyond that, there’s a lot of freedom! This means that data grids can often be more heavily styled in order to blend more naturally with the look and feel of the rest of your application.
Which Should I Use?
Start with the simplest thing that will satisfy the requirement, and only take the step up to the more complex component when you know that your users will need the feature set it offers. So, in this case, you might start with a simple table—if you find that you have a lot of data, and your users would benefit from pagination, sorting, filtering and grouping, then it’s time to start looking at data grids. If you have a data grid and find that your users need to make complex edits, run functions and manipulate the data without leaving your React app—then it’s time to start looking at spreadsheets.
Ultimately, if you already know that you need more than the default, basic HTML table can offer, I recommend going with a data grid, unless you know for sure that your users will need to make complex edits or perform advanced functions on the data. Spreadsheets offer a plethora of functions—which makes them incredibly powerful but can also make them incredibly overwhelming if your user is just looking to review the data. In general, it’s a good UX tip to offer only what your users need, as opposed to complicating your UI (and your codebase) with lots of buttons, features and options that won’t be used.
And remember—as developers, we tend to overestimate the percentage of “superusers,” so make sure you’re validating your assumptions about what your users need by speaking to them directly and collecting usage data. With all this in mind, you’ll be able to choose the option that’s best for your React app!
No Matter What, Kendo UI Has You Covered!
If you’re looking for a powerful, robust React Data Grid component, then you can’t beat KendoReact! Written from the ground-up entirely in React (and TypeScript!), the the KendoReact Data Grid is incredibly fast, highly customizable, 100% accessible, and absolutely packed with features—including (but not limited to) pagination, sorting/filtering/grouping, exporting to Excel and PDF, and real-time data updating.
If it turns out that the spreadsheet is truly the best fit for your application, Kendo UI can still help! While there’s not currently a spreadsheet component that’s written natively in React for KendoReact, there is a super powerful spreadsheet available as part of the Kendo UI for jQuery library. The Kendo UI Spreadsheet offers a wide array of useful features, including image embedding, commenting, cell formatting, custom functions, globalization and more!
Don’t forget—you can always see the upcoming roadmap for KendoReact features/components and let us know you’d like us to build in the future! If a KendoReact-specific Spreadsheet is important to you, please let us know though our Feedback Portal! We take all feedback seriously, and what we hear from you plays a huge part in what we put in our roadmap.

Kathryn Grayson Nanz
Kathryn Grayson Nanz is a developer advocate at Progress with a passion for React, UI and design and sharing with the community. She started her career as a graphic designer and was told by her Creative Director to never let anyone find out she could code because she’d be stuck doing it forever. She ignored his warning and has never been happier. You can find her writing, blogging, streaming and tweeting about React, design, UI and more. You can find her at @kathryngrayson on Twitter.
Related Posts
Comments
All articles
Topics
Web MobileMobile
Desktop
Design
Productivity
People
