Create Easy to Use Interactive Reports Effortlessly

Summarize with AI:
Interactivity in your reports is an easy way to add value and improve the user experience. Enable it in just a few simple steps with Telerik Reporting.
A report can display data that is adjusted per a specific user’s needs, can be discovered and accessed quickly and is easy to navigate through. Or not. It all depends on the interactivity options enabled for the report and report viewer.
Providing intuitive ways to interact with report can save time for both the report author and report user. Does it require a lot of effort to develop such a report? Not at all. In this article, I’ll try to explain how to use Telerik Reporting to enable interactivity in several simple steps.
Create Interactive Reports Easily with Report Designers
Telerik Reporting provides a variety of features introducing interactivity to the end user that can be enabled in one or two clicks using report designers.
Let's list the needs the end user might have while interacting with reports, and explain how each of these needs is provided for. After each section, I'll also link to corresponding how-to articles from our documentation so you can dig deeper.
Manipulate and Access Data On-Demand
A major challenge facing the report user when working with data-extensive reports is accessing the meaningful portion of the data, and hiding the irrelevant. This is achieved by filtering the data based on the value of report parameters.
Report parameters are a very powerful way of allowing the end user to adjust the report content and behavior. By changing the value of a parameter in the report viewer control, the end user can get different sets/visualizations of the data.
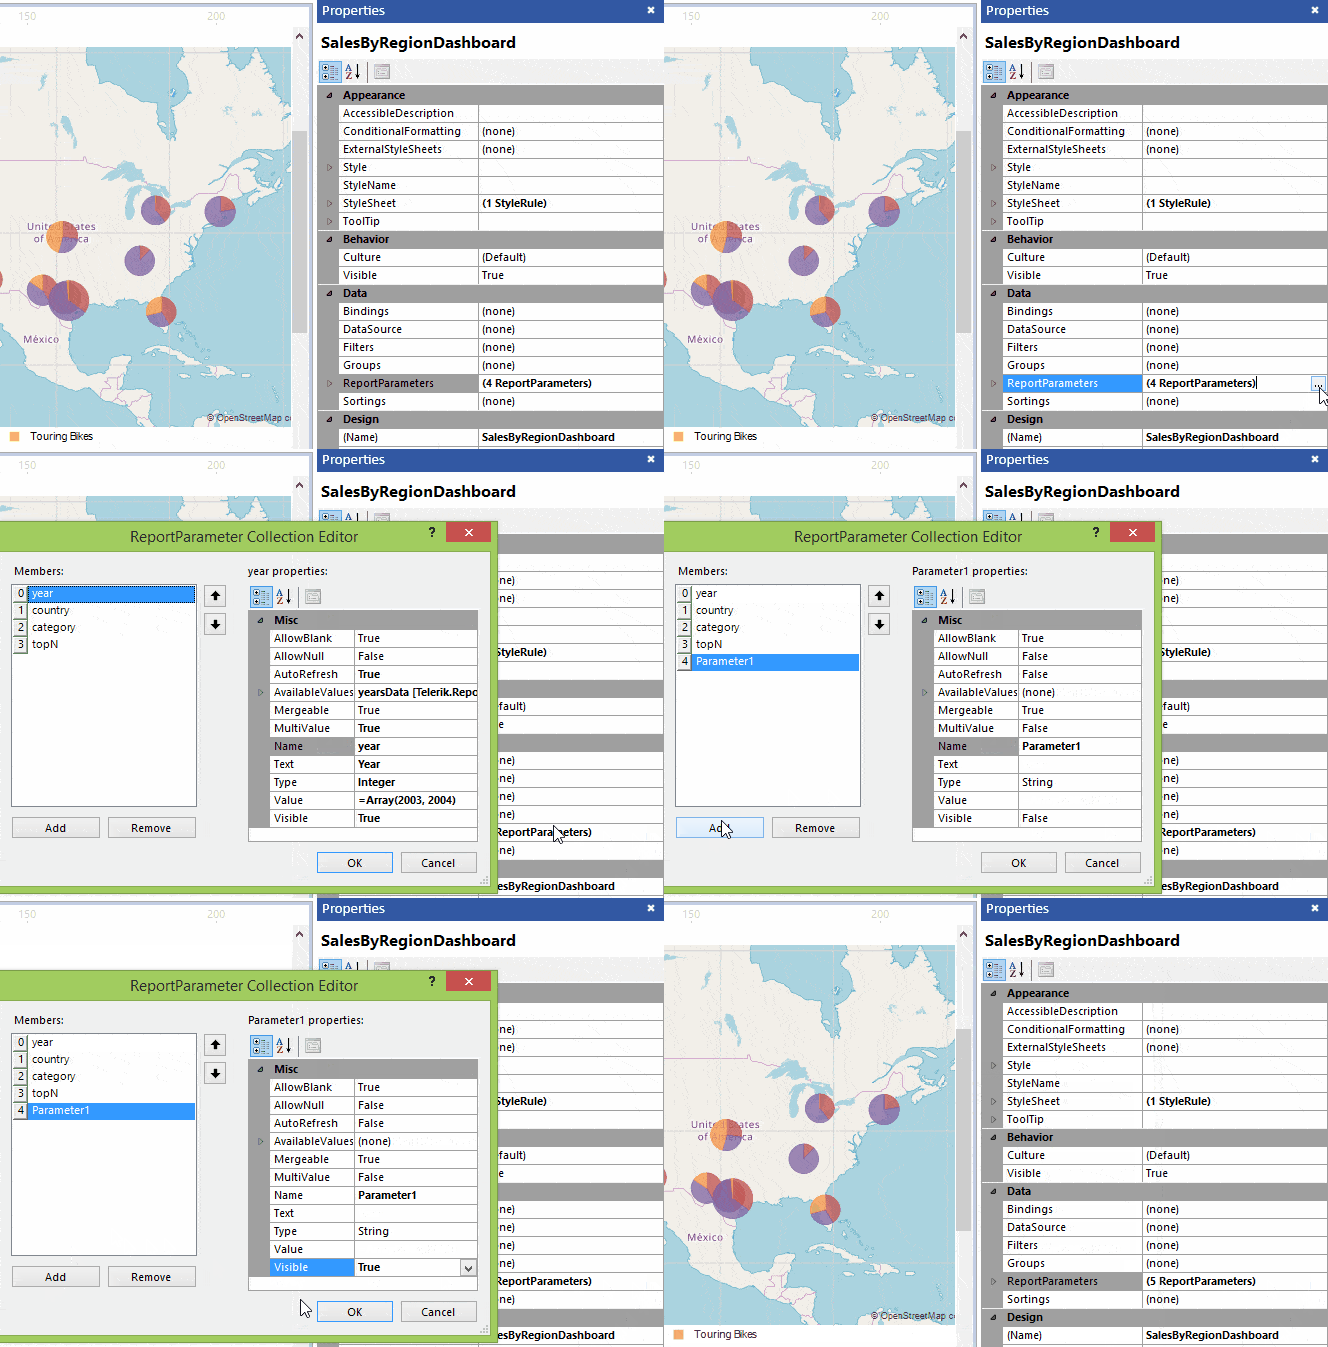
The easiest way to add a report parameter is by using ReportParameters property in the properties grid of the report, or the Report Parameters option from the context menu. After the parameter is ready, use it in the data item expressions for filtering or sorting data.

How to: Add Report Parameters
How to: Filter Data
The user can also collapse or expand portions of the data by triggering a drilldown action. Navigating to another report that contains detailed/relevant data can be done by triggering a drillthrough action which optionally accepts a parameter.
Both drilldown and drillthrough actions are added using the Actions property of the report item that triggers the action.
How to: Add a Drilldown Action
How to: Add a Drillthrough Report Action
A report user might want to get some additional information about the item by hovering over it. Such information can be shown in the form of tooltip, which is enabled using the Tooltip property of the report section or item.

Quick Access to the Data Required
End users do not want to scroll through the whole report searching for the required information. Provide them with the ability to quickly jump to a different section of the report or to some external resource using the "Navigate to Bookmark" or "Navigate to Hyperlink" actions.
Bookmarks and hyperlinks are added using the Actions property of the report item or section in its properties grid.
How to: Add a Bookmark Action
How to: Add a Hyperlink Action
Avoid Getting Lost in Report Content
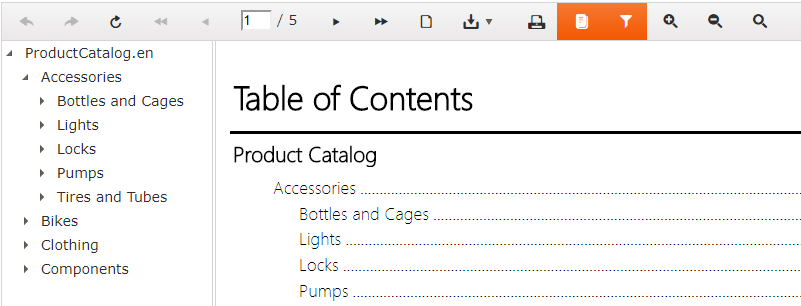
Content-rich reports can include a Document Map or Table of Contents. They can be helpful by providing an overview of the report’s content and making it easy to navigate to the desired section quickly.
A table of contents is enabled from the designer’s context menu. Report items and sections are added to it by specifying the TocText property of each item or section. A document map is enabled by specifying the DocumentMapText and BookmarkId properties of each report item/section.

How to: Add a Report Item to Table of Contents
How to: Add a Report Item to Document Map
Interactivity Accessible to a Wider Audience
Some groups of report users might need to interact with the report in a particular way. This includes users with motor control restrictions and those working with assistive technologies. Enabling accessibility for report viewer controls is a great option to provide a smooth interaction with the report for such users.
Accessibility is enabled with the enableAccessibility property of the report viewer control. Optionally, key mapping can be changed through the AccessibilityKeyMap property.
How to: Set up accessibility features in HTML5-based viewers
How to: Set up accessibility features in WinForms viewer
How to: Set up accessibility features in WPF viewer
Provide Even Richer Experiences with Custom Interactivity Actions
Until now, I’ve described interactivity features that can be enabled simply from the designers' built-in editors. Advanced report creators that wish to extend interactivity features can add custom actions. The purpose of a custom action is to trigger the report viewer's interactive action event handler that provides a customized experience for the end user.
New Features Coming Soon
There will be more interactivity features on the way in the upcoming releases of Telerik Reporting, such as the ability to search in report’s content for the end user, and accessibility for the Report Server application. Be sure to stick around and stay tuned!
Try for Free Today
Excited to start creating interactive reports for your clients? Start a free trial of Reporting today.
Get Reporting in Telerik DevCraft
You can purchase Telerik Reporting as an individual product or as a part of the Telerik DevCraft bundles. This product bundles feature a full set of UI, reporting and developer productivity tools for .NET and JavaScript platform development. Thanks to our intuitive APIs, alongside thousands of demos with source code availability, comprehensive documentation and a full assortment of VS templates you will get up and running with our tools in no time and fully embrace your inner Kendoka/Ninja warrior. And by leveraging the broad array of themes, skins, styling and customization options available with each UI toolkit and the reporting solution, your application will awe even the best frontend designers.
Check out Telerik DevCraftTry Telerik Reporting

Ekaterina Martynyuk
Ekaterina Martynyuk is a Technical Support Engineer in the Telerik Reporting division. She focuses on customer's satisfaction and bringing customer's feedback to the product development stage. She enjoys being out in nature and visiting new places.
