Advanced AI Observability: Context, Loop Detection and Token Counts with Progress Agent Engineering

Summarize with AI:
With observability, we can connect agent behavior to real business cases, catch performance bottlenecks and keep costs more predictable.
When we start with AI agent observability, we usually begin with the basics: capturing spans, tool calls and token counts, as covered in the previous observability post.
In production, observability is about more than raw events. It helps connect agent behavior to real business cases, catch performance bottlenecks and keep costs predictable.
When users interact with our agents, we need answers to real questions:
- Which user waited 35 seconds for a response?
- Why did the agent trigger four hotel searches instead of one?
- Why did a single trip plan cost ten times more tokens than expected?
- How do we trace internal database queries inside custom tools?
Today, we take our travel planner to the next level. We will learn how to inject business metadata with propagateAttributes(), diagnose reasoning loops, audit token leaks with wrapFunctionWithSpan(), instrument backend services with decorators, and configure production privacy guardrails.
Let’s make this work in a real project!
Getting Started
If you want code with me, I recommend you clone the project repository and move into its folder:
git clone https://github.com/danywalls/genkit-progress-observability.git
cd genkit-progress-observability
npm install
Check the available branches:
git branch --all
You will see two branches:
article-start: The base agent from our first article.main: The completed agent with advanced observability.
To follow it step by step, switch to the starter branch:
git checkout article-start
But before starting, we need two API keys:
- A Google AI Studio API key to run the Gemini model.
- A Progress Agent Engineering integration key to capture traces and spans.
Create a .env file in the project root:
GOOGLE_API_KEY=your-google-api-key
OBSERVABILITY_API_KEY=ac_p_your-integration-key
OBSERVABILITY_APP_NAME=family-travel-planner
GEMINI_MODEL=gemini-2.5-flash
Verify that the agent runs:
npm run dev
Now, let’s inject business metadata into our traces.
Injecting Business Metadata with propagateAttributes()
In our previous article, the Progress Agent Engineering captured spans under the service name family-travel-planner. But in a busy production environment, your trace list receives hundreds of executions every minute.
Searching for a failed run by raw timestamp or random trace IDs like 4bf92f3577b3... is not easy, because when customer support receives a ticket, they hear: “User usr_4102 on the VIP tier tried to plan a trip to Ibiza, and the request timed out.”
The Progress SDK helps us solve this with propagateAttributes(). Think of this as a shared context for your execution. Any tags you inject automatically flow down to every child span created during that request, including Genkit flows, Gemini model calls and custom tool executions.
Open src/app.ts and wrap the trip planning call with propagateAttributes():
// In src/app.ts
import { Observability, propagateAttributes } from '@progress/observability';
import { planTrip } from './agent.js';

async function main() {
  const { destination, numAdults, numKids, kidAges, budget } = parseArgs();

  // Simulated authenticated user session
  const session = {
    userId: process.env.USER_ID ?? 'usr_4102',
    tier: (process.env.USER_TIER ?? 'vip') as 'standard' | 'vip' | 'enterprise',
  };

  try {
    console.log(`Starting travel planner for user ${session.userId} (${session.tier} tier)...`);

    // Propagate business tags across all child spans in this execution
    const plan = await propagateAttributes(
      [
        `user:${session.userId}`,
        `tier:${session.tier}`,
        `destination:${destination}`,
        `family-size:${numAdults + numKids}`,
        `budget:${budget}`,
      ],
      async () => {
        return await planTrip(destination, numAdults, numKids, kidAges, budget);
      }
    );

    console.log(`\nDestination: ${plan.destination} (${plan.duration})`);
    console.log(`Total Estimated Cost: ${plan.totalEstimatedCost}`);
  } catch (error) {
    console.error('Error during execution:', error);
    process.exitCode = 1;
  } finally {
    await Observability.shutdown();
  }
}

main();
Now we do not need to pass user IDs through every function argument or manage low-level OpenTelemetry span objects.
Run the project from your terminal:
npm start -- Ibiza 2 2 moderate 7 5
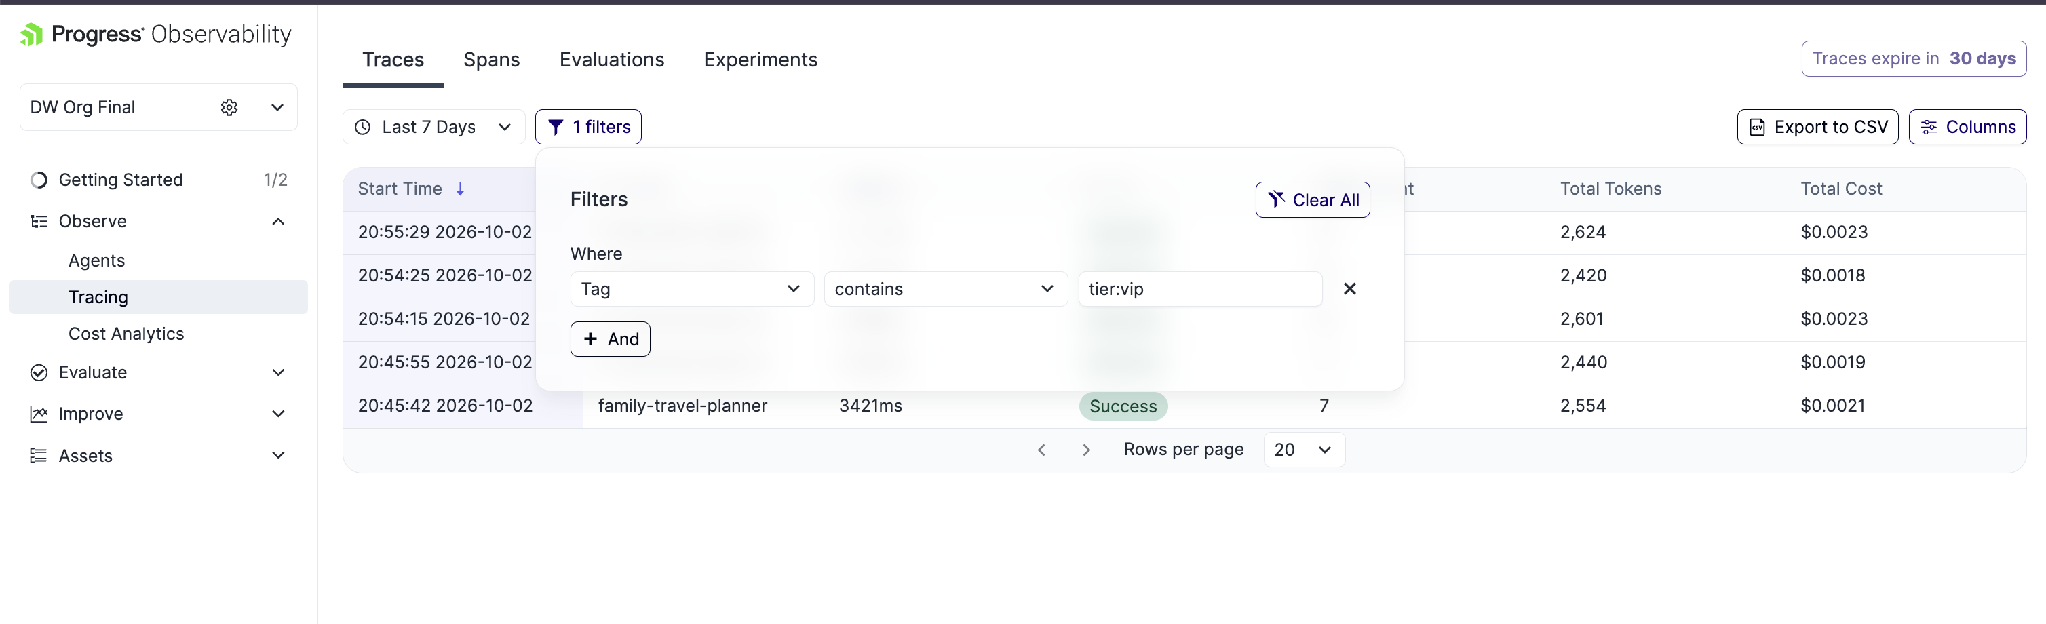
Now open the Progress observability dashboard at https://observability.progress.com and go to Observe > Tracing:
- Click on Filters in the top bar.
- Select Tag, set condition to contains and type
tier:vip(oruser:usr_4102). - The dashboard filters out unrelated traffic and shows only matching runs.
Click on the execution, then select any child tool span like find-hotels:
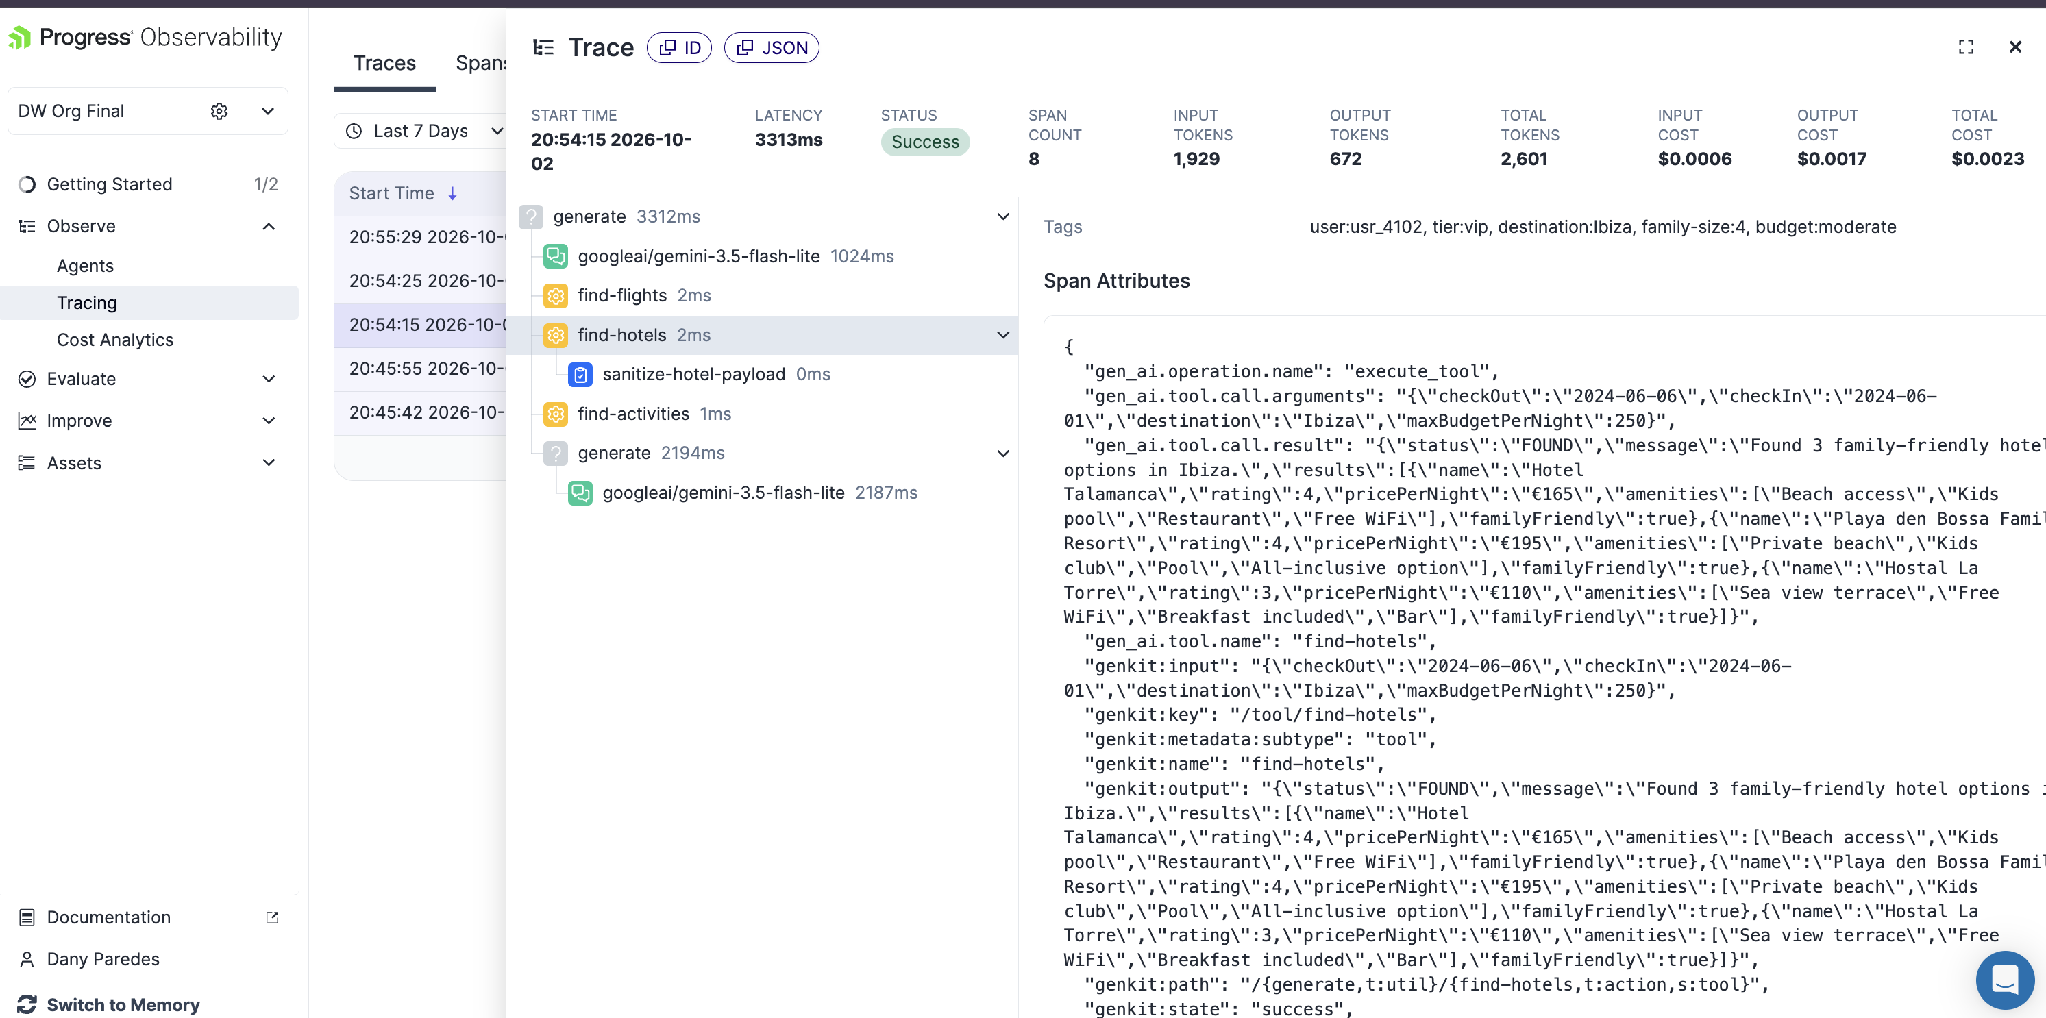
The find-hotels span displays our business tags (user:usr_4102, tier:vip, destination:Ibiza). The tags flowed down the entire execution tree automatically.
So far, we have attached business context to our traces. Now, let’s see what happens when tools return unexpected data and agents get stuck in loops.
Diagnosing Reasoning Loops with Trace Visualizations
The AI agents operate in an iterative cycle: the model reads the prompt, calls a tool, reviews the tool’s output and decides what to do next.
What happens when a tool returns empty data?
Suppose a user asks for a luxury beachfront hotel in Ibiza for under €30 per night. Our hotel tool searches its records, finds nothing and returns an empty array: [].
To us, [] is a valid result. But to an LLM, an empty array is confusing. The model assumes its search parameters were slightly off, so it adjusts the keywords and queries again. It calls the tool a second time, gets [] again, and calls it a third and fourth time.
This pattern is called an agent reasoning loop. The agent repeats tool calls without making progress, wasting execution time and multiplying token costs.
When an agent loops, the trace visualization in Observe > Tracing reveals clear warning signs:
generate (Genkit flow)                      42.4s
├── find-hotels (destination: "Ibiza")       0.2ms TOOL (returned [])
├── gemini-2.5-flash                        6.2s  LLM  (retries)
├── find-hotels (destination: "Ibiza")       0.1ms TOOL (returned [])
├── gemini-2.5-flash                        7.1s  LLM  (retries)
└── find-hotels (destination: "Ibiza")       0.1ms TOOL (returned [])
You can identify a reasoning loop by three clear signals:
- Repeated tool spans: A long staircase of the same tool call.
- Growing latency: Total duration jumps from 3 seconds to over 40 seconds.
- Growing token usage: Each retry carries all previous failed attempts in the prompt history.
We fix this by combining two safety mechanisms:
- Step limits (
maxTurns): Set a hard limit on turns so Genkit stops the execution if the agent loops. - Defensive tool responses: Never return a silent empty array
[]. Return a clear message explaining why there are no results and instruct the model not to retry.
Open src/tools/hotels.ts and update the search logic with a defensive response schema:
// In src/tools/hotels.ts
import { z } from 'zod';

export const HotelResponseSchema = z.object({
  status: z.enum(['FOUND', 'NO_MATCHES', 'ERROR']),
  message: z.string().describe('Clear guidance for the model about the search result'),
  results: z.array(HotelSchema),
});

export type HotelResponse = z.infer<typeof HotelResponseSchema>;

export function getHotelsDefensive(
  destination: string,
  stayNights = 3,
  maxBudget?: number
): HotelResponse {
  const key = normalizeDestination(destination);

  if (key === 'default') {
    return {
      status: 'NO_MATCHES',
      message: `No partner hotels found in "${destination}". We currently only support Ibiza and Menorca. Do not retry this search.`,
      results: [],
    };
  }

  // Detect unrealistic budget limits early
  if (maxBudget !== undefined && maxBudget < 100) {
    return {
      status: 'NO_MATCHES',
      message: `No certified family-friendly hotels in ${destination} match a budget of €${maxBudget}/night. The lowest rate starts at €110/night. Inform the user to adjust their budget. Do not attempt another hotel search.`,
      results: [],
    };
  }

  const hotels = getHotelsForDestination(destination, stayNights);
  return {
    status: 'FOUND',
    message: `Found ${hotels.length} family-friendly hotel options in ${destination}.`,
    results: hotels,
  };
}
Next, open src/agent.ts and set maxTurns: 4 on the generation call:
// In src/agent.ts
const result = ai.generateStream({
  model: modelName,
  prompt: promptTemplate,
  tools: [findFlightsTool, findHotelsTool, findActivitiesTool],
  maxTurns: 4, // Safety guardrail: stops runaway reasoning loops
  output: { schema: TravelPlanSchema },
});
When the tool returns status: 'NO_MATCHES' with explicit instructions, the LLM stops immediately. Instead of looping, it tells the user to adjust their budget.
Run the project again. Open the execution trace in the Progress observability tool dashboard:
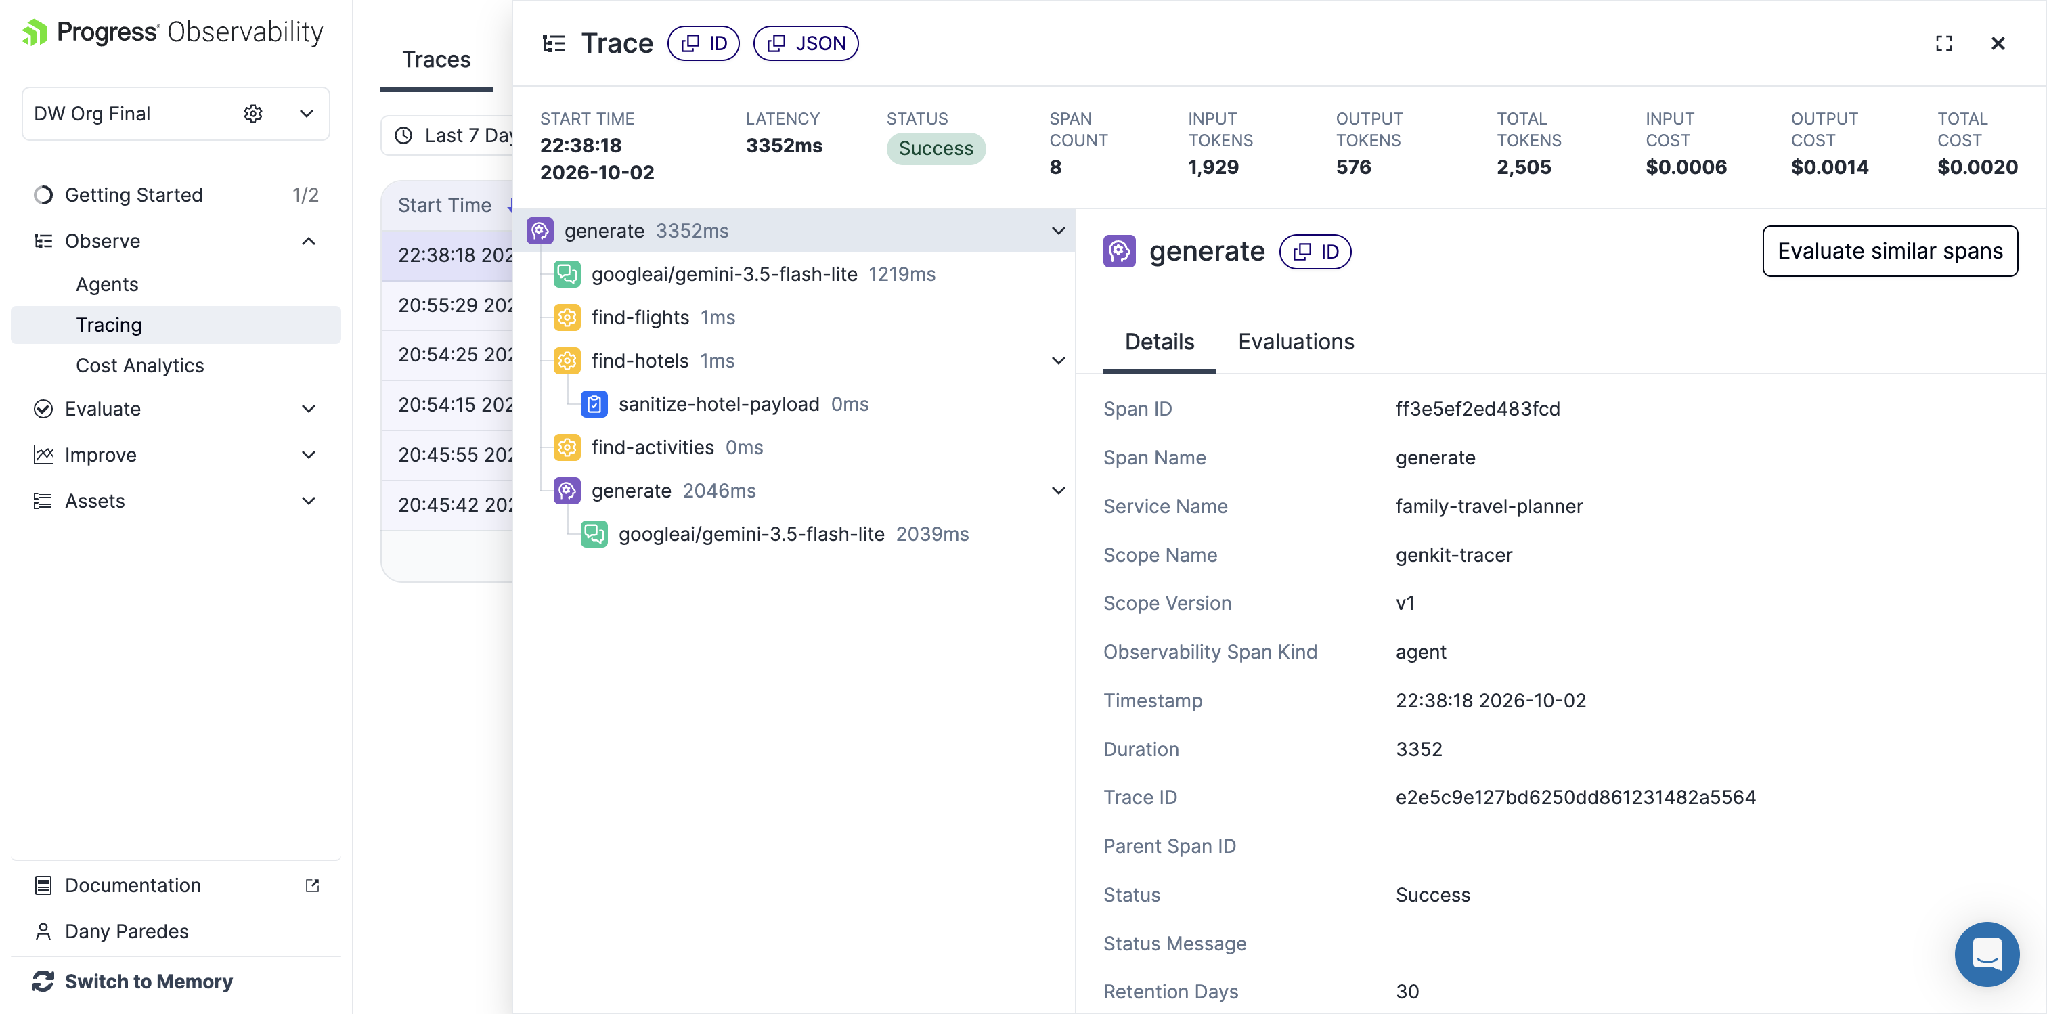
Look at the execution flow:
- Turn 1 (Tool Gathering): Gemini analyzes the request and calls
find-flights,find-hotelsandfind-activities. - Turn 2 (Synthesis): Gemini receives the tool outputs and builds the final itinerary.
- Clean Execution: The flow finishes in two turns with eight total spans in 3.3 seconds. No loops, no retries.
We have protected our agent against reasoning loops. Now, let’s examine how heavy tool payloads cause token leaks and how to trace internal data operations.
Auditing Token Leaks and Tool Payload Sanitization
In tutorials, tools return clean, minimal JSON. In real applications, tools query partner APIs or databases.
A single hotel API call often returns 30 to 50 results. Each hotel object includes database IDs, tax breakdowns, room inventory codes, image URLs and cancellation policies.
If your tool passes that raw payload back to Genkit, the entire 20+ KB response enters the model context. Because agents send previous tool outputs on every turn, that bloated payload gets re-sent on every subsequent step.
The solution is use a Data Transfer Object (DTO) pattern: always filter external data so the model receives only the fields it needs.
Genkit tracks top-level tool calls automatically. But how do you trace internal operations, such as data pruning or local cache checks?
The Progress SDK provides wrapFunctionWithSpan() to create custom child spans inside any function.
Open src/tools/hotels.ts and add payload sanitization with wrapFunctionWithSpan():
// In src/tools/hotels.ts
import { wrapFunctionWithSpan, ObservabilitySpanKind } from '@progress/observability';

export interface CleanHotelDTO {
  name: string;
  rating: number;
  pricePerNight: string;
  keyAmenities: string[];
}

export function sanitizeHotelResults(
  rawList: RawExternalHotel[],
  limit = 3
): CleanHotelDTO[] {
  return rawList.slice(0, limit).map((hotel) => ({
    name: hotel.display_name,
    rating: hotel.stars,
    pricePerNight: `€${hotel.price_eur}`,
    keyAmenities: hotel.amenities.slice(0, 4),
  }));
}

// Wrap the function to record a custom child span
export const sanitizeHotelPayloadTraced = wrapFunctionWithSpan(
  sanitizeHotelResults,
  'sanitize-hotel-payload',
  {
    spanKind: ObservabilitySpanKind.TASK,
    tags: ['operation:payload-sanitization'],
  }
);
When getHotelsForDestination() runs, it calls sanitizeHotelPayloadTraced() on the raw vendor data before returning clean results to the model.
Notice the impact on token consumption and performance:
| Metric | Raw Vendor Response | Sanitized DTO | Savings |
|---|---|---|---|
| Payload Size | 22.4 KB | 0.5 KB | 97.7% reduction |
| Input Tokens | ~6,200 tokens | ~360 tokens | 94.2% reduction |
| Model Latency | 7.4 seconds | 1.8 seconds | 75.6% faster |
| Cost per Run | ~$0.0048 | ~$0.0003 | 16x cheaper |
Run the project again. In the Progress observability dashboard, expand the find-hotels tool span:
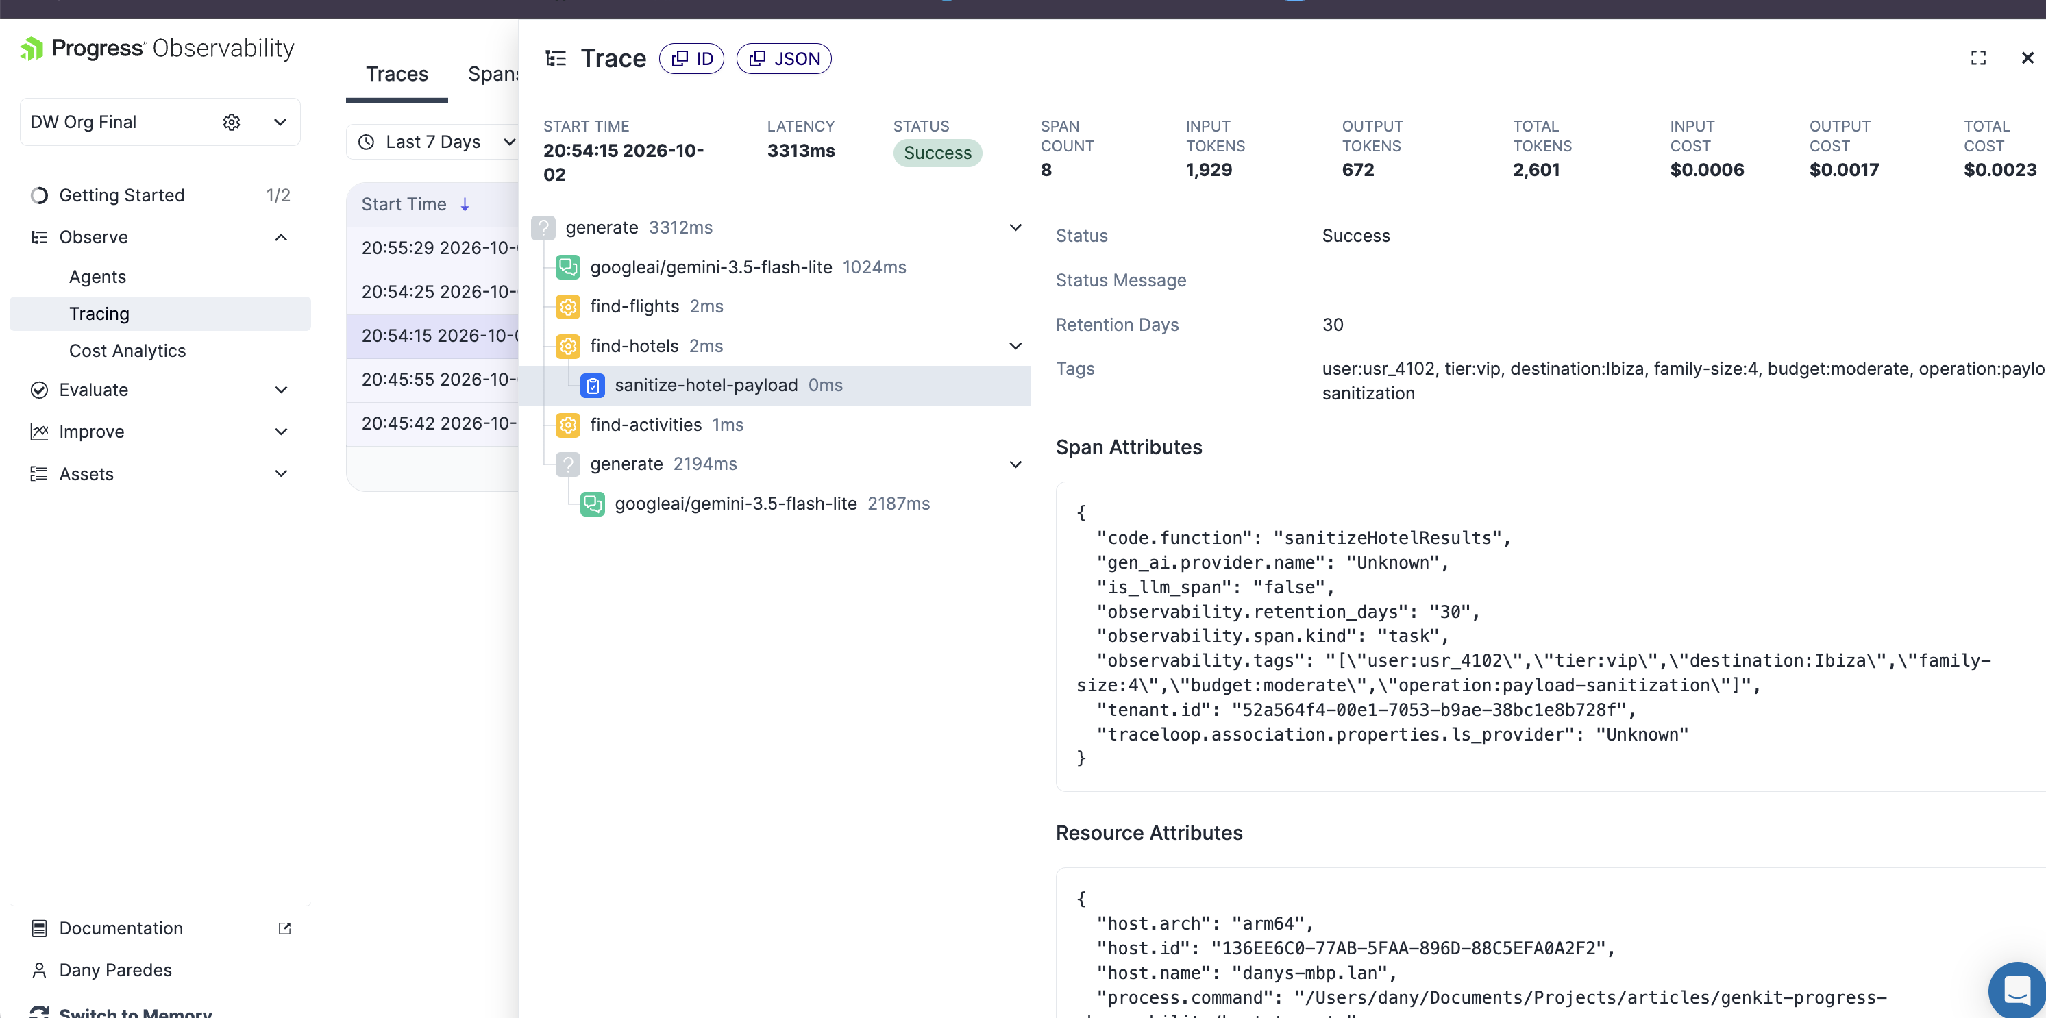
Notice the new child span:
- Under
find-hotels, a child span namedsanitize-hotel-payloadappears with typeTASK. - The right panel displays the tag
operation:payload-sanitization. - The span automatically inherits active business tags (
user:usr_4102,tier:vip).
You can now measure the exact duration of your sanitization logic independently from external network latency.
So far, we have instrumented standalone functions. Now, let’s look at how to instrument class-based backend services with decorators.
Backend Services with @workflow and @task
What happens when our agent needs to rely on existing backend services, such as payment processors, reservation managers or inventory databases?
The Progress SDK provides TypeScript decorators (@workflow and @task) to connect class methods directly into the active trace tree.
Create src/services/booking.ts:
// Create src/services/booking.ts
import { task, workflow } from '@progress/observability';

export interface BookingConfirmation {
  reservationId: string;
  hotelId: string;
  status: 'CONFIRMED' | 'FAILED';
}

export class BookingService {
  @workflow({ name: 'hotel-booking-flow' })
  async bookHotel(userId: string, hotelId: string): Promise<BookingConfirmation> {
    await this.verifyAvailability(hotelId);
    await this.processPayment(userId);
    return await this.confirmReservation(hotelId);
  }

  @task({ tags: ['db-query'] })
  private async verifyAvailability(hotelId: string): Promise<boolean> {
    return Boolean(hotelId); // Simulated inventory query
  }

  @task()
  private async processPayment(userId: string): Promise<boolean> {
    return Boolean(userId); // Simulated payment gateway call
  }

  @task()
  private async confirmReservation(hotelId: string): Promise<BookingConfirmation> {
    return {
      reservationId: `RES-${Date.now()}`,
      hotelId,
      status: 'CONFIRMED',
    };
  }
}
Make sure your tsconfig.json has "experimentalDecorators": true enabled.
By adding @workflow and @task, your service methods appear as child spans under the active execution. You can quickly see whether a delay came from the model or an internal database query.
So far, we have instrumented our application layers. Now, let’s configure production privacy guardrails.
Production Privacy Guardrails with traceContent
Observability requires capturing telemetry, but production systems must protect user privacy.
In local development, recording prompt texts, tool inputs and model outputs are helpful for debugging. In production, users enter sensitive information: traveler names, children’s ages and personal notes.
Under privacy regulations like GDPR, CCPA and SOC2, storing unmasked personal data in telemetry systems creates compliance risks.
The Progress SDK provides the traceContent option in bootstrap.ts to solve this cleanly.
Open bootstrap.ts and set traceContent based on your environment:
// In bootstrap.ts
import { Observability, ObservabilityInstruments } from '@progress/observability';

// Enable full content tracing only outside of production
const isProduction = process.env.NODE_ENV === 'production';
const traceContent = !isProduction && process.env.OBSERVABILITY_TRACE_CONTENT !== 'false';

await Observability.instrument({
  appName: process.env.OBSERVABILITY_APP_NAME ?? 'family-travel-planner',
  apiKey: process.env.OBSERVABILITY_API_KEY,
  instruments: new Set([ObservabilityInstruments.GOOGLE_GENERATIVEAI]),
  traceContent,
});

if (traceContent) {
  console.log('[observability] Content tracing is active (development mode)');
} else {
  console.log('[observability] Content tracing is disabled (metadata and metrics only)');
}

await import('./src/app.js');
When NODE_ENV=production is set, traceContent: false tells the SDK to capture execution times, span hierarchies, tool names, token counts and costs, while keeping raw prompt text and personal data out of cloud logs.
Run the agent in production mode:
NODE_ENV=production npm start -- Ibiza 2 2 moderate 7 5
The terminal confirms that privacy mode is active:
[observability] Content tracing is disabled (metadata and metrics only)
Starting travel planner for user usr_4102 (vip tier)...
Your trace records full operational metrics (latency, token counts and span hierarchy), while maintaining user privacy.
Conclusion
Observability is what helps us turn an AI experiment into a reliable, production-ready software system. Today, we explored five core observability practices with the Progress SDK:
- Business Metadata: We used
propagateAttributes()from the Progress Agent Engineering observability platform to attach user and session context across the entire span tree. - Loop Prevention: We combined
maxTurnsand defensive tool envelopes to stop agent reasoning loops. - Token Leak Auditing: We used DTOs to prune vendor payloads and tracked the sanitization with
wrapFunctionWithSpan(). - Backend Instrumentation: We used
@workflowand@taskdecorators to trace service methods. - Production Privacy: We configured
traceContentto protect sensitive user data in production.
With these practices in place, you can build AI agents with confidence that your system is inspectable, efficient and cost-effective.
Get started with the Progress Agent Engineering platform for free.
Happy observability!
Additional Resources

Dany Paredes
Dany Paredes is a Google Developer Expert on Angular and Progress Champion. He loves sharing content and writing articles about Angular, TypeScript and testing on his blog and on Twitter (@danywalls).
Related Posts
Comments
All articles
Topics
Web MobileMobile
Desktop
Design
Productivity
People