Telerik UI for ASP.NET AJAX
What's New 2024 Q3
What's New HistoryTelerik UI for ASP.NET AJAX Chart Series Enhanced with a Pyramid Chart
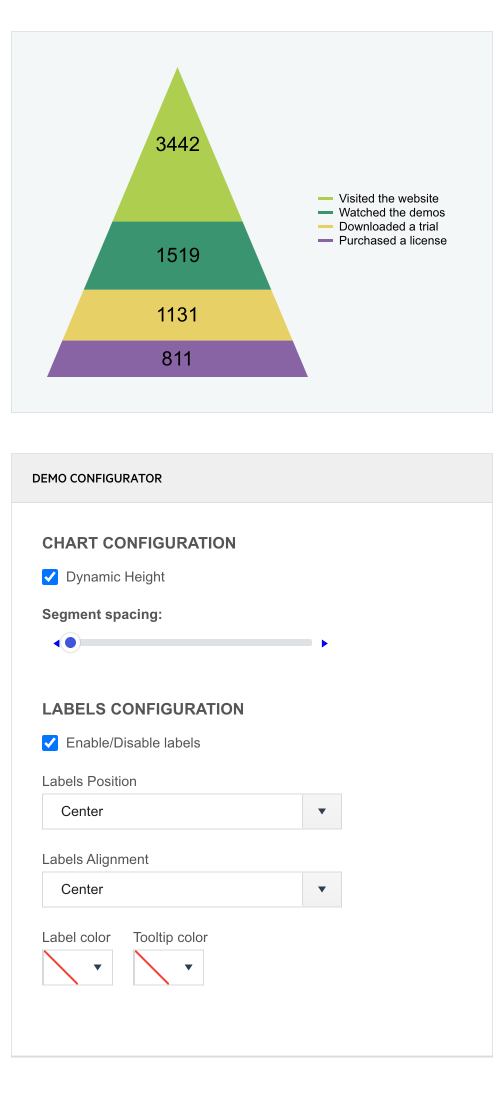
Leverage the Telerik UI for ASP.NET AJAX Pyramid Chart to visualize a single series of data in progressively increasing proportions. These data series are organized into segments where one represents the value for the particular item from the series. The values of the items also influence the height and the shape of the corresponding segments.
Pyramid Charts are suitable when you want to compare and contrast your data, communicate data in an easy-to-read format, understand large amounts of data quickly or display the relative proportions of different items. This Chart series is often used to represent stages in a priority process, population visualization, singular datasets, etc.
See the Telerik UI for ASP.NET AJAX Pyramid Chart demo

Introducing Telerik UI for ASP.NET AJAX Chip
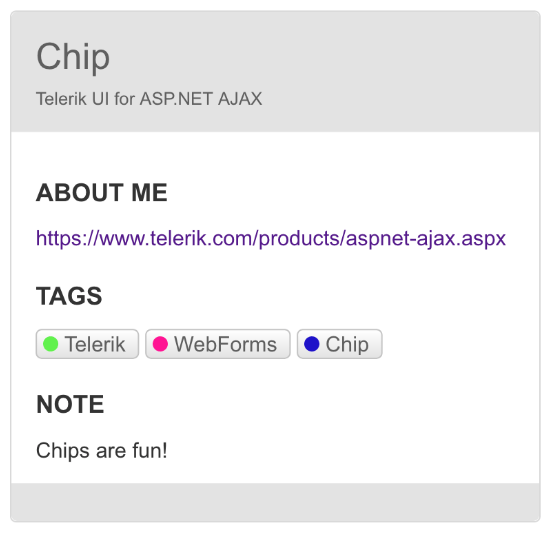
Create compelling UX by listing items in stylish containers called chips or pills with the Telerik UI for ASP.NET AJAX Chip component. This small building block component offers various options to control its appearance, such as size, border radius, theme color, and fill mode. You can leverage the Chip individually or alongside other components to showcase unique values selected by the user.
See Telerik UI for ASP.NET AJAX Chip demo

New Telerik UI for ASP.NET AJAX ChipList Control
Organize a collection of individual ASP.NET AJAX Chips and manage it with actions for adding and removing items. The newly introduced Telerik UI for ASP.NET AJAX ChipList component is mostly used for single or multiple selections, e.g., including additions to an ordered meal. You can play with its appearance through the available size, border radius, theme color, and fill mode options.
See Telerik UI for ASP.NET AJAX ChipList demo

New features & Roadmap
Have a feature request?
Post your feedback via the ASP.NET AJAX Feedback Portal.
What's new across all Telerik products?

Next Steps
See Telerik UI for ASP.NET AJAX in action and check out how much it can do out-of-the-box.
Check out the offers. Purchase an individual suite, or treat yourself to one of our bundles.
Try Telerik UI for ASP.NET AJAX with dedicated technical support.


