Building SQL Queries the Easy Way
The Web Report Designer lets you build SQL queries in two ways:
- By using a visual tool (where you click and select options)
- By using a text tool (where you type the query)
A query is just a set of instructions that specifies what data you want from a database. By using a query, you connect your report only to the data you need. The Web Report Designer works with the most common data providers (like ADO.NET, ODBC, or OLEDB) as long as they can share details about the columns in the database using a feature called GetSchema.
The graphical query builder helps you find information in a database without writing code. You can click to choose the tables and columns you need, and then see the results. If you use more than one table, you need to show how the tables are connected.
The graphical Query Builder in the Web Report Designer has the following advantages:
- Intuitive Query Creation—The graphical interface lets you create SQL queries by clicking and selecting options instead of writing code. This makes it simple to use and helps avoid mistakes.
- Faster Development—You can create even complicated queries easily with a few steps. The user interface also allows you to create the necessary JOIN relationships between related tables in an intuitive manner.
- Immediate Result Preview—The Query Builder lets you see the results of your query before you add them to the report. This helps you make sure everything looks correct and saves time.
Building Your First Query
To create a query using the Query Builder in the Web Report Designer:
-
Create an new report.
-
Add an SQL Data Source item.
-
Connect to the desired SQL Data Source.
To follow along with the steps below, use the AdventureWorks database.
-
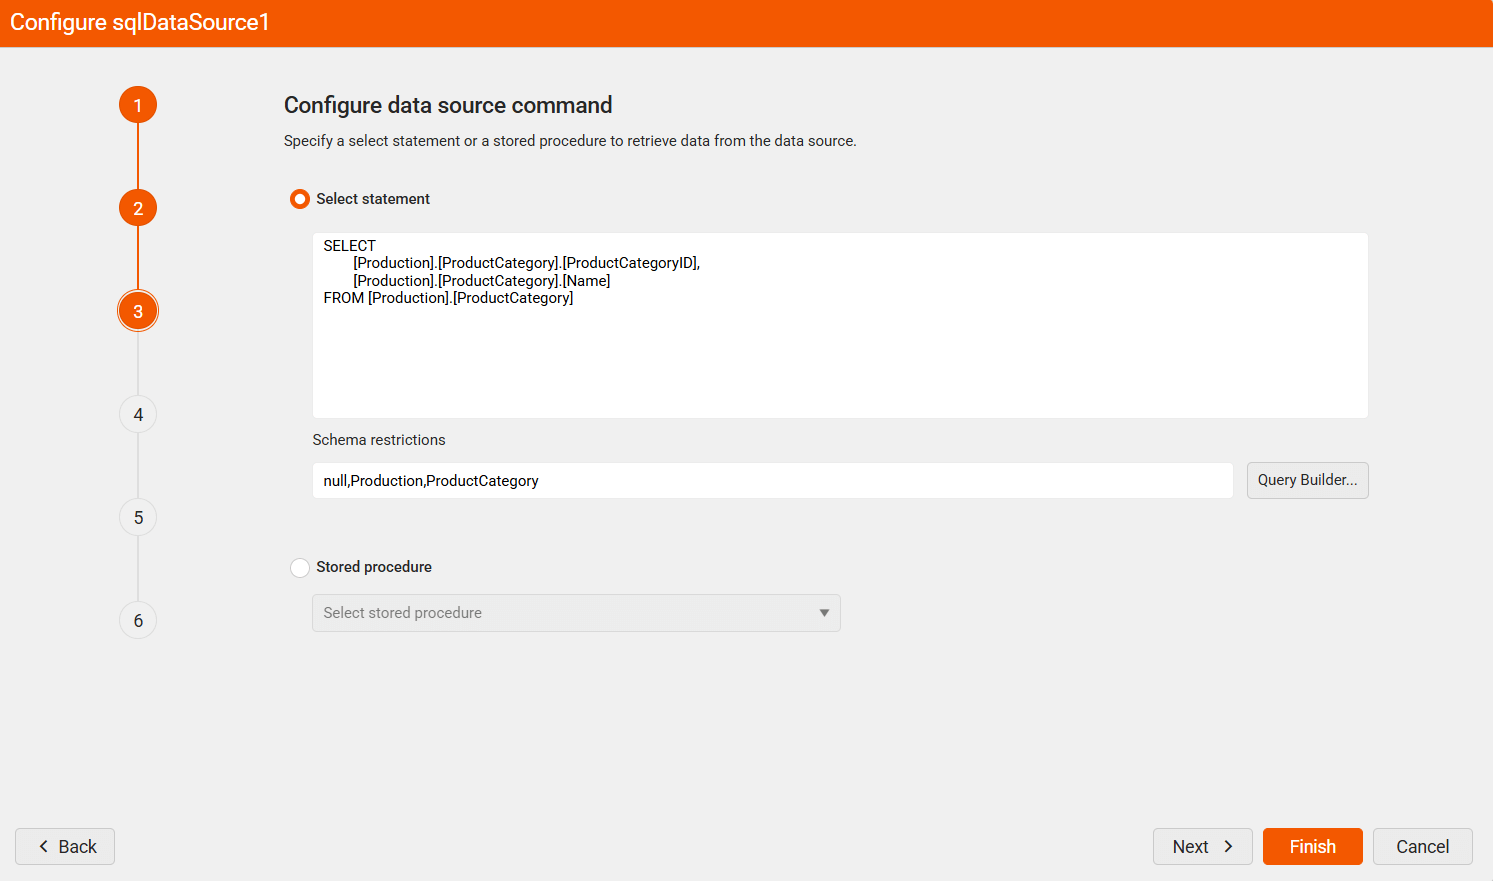
In the Select statement section, use the following query:
SELECT
        [Production].[ProductCategory].[ProductCategoryID],
        [Production].[ProductCategory].[Name]
FROM [Production].[ProductCategory]-
(Optional) Apply any schema restrictions that apply to your chosen SQL Data Source.
-
Click the Query Builder button.
-
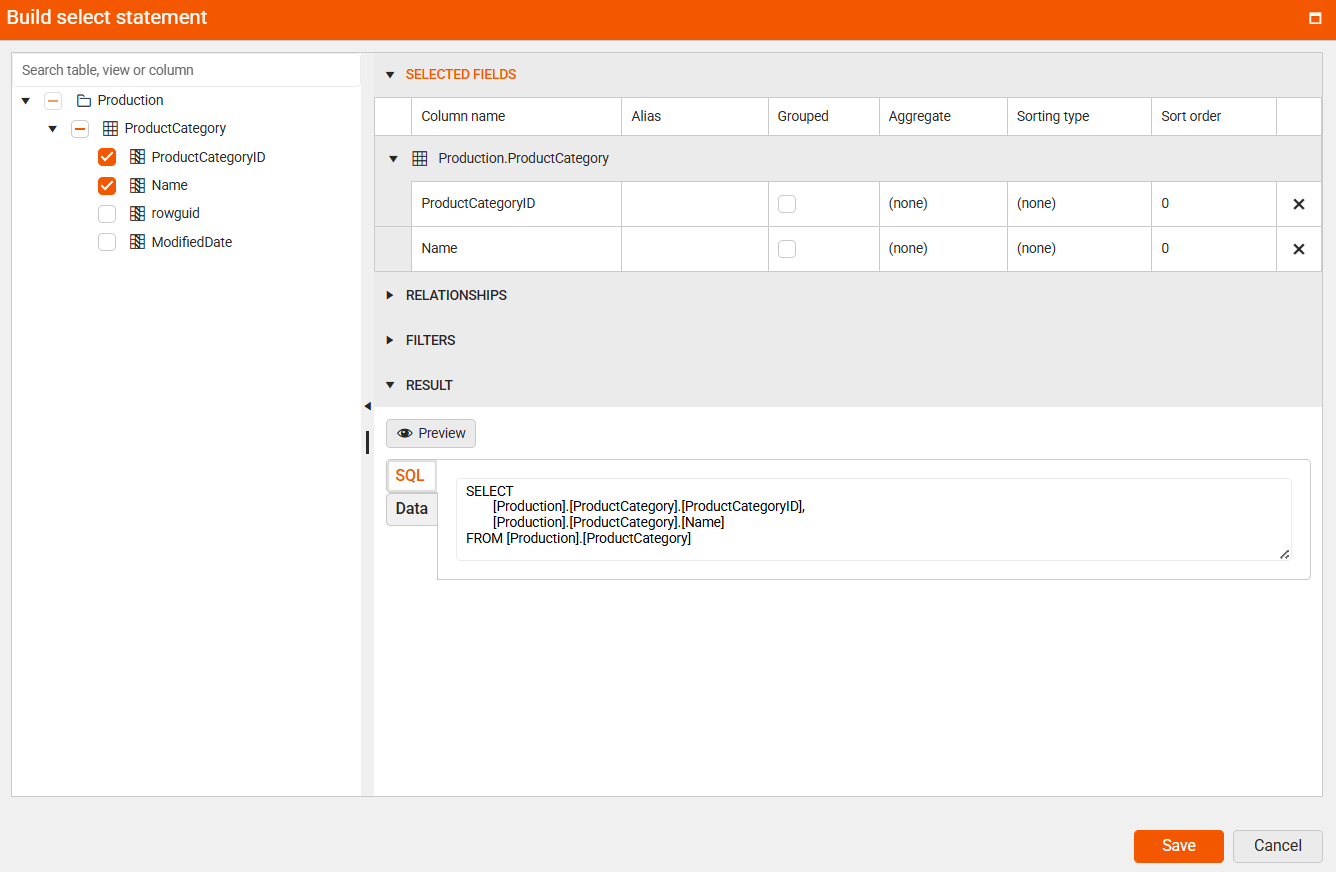
In the new window, build your SELECT statement:
7.1. In the left pane (the DataBase view), select the
Namefield from theProductCategoryand theProductSubcategorytables.
7.2. In the Add relationship window, select the fields (ProductCategoryID) that link the two tables and click Save.
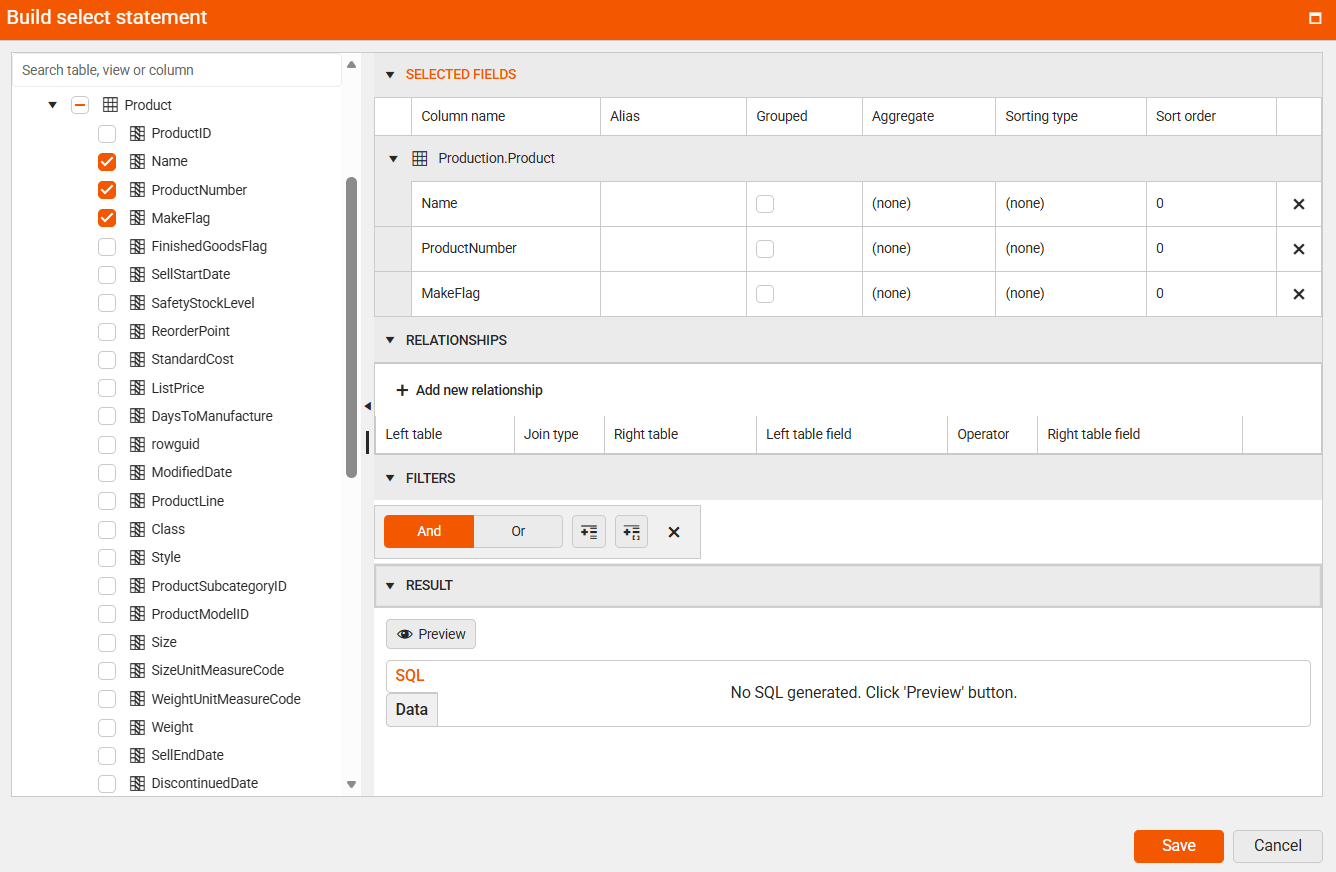
7.3. Select theNamefield from theProducttable.
7.4. Define the relationship between theProductSubcategoryandProducttables through theProductCategoryIDfields and then click Save.
7.5. Select theListPricefield from theProducttable.
7.6. Set the alias (display name) for each column.
7.7. To reduce the number of records that will be displayed, add a filter. For example, products with a list price between 100 and 500. -
To preview the query and the resulting data, expand the RESULT section and click Preview.
-
Click Save to confirm your query.
The following video shows a step-by-step guide to the scenario described above:
Query Builder Sections
The following sections describe the function of each area:
| Name | Description |
|---|---|
| 1. Database View | Displays a structured list of tables and views grouped by database sections |
| 2. Selected Fields | Displays the list of field names from the selected items in the database view |
| 3. Relationships | Displays how the selected tables are connected |
| 4. Filters | Displays a list of options you can use to filter tables or views |
| 5. Result | Displays example data for the query that was created automatically |
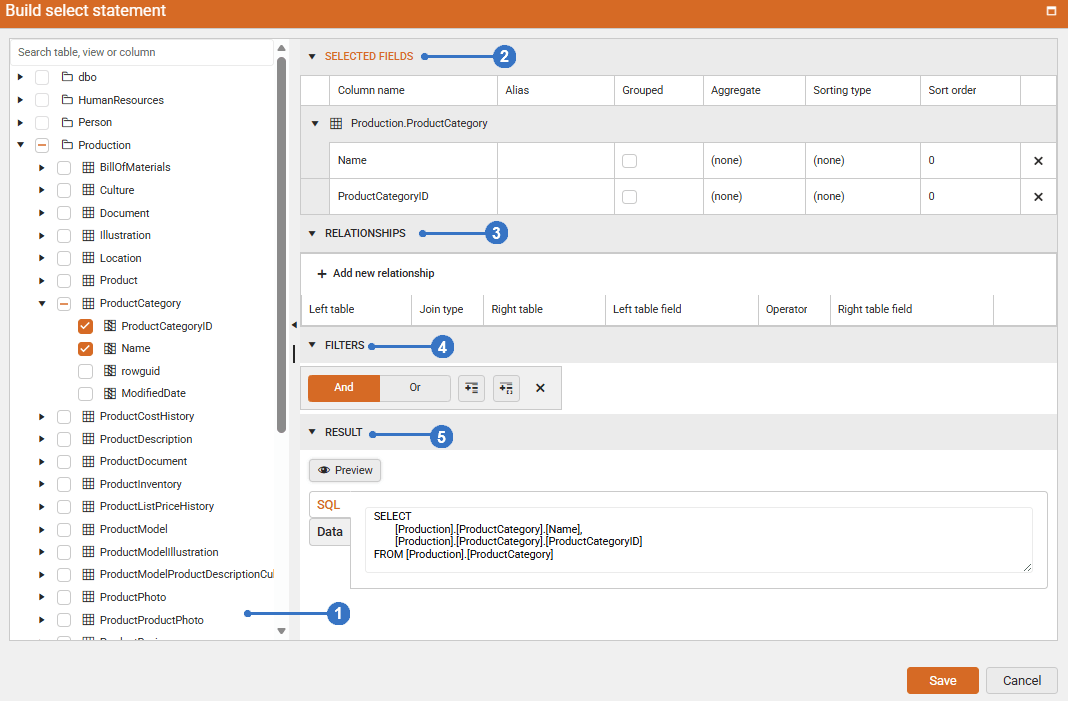
Database View Pane
On the left side of the screen is the Database View. This area displays the database items available to the user based on login permissions. The items are arranged in a hierarchical tree structure, grouped by category. Each category contains related tables and views, and these tables or views include their respective columns.
When you check a column in this pane, it will automatically move to the Selected Fields pane. If you check a table, all its columns will be added to the Selected Fields pane. If you check more than one table, the Relationship Editor pane will open automatically.
Selected Fields Pane
The Selected Fields pane shows the columns you chose to include in your query. These columns become the set of fields used for your report. You can use these fields to display data in tables, charts, and other report elements when viewing the report.
The following columns are displayed:
| Name | Description |
|---|---|
| Column name | Displays the names of the selected fields, grouped by the table or view they come from |
| Alias | If the last added field name is already used, an alias will be created automatically. You can also change or add aliases manually |
| Grouped | Displays a checkbox that lets you choose if the field should be used for grouping |
| Aggregate | Displays the calculation that will be applied to the field. You can choose Count, Max, Min, Average, or Sum. If a field is grouped, it cannot have a calculation. By default, Sum is used for all fields that are not grouped when the Grouped checkbox is selected |
| Sorting type | Displays the sorting type for the field. You can choose (none), Ascending (A to Z or smallest to largest), or Descending (Z to A or largest to smallest). By default, (none) is selected, which means the field will not be sorted |
| Sort order | Displays the order in which the field sortings should be applied |
| Remove | Includes a button to remove this field from the query. You will be asked to confirm before the field is deleted |
Relationships Pane
The Relationships pane shows how the selected tables are linked together, using SQL JOIN statements (which are instructions that tell the database how to combine data from different tables).
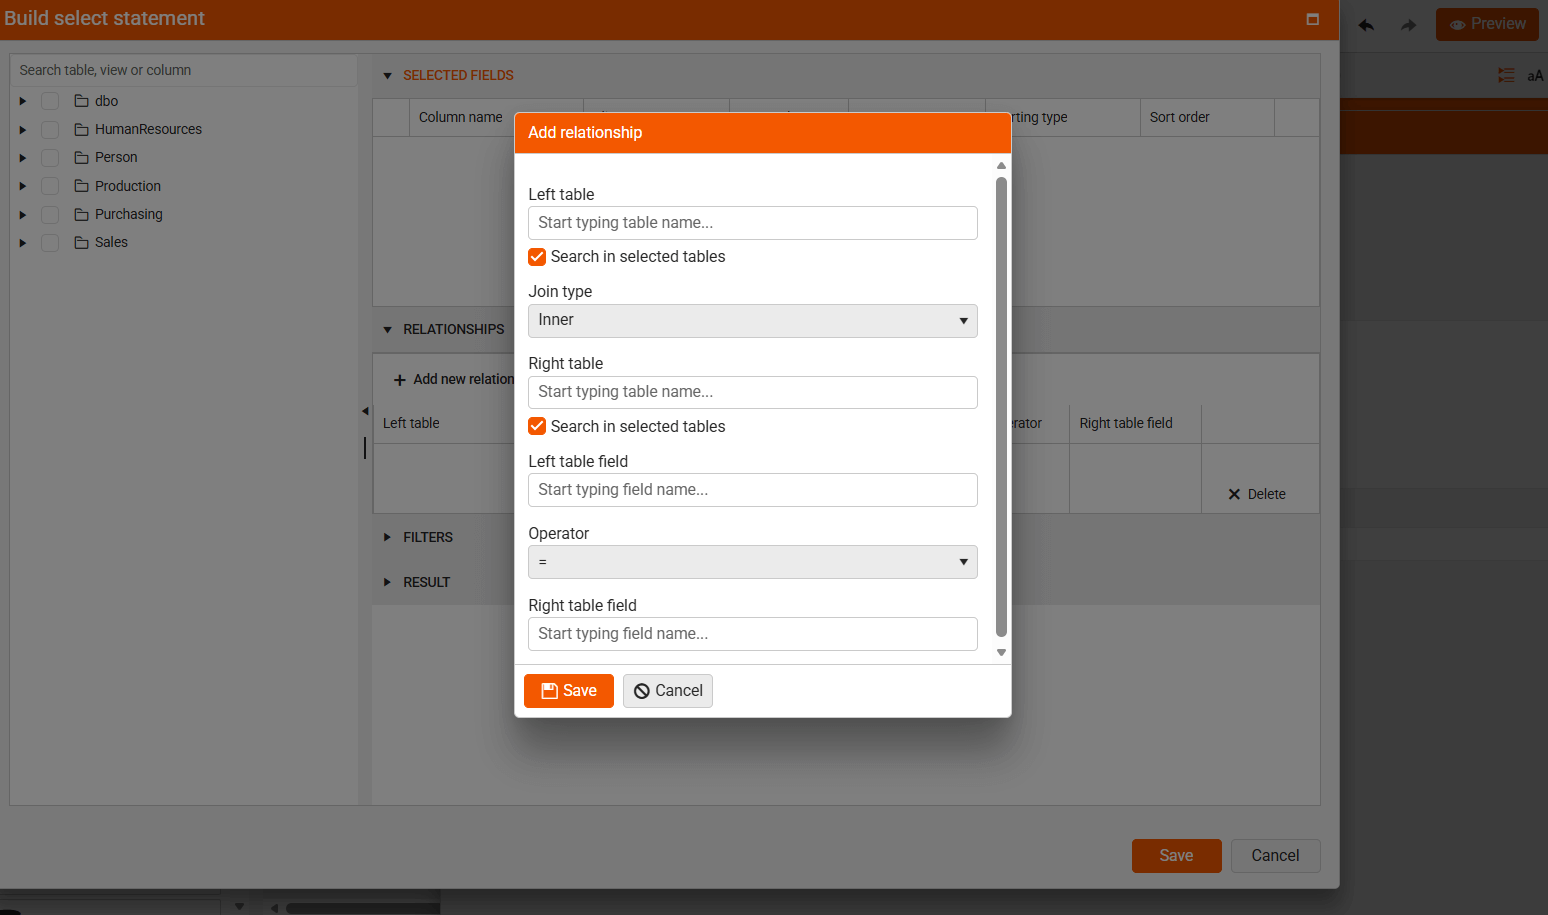
The following options are available:
- Add new relationship Opens the relationship editor, which lets you set up connections between tables or views. These relationships tell the system how to combine data. When using multiple relationships in a query, each new table must be related to one that is already included.
The following columns are available:
| Name | Description |
|---|---|
| Left table | Displays the name of the first table that is part of the join relationship |
| Join type | Displays the type of SQL join used in the automatically created query. The join types you can choose from are Inner, Left, Right, Outer, and Unrelated |
| Right table | Displays the name of the second table that is part of the join relationship |
| Left table field | Displays which field from the left table will be used to match data in the join statement |
| Operator | Displays the operator used on the left and right fields from the joined tables |
| Right table field | Indicates which field from the right table should be used in the join statement |
| Edit/Remove | Contains buttons to edit or remove the current relationship |
Filters Pane
The Filters pane shows the conditions used to narrow down the data you see. These conditions help the system choose only the rows that match and create a rule for finding them.
The following options are available:
| Name | Description |
|---|---|
| Logical operator | Choose how the filters in this group should work together. The available options are And and Or |
| Add Expression | Add a new filter expression to the current group |
| Add Group | Add a new filter group that can have a different logical operator. Filter groups can be defined hierarchically |
| Close | Remove the current filter group and all of its child filter expressions |
The following columns are displayed:
| Name | Description |
|---|---|
| Field Name | Displays the name of the field to apply the criteria |
| Operator | The operator to use in the filter expression |
| Value/Parameter name | The value or parameter name to add to the query |
| Preview value | The value to use for the Result pane |
| Delete | Remove the current filter expression from the expression group |
Result Pane
The Result pane shows the query that is created based on your choices in the other sections. It can also give you a preview of the data that will appear when the query runs. The columns you see in the results are the fields you selected earlier.
The report does not store the actual data. The data is only fetched when the report is generated.
The following options are available:
-
Preview button—Preview the query created from your selections or see the data it will return
-
SQL/Data switch—Choose whether to preview the SQL query that was created for you or the data it will return.
Query Builder State
When you click Save, the SqlDataSource Wizard Select Statement will be replaced by the new SQL query that was generated.
The Query Builder keeps your current settings. But if you change the SQL query manually and then use the Query Builder again, it will replace your changes with its own version.
Schema Restrictions
The Web Report Designer’s Query Builder has an option called Schema Restrictions. This option lets you choose which parts of the database to load by listing them with commas. It helps report creators see only the information needed and makes loading faster.
null,Production,ProductCategorySchema restrictions are sensitive to uppercase and lowercase letters, and empty values are allowed. If you need to set a value to nothing, use the word null as shown in the example. These rules only work with .NET 8 or newer.